
This page is a reference for the Query Definition Editor in the Pricefx. You build a Query Definition as a visual workflow on a canvas. Each step of the query is a Building Block (node), and you connect the blocks in the order in which the query processes the data.
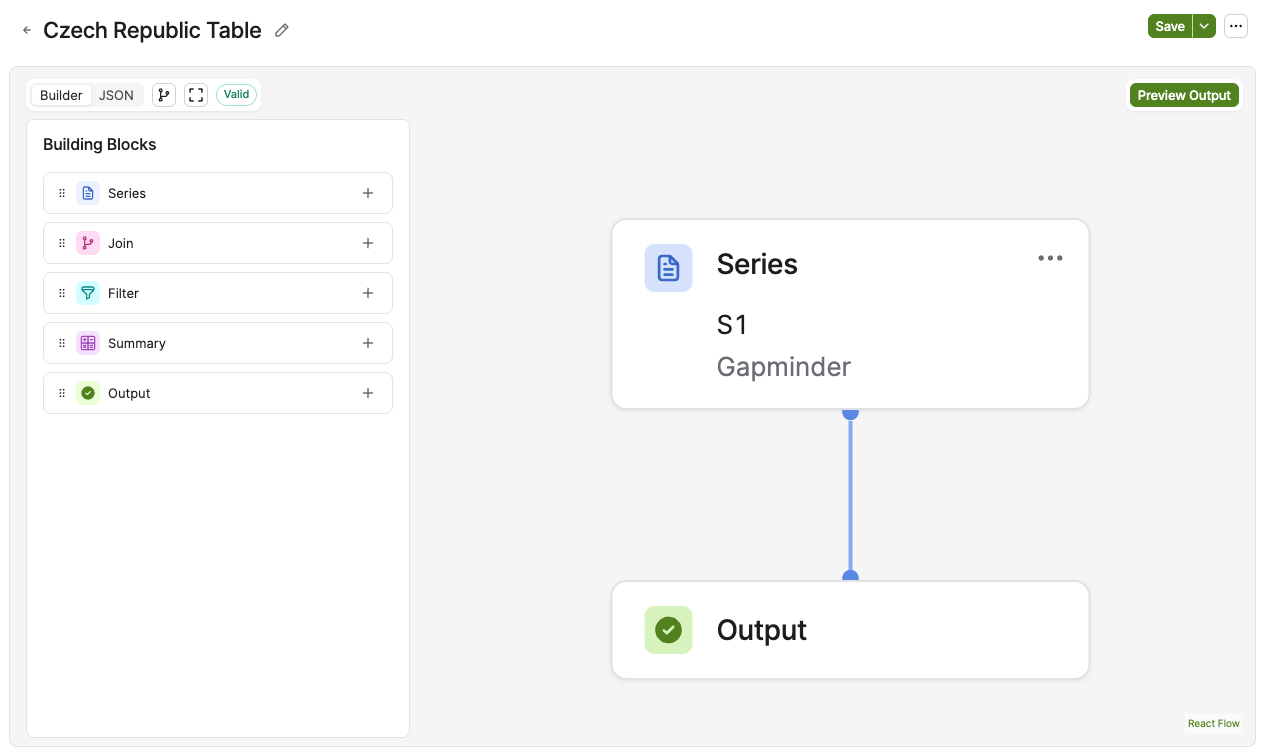
Building Blocks
Series
Each Series has an ID, for example S1, which the editor assigns automatically. You can also give a Series a Label, for example Series 1. The label is saved with the query and is shown in the field lists of the following blocks. See Field Origin in Field Lists.
-
Source Data – This section defines primary data source for the query.
-
Source – Defines what Data Source will be used for this query.
-
Select Column(s) – Limits the columns used in the query. By default, no columns are selected. You must select at least one column from the source for the query to proceed, as this field is mandatory.
-
Currency – Defines which currency the money data will be converted into.
-
Join
Combines the data of two Series, for example S1 and S2.
-
Join – This section defines how the Join node combines the data of two Series.
-
Join Type – This field defines how the Join node combines rows from the two branches. The options are:
-
Inner Join – This option keeps only the rows that find a match on the other side.
-
Left Outer Join – This option also keeps every row from the left side that has no match. The columns from the right side stay empty for those rows.
-
-
-
Join Keys – This section defines the fields that match the rows of the two Series. The Join node matches rows where these fields are equal on both sides. Only grouping fields (dimensions) can be keys.
-
Previous Results / Source – These mandatory fields select the key field from each joined Series (
S1,S2, etc.). Before you connect the Series, the labels are Previous results and Source. -
Map on – This button adds another pair of key fields. More keys make the matches more specific.
-
-
Calculated fields – This section defines new columns that a formula calculates from the joined columns. A calculated field is available in the next nodes like any other column.
-
Add Calculated Field – This button opens the Expression Editor to define a calculated field.
-
-
Output Fields – This section defines what the Join node passes on to the next node. You can leave out columns from the joined Series. A calculated field is always part of the result.
-
Select Fields – This field selects the columns from the two joined Series that the Join node passes on. By default, the Join node passes on all columns. Each option shows the source, the field and the Series label, for example Testing Actin Data: Country [S1]. A column that you leave out stays available to calculated-field formulas.
-
Calculated fields — always included – This item shows that every calculated field is part of the result. To remove a calculated field, delete it in the Calculated fields section.
-
Filter
Adds conditions to filter the results.
-
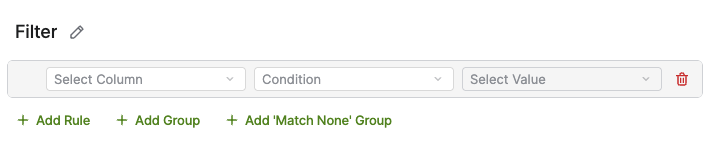
Filter – This panel defines the conditions that narrow down the data that the Filter node passes on to the next node.
-
Rule – This row defines one filter condition. A rule has three fields:
-
Select Column – This field selects the column to filter by. Each option shows the source and the column, for example Meatball_customer: Country.
-
Condition – This field selects how the Filter node compares the column with the value, for example equals. A condition without (match case) ignores letter case. A condition with (match case) is case-sensitive.
-
Select Value – This field selects the value to compare with, for example China.
-
-
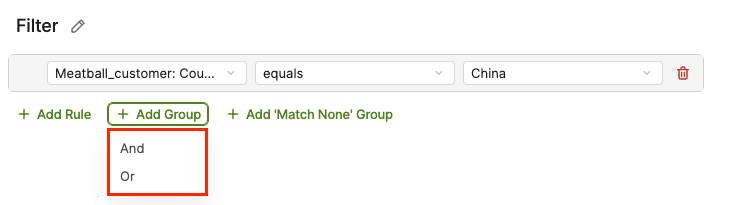
AND / OR – This operator connects the rules and groups at the same level.
-
And returns rows that match all rules.
-
Or returns rows that match at least one rule.
-
-
Add Rule – This button adds a new rule.
-
Add Group – This button adds a group of rules. A group has its own rules and its own And / Or operator.
-
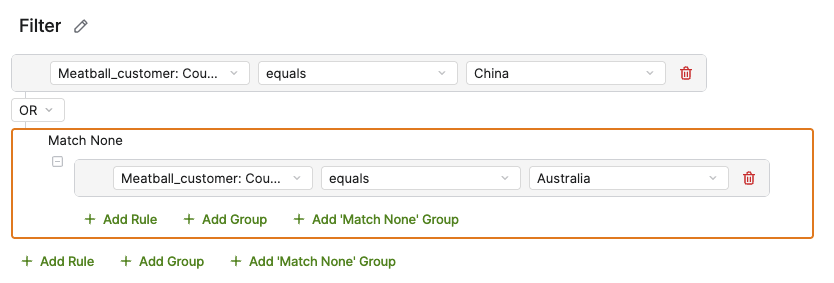
Add 'Match None' Group – This button adds a group whose rules must not be fulfilled. The Filter node returns only rows that match none of the rules in the group.
-
Match None – This label marks a 'Match None' group. The group has its own Add Rule, Add Group and Add 'Match None' Group buttons.
-
-
Summary
Summarizes the data with Measures and Group By.
-
Summary – This panel summarizes the data by grouping it by dimensions and calculating aggregated Measures.
-
Measure table – This table lists the Measures that the Summary node calculates. Each row has these columns:
-
Measure – This column shows the field that the Measure is based on.
-
Label – This column defines the label of the Measure. By default, the label is generated from the Measure and the aggregation, for example ∑ Quantity. You can change it. The label is saved with the query and is shown wherever the Measure is used later in the query, for example in the field lists of a Join or Filter and in the Result Preview. To refer to the Measure in a formula, use its Name, not its label.
-
Aggregation – This column defines how the Summary node aggregates the Measure, for example ∑ (Sum). The { } Function option opens the Expression Editor. The available aggregation types depend on the field type (numeric or text).
-
Numeric Fields
-
∑ Sum
-
Ø Average
-
{ } Function
-
-
Text Fields
-
# Count
-
# Count Distinct
-
{ } Function
-
-
-
Name – This column shows the name alias of the Measure. You use the name to refer to the Measure in a formula. The default name is generated, for example m1.
-
-
Measure By – This button adds a Measure. The list shows the fields of the connected Series, for example Testing Actin Data: Country [S1]. You can search the list.
-
Group By table – This table lists the fields that the Summary node groups the data by.
-
Group By – This button adds a field to group by. The list shows the fields of the connected Series, for example Meatball_customer: Country [S2]. You can search the list.
-
-
Output
Defines the result of the query. A query must have exactly one Output node.
Editor Tools
-
Builder / JSON – Switches between the canvas and the JSON view. Under it:
-
Copy JSON and Download JSON.
For more information see Copy Query JSON and Download Query JSON.
-
Paste JSON – Opens Paste Query JSON dialog.
-
-
Auto Layout – Arranges the nodes on the canvas automatically. The positions of the nodes on the canvas are saved with the query. When you reopen the query, the nodes appear where you left them. Auto Layout rearranges them, and the new layout is saved the next time you save the query.
-
Fit View – Zooms the canvas so that all nodes are visible.
-
Valid / Invalid – shows the validation state of the whole query.
-
Preview – Each node has its own preview button, for example Preview Join, and Preview Output shows the whole query.
-
Add building block – Click + next to a building block, or + below a node on the canvas.
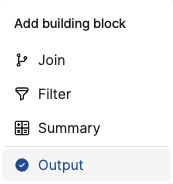
Add building block menu -
Add Section – Adds a section to a building block. This option is available only in the Summary block. The options are:
-
Join Data – Combines data from multiple sources.
-
Filter Data – Adds conditions to filter the results.
-
Row Limit – Restricts the number of rows in the output.
-
Sort Data – Sorts the data based on the selected columns.
-
Summarize Data – Summarizes the data with Measures and Group By.
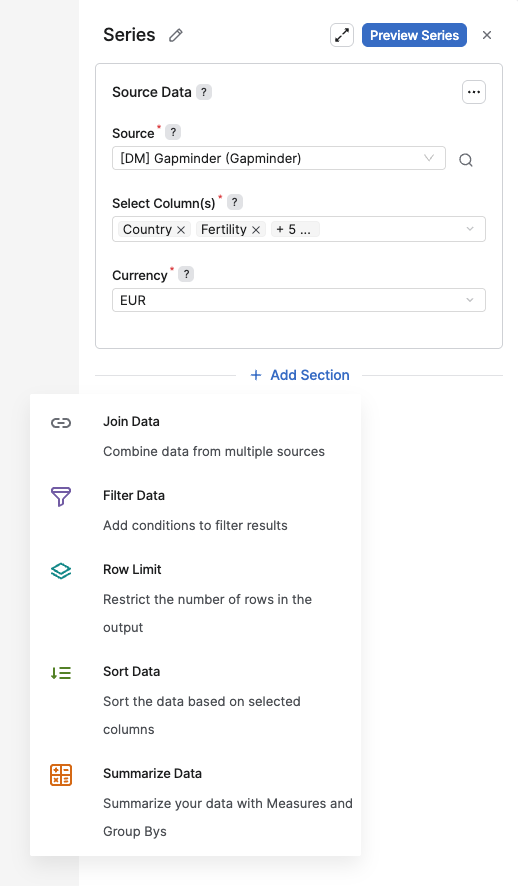
Add Section button in the Series panel
-
-
Node Actions – The ... menu on a node, with:
-
Duplicate – Duplicates a node.
-
Delete – Deletes a node.
-
Field Origin in Field Lists
When you select fields in a building block, for example in a Filter, Join or Sort, each field shows the block it comes from in square brackets: Field Label [Block]. If the block has a label, the label is shown. Otherwise the block ID is shown, for example S1 or J1. This helps you tell apart fields with the same name that come from different series or joins.
Give your building blocks descriptive labels so the field lists are easier to read.
Unsupported Stages
A Query Definition can contain stages that were created outside the visual editor (for example, through the QueryAPI directly) using a stage kind that the Query Definition editor does not know how to render, such as addColumns or selectColumns. Such a query is still valid and can be executed, but the editor opens it in read-only mode instead of blocking it as an error. When this happens, a warning banner appears at the top of the Query Definition editor:
This query contains an unsupported stage and is read-only. You cannot save changes or use Data Preview. Use Result Preview to run the complete query.
Each unsupported stage is displayed as its own collapsible section, labeled Unsupported Stage (kind: {stageKind}), where {stageKind} identifies the type of stage that could not be rendered (for example, addColumns or selectColumns). Expanding the section shows the underlying stage definition as read-only JSON, so you can inspect what the stage does even though you cannot edit it in the visual editor.
While a query is in this read-only mode, you cannot save changes to it or use Preview. Use Preview Output instead to run the complete query, including the unsupported stages, and verify the output.
Supported blocks that appear before or after an unsupported stage (for example Series or Summary) remain visible and behave normally. Only the unsupported stage itself is shown as a read-only, collapsed section.
Expression Editor in Measures
When you configure the Summary block, you can define custom Measures using the Expression Editor instead of relying only on the standard aggregation options. The Expression Editor lets you combine columns produced by earlier blocks (Source, Join Data, Filter Data) with aggregation functions such as SUM, MIN, MAX, and AVG, as well as safe-division helpers such as SAFEDIV(), to build a calculated Measure directly in the Query Definition.
Not every expression supported elsewhere in Analytics is available for aggregation filters. See the List of Not Supported Expressions).