Experimental Feature
Using the Self-Service Dashboards, users can create their own dashboards without requiring technical skills or coding knowledge. It allows for the creation of dashboards that are perfectly aligned with specific data needs, enabling self-sufficiency without the need for technical expertise. Users can effortlessly generate data queries and visualize results through various chart types. Additionally, the system offers improved organization through the use of folders, facilitating easier navigation across multiple dashboards.
Self-Service Dashboards is a functionality inteded for Pricing Analysts who uses Dashboards to analyze pricing trends. The Self-Service Dashboard is a transformation that provides the possibility to create and edit the Dashboard independently unlike the current Dashboards, when only the Configuration Engineer can create or edit the Dashboard our solution puts the power to create and edit Dashboards in the hands of the end user.
Use Cases
-
A Pricing Analyst can create their own dashboard and use it to analyze data without requiring assistance from a Configuration Engineer.
-
A Pricing Analyst can also adjust the dashboard independently, without needing support from a Configuration Engineer.
-
A Pricing Analyst can create a data Query and visualize it without requiring assistance from a Configuration Engineer.
-
A Viewer of the Dashboard can access and view the Dashboard and use general filter.
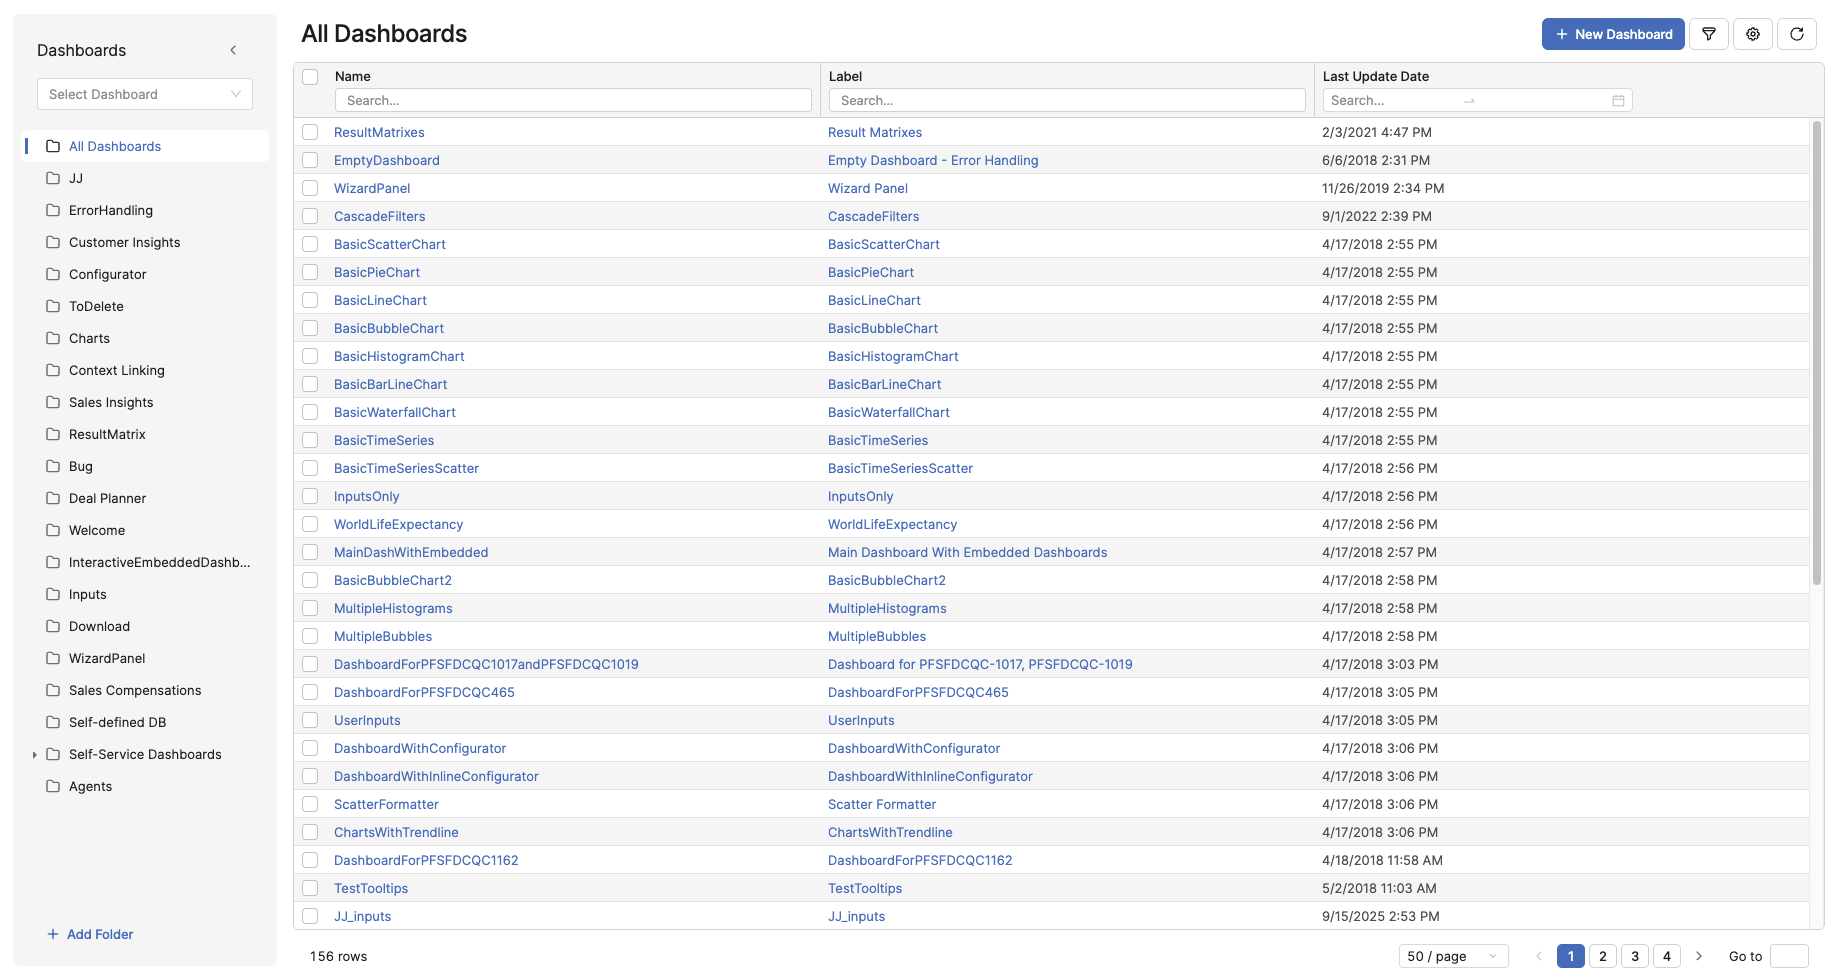
Columns
Name – Indicates the name of the Dashboard. Mandatory, unique identifier used in configuration and dependencies.
Label – Short, user-facing title, shown in the application and used as the source for translations across locales.
Last Update Date – Reports the date of the most recent modification to the Dashboard.
ID – The unique identifier of the Dashboard. This column is hidden by default but can be displayed using the Table Column Options and saved as Preference.
Meta Description – Describes the Dashboard, as provided by the user during creation. Optional metadata text (up to 1000 characters) used by the Pricefx Copilot to better understand the item’s meaning. (Hidden by default)
Created – Displays the date when the Dashboard was initially created. (Hidden by default)
Created By – Shows the user who created the Dashboard. (Hidden by default)
Last Updated By – Displays the user who made the last change to the Dashboard. (Hidden by default)
Folders
You can organize your Queries into folders. By default, only the All portlets folder is available. To create a custom folder, click on Add Folder. For more information see Manage Folders.
New Dashboard
To create a New Dashboard, click on the New Dashboard button. For more information see How to Create a Self-Service Dashboard.