-
Go to Analytics > Dashboard Manager > Portlets.
-
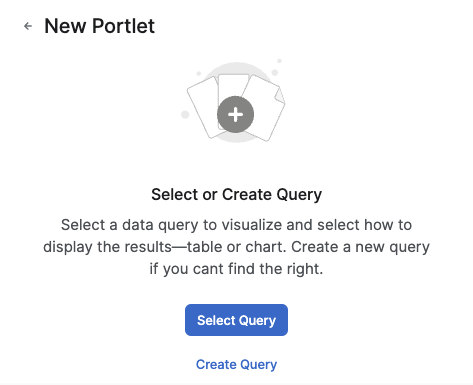
Click New Portlet.
-
In the New Portlet screen:
-
Select one of the following options:
-
Select Query
-
Create Query (For more information see How to Create a Query.)
-
-
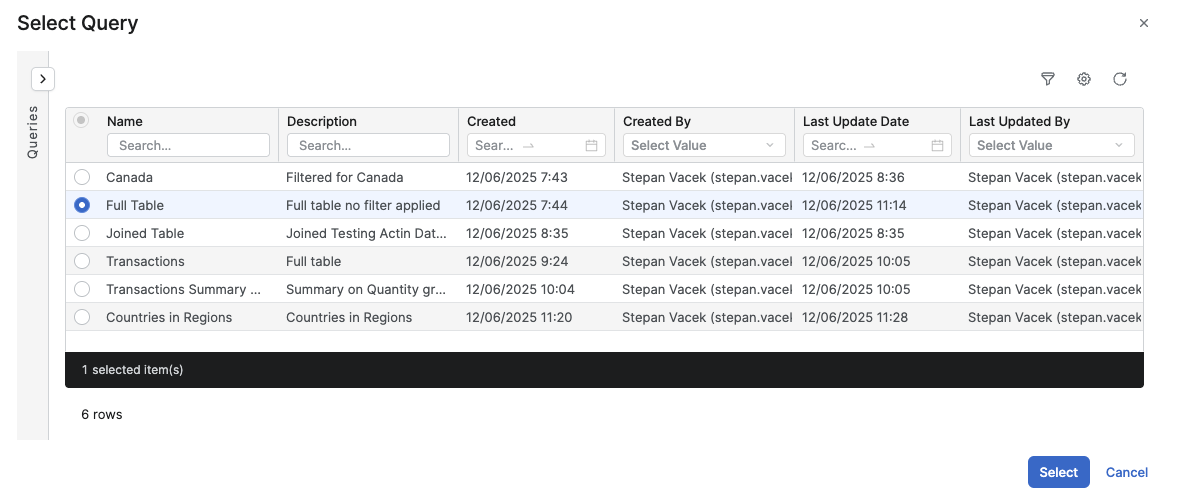
In the Select Query screen:
-
Select the query from the query list.
-
Click Select.
-
-
In the New Portlet screen:
-
Select the Chart Type:
- Data Table (For more information see Data Table (Chart Type).)
- Bar & Line (For more information see Bar & Line (Chart Type).)
- Scatter (For more information see Scatter (Chart Type).)
- Pie (For more information see Pie Chart (Chart Type).)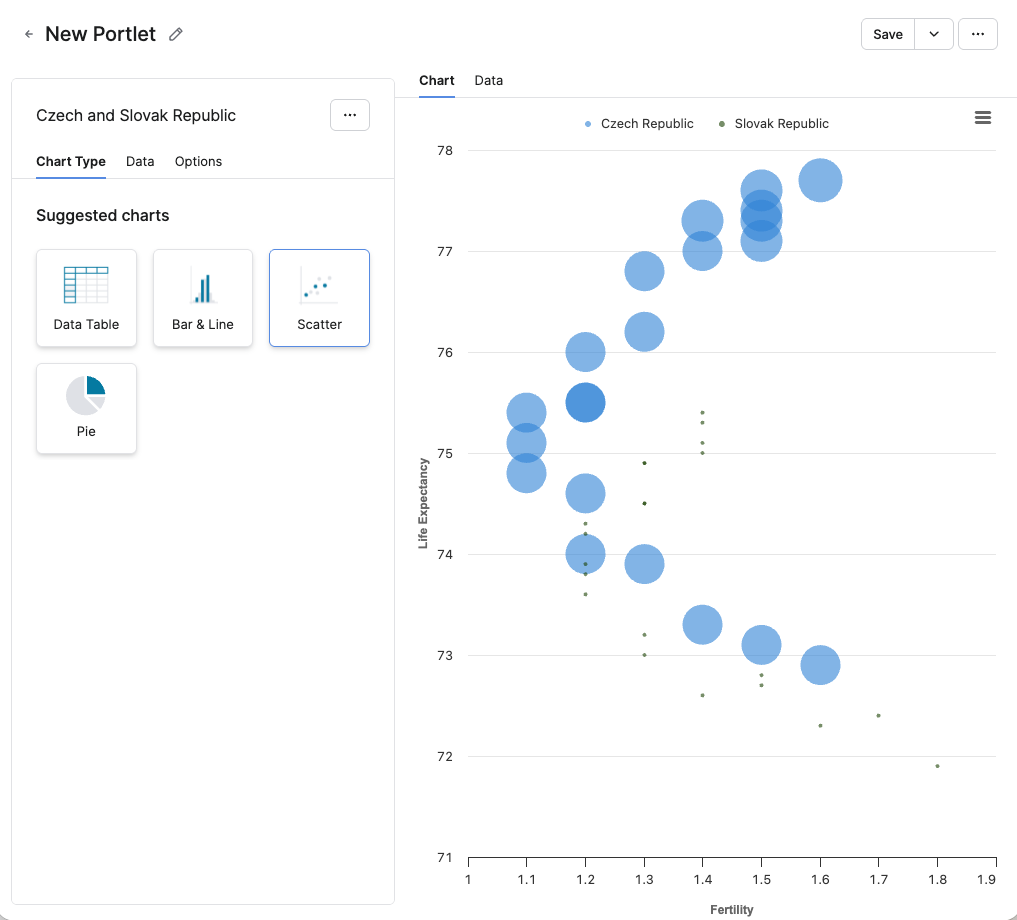
-
-
Click Save.
-
In the Save Portlet as menu:
-
Enter a Label.
Info Title used for display and translations.
-
Enter a Name.
-
In the Save to Folder section, select the folder where the portlet will be saved.
-
-
Click Save.
-