
Partition Overview has the following sub-sections:
Log History
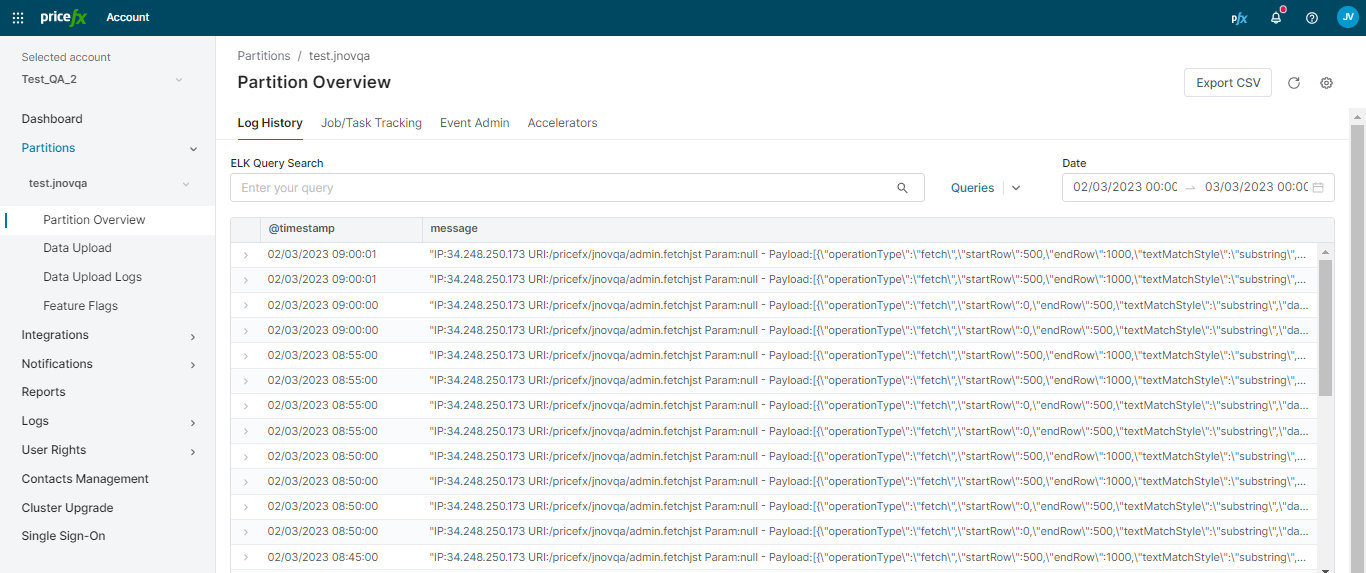
Shows the log history for the given partition.
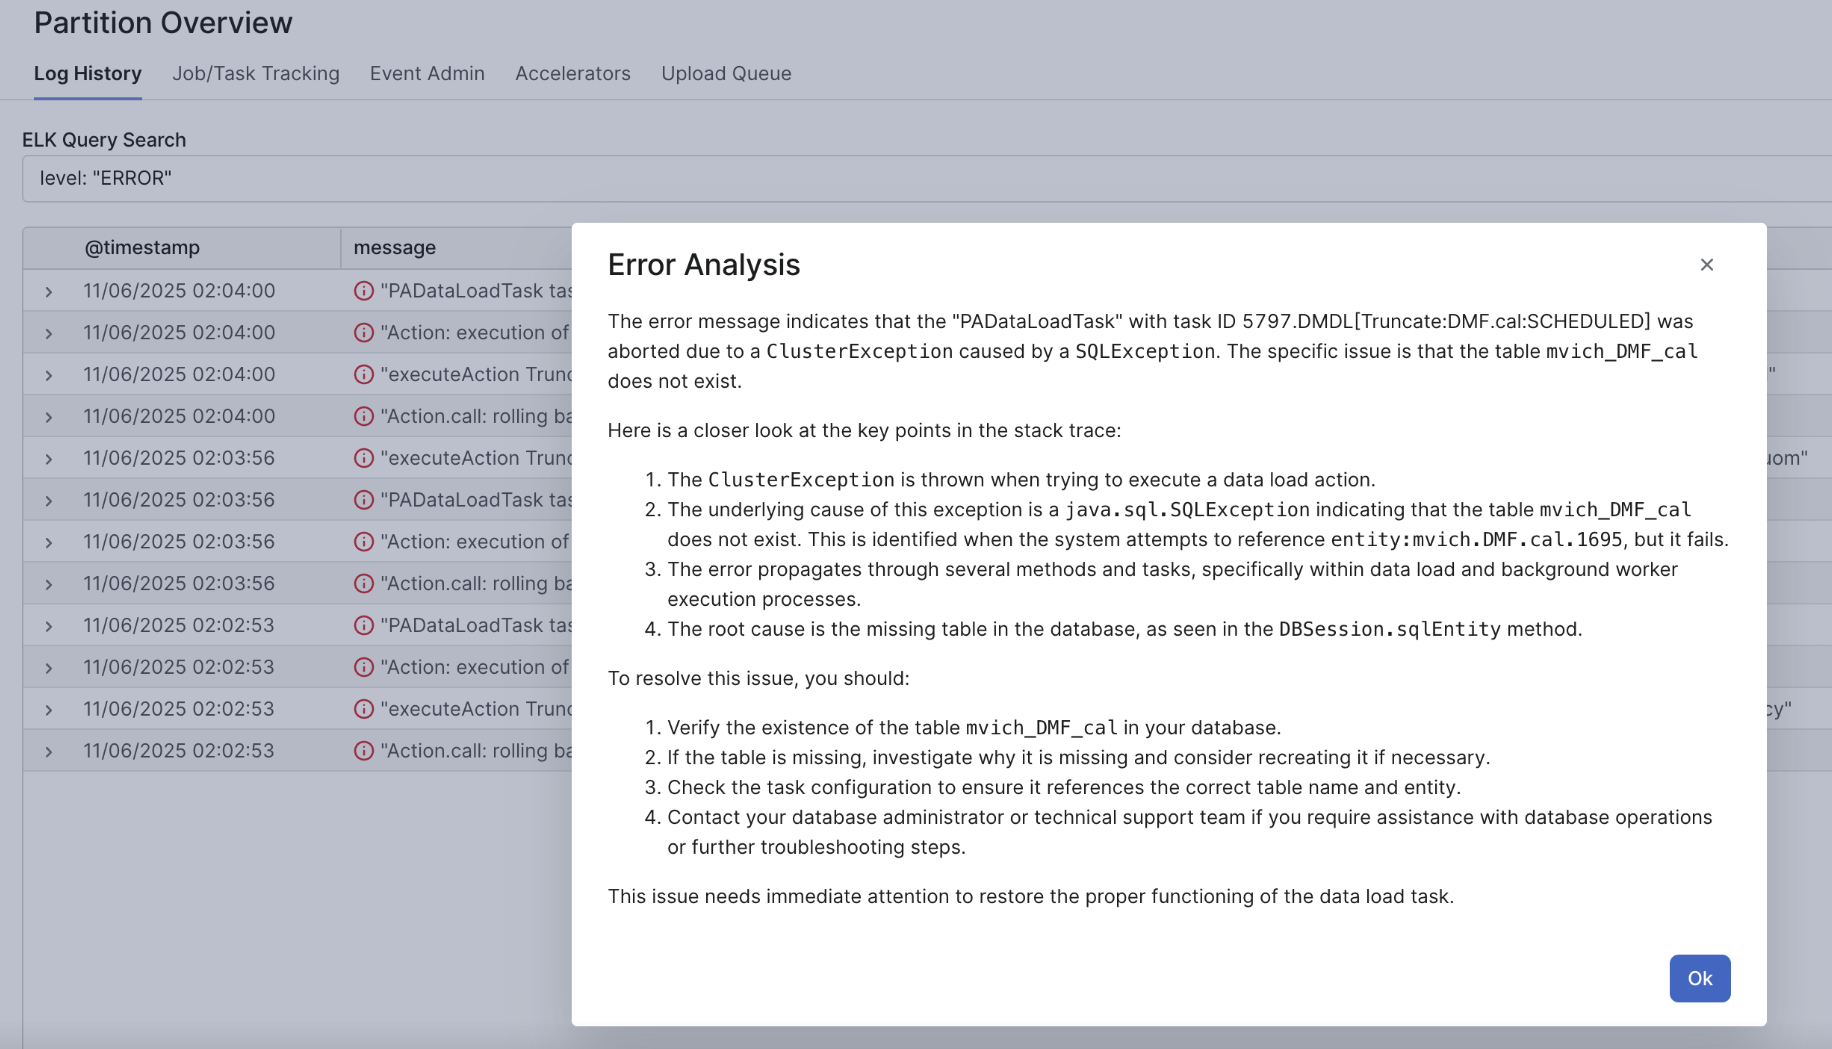
In case you have the support permission granted, you can get the the log analysis as an AI response:
Job/Task Tracking
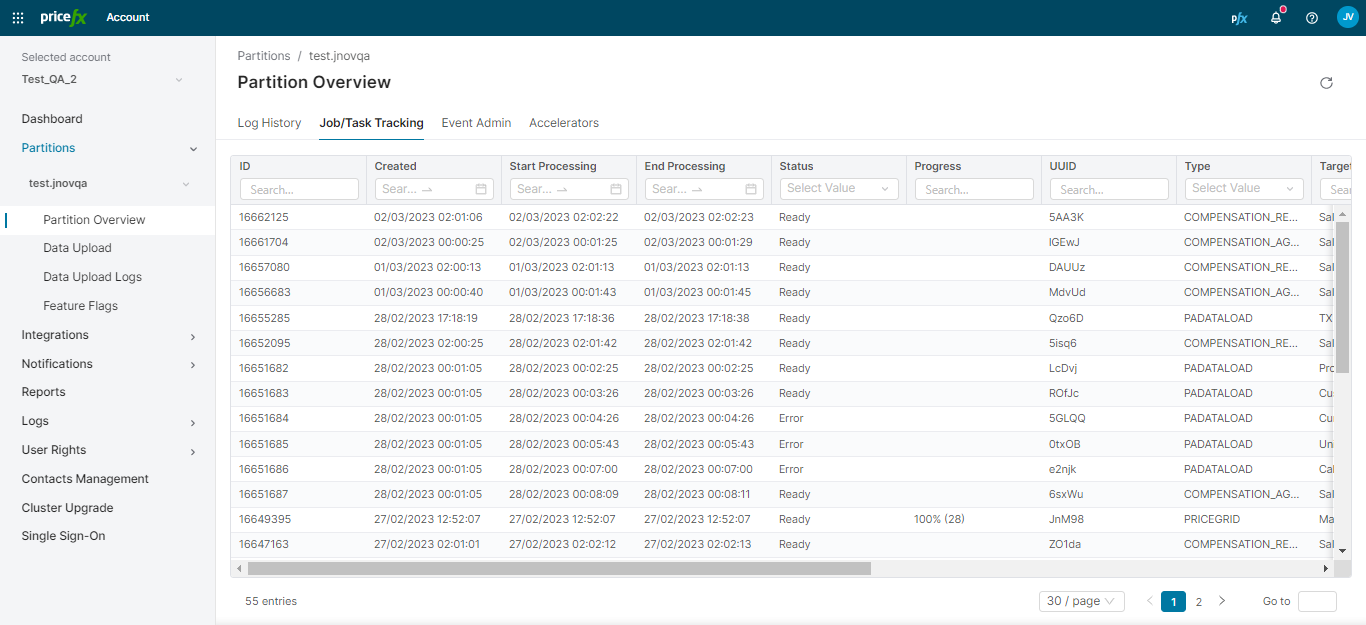
Shows all details on jobs/tasks executed at the Pricefx partition (e.g. calculation of Price Lists or LPGs).
In this section you can also define a notification on a specific job/task; for details see Account Notifications.
To see this section, you need to have the Partition Events/Jobs - read permission.
Event Admin
Shows all events generated by Pricefx (e.g. CALCULATION_COMPLETED_CFS).
To see this section, you need to have the Partition Events/Jobs - read permission.
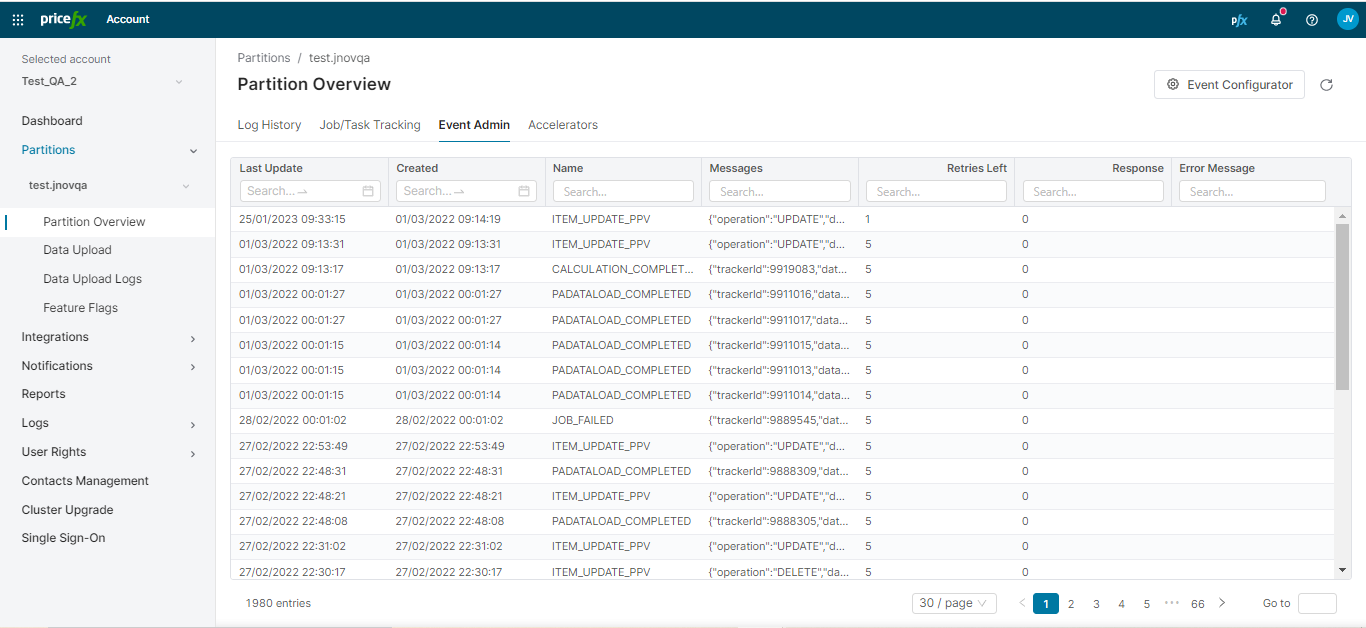
It is also possible to re-run an event from here – if Retries Left = 0 and you have the Partition Events/Jobs - edit permission.

Event Configurator
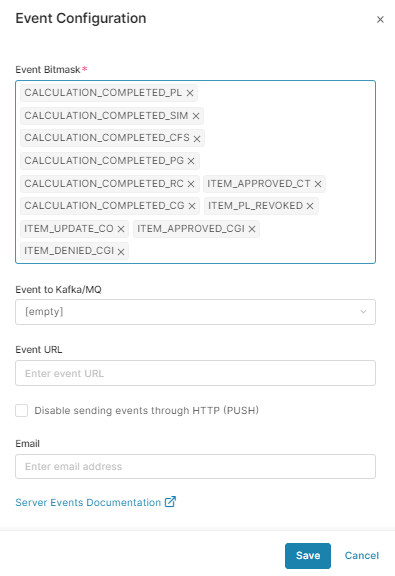
You can also configure the events here (without having to access the partition). If you have the Partition Admin - Events permission, you will see the Event Configurator button at top.
|
|
Options:
For more details on these configuration options, see Server Events in Pricefx Unity documentation. |
See also Workflows and How to Create Event Workflow.
Accelerators
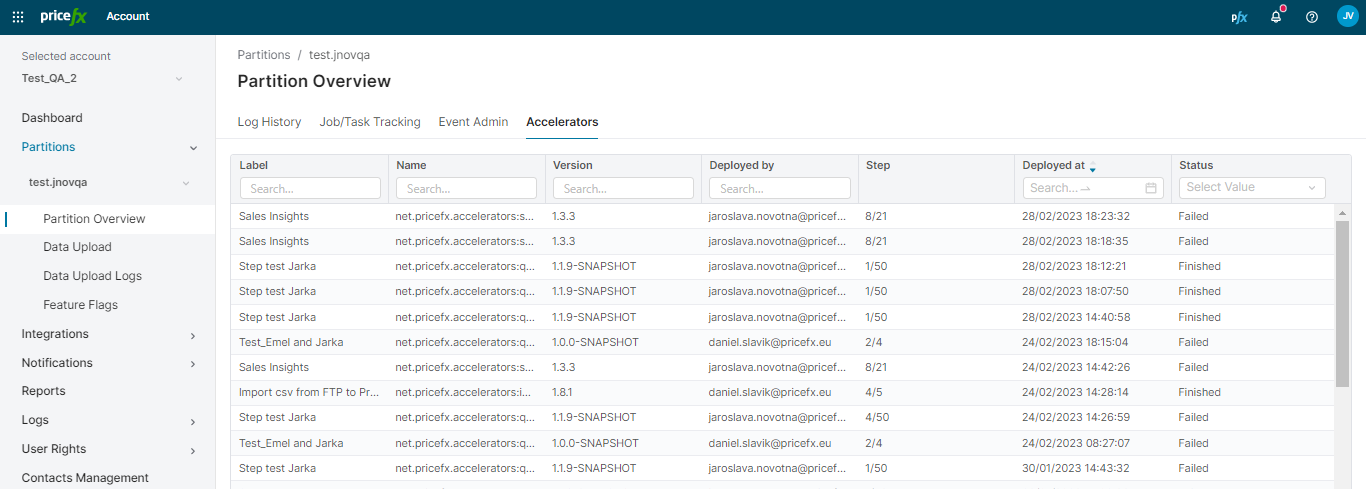
In this section you can see which Accelerators were deployed to a specific partition. For each record there are the following details: name of the Accelerator, its version, when it was deployed and by whom, and its status (finished, in progress, failed).
Assets with no deployments are not included.
For Accelerators in Failed and In Progress states it is possible to rollback the deployment and delete objects which were already deployed. Make sure these objects are not used by other configurations on the partition, otherwise they would stop working.
Automatic Deployment of Plasma Accelerators
Since the version 1.50 there is an automation job PlasmaPackageAutoDeploymentJob which deploys Plasma Accelerators to partitions based on a condition.
Prerequisites:
-
Instances have the Hurricane 9.0 version and newer.
-
Partitions are marked as 'Production' type in Salesfx.
-
Their associated Accounts have the Plasma flag set to opted-in in Salesfx.
How it works:
-
The job checks if it can communicate with a partition. If the technical user is not created, it will create it.
-
The job deploys the latest version of the two Plasma Accelerators (net.pricefx.accelerators:plasma-quote-processor, net.pricefx.accelerators:plasma-transaction-processor) at the partition.
-
The job removes the technical user if this account was not present there previously.
Data Transfers Queue
To access this tab, you must have the appropriate permissions – see Partition Overview.
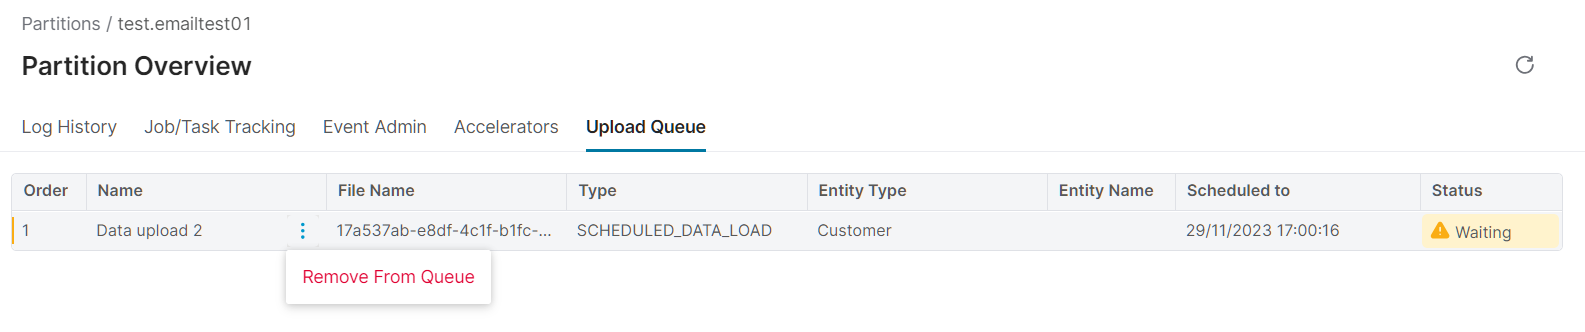
The Data Transfers Queue displays all data transfers that are currently running or waiting to be processed for the partition. It covers both uploads and downloads: uploads triggered from the PlatformManager UI, Accelerator data uploads, other deployments initiated by Accelerators (logics, etc.), scheduled and classic data downloads, and transfers that were postponed to a later time. The Type column names the kind of transfer, and the Scheduled to column shows the time a postponed transfer is due.
Monitoring this queue helps prevent issues caused by multiple large uploads running at the same time.
Required Permissions
Partition Events/Jobs - edit
Partition Activity Log - read
Available Actions
Each row has its own action in the three-dot menu, depending on the status of the transfer:
-
Force Stop Uploading: Immediately stops any data uploads that are currently in progress. After stopping, the upload status is changed to Canceled.
-
Remove From Queue: Removes any data uploads that are in the Waiting status.
Stopping Several Transfers at Once
To stop more than one data transfer in a single action:
-
Select the transfers using the checkboxes in the first column. Only transfers in the In Progress and Waiting statuses can be selected; the checkbox is disabled for every other status. Use the checkbox in the header row to select all eligible transfers.
-
A selection bar appears below the table showing how many items are selected. Click Stop Data Transfers in that bar. To start over instead, click Clear selection.
-
In the Stop Data Transfers dialog, confirm the action. The dialog states how many transfers you are about to stop and warns that transfers in progress will be force stopped. Click Stop to proceed, or Cancel to keep them running.
PlatformManager stops all selected transfers in one request and confirms with a message naming how many were stopped. The queue then refreshes and the selection is cleared. Transfers that left the queue on their own while the dialog was open are dropped from the selection instead of being reported as failures.
Stopped transfers are not removed from the partition history: they appear with the status Canceled in the upload or download history for the entity.
Code Analysis
The Code Analysis allows you to scan the Groovy configuration code from the partition and validate it against defined guidelines, best practices, and rulesets. This helps improve the quality of delivered solutions and ensures adherence to coding standards.
Prerequisites
-
To see this section, the
configuration-checkerPM feature flag must be enabled on the partition and you need any partition permission. -
Starting a new analysis requires the
Partition - Editpermission. -
Managing the underlying rulesets requires the
Power Userpermission.
Features
-
On-demand Analysis: Run a scan of the Groovy code from the partition using the integrated Codenarc tool.
-
Metrics Dashboard: View basic quality metrics directly in PlatformManager after the scan completes.
-
Full Reports: Download a detailed analysis report for offline review.
-
Rule set Management: Users with
Power Userpermissions can create, update, or delete the rule sets used for validation. For more details see Rule Sets
To run a check on demand, click the Start Code Analysis button. The system downloads the configuration code and runs the analysis against it. The results table displays basic metrics for each run, including Status, Score, Critical, Major, Minor, Message, Started by, Started at, and Finished at.
Once the analysis finishes, you can download the full report to review the detailed findings.

AI Agent Generator
The AI Agent Generator enables you to automate the creation of Agents without having to build them manually. Using a step-by-step wizard, you can generate AI Agents that can be deployed to your partition in order to continuously analyze company data, track key pricing metrics, and identify potential risks or opportunities based on defined business objectives.
This tool simplifies the configuration and deployment of Agents tailored to your business needs.
To learn how to set up your own AI Agent, see How To Generate AI Agents