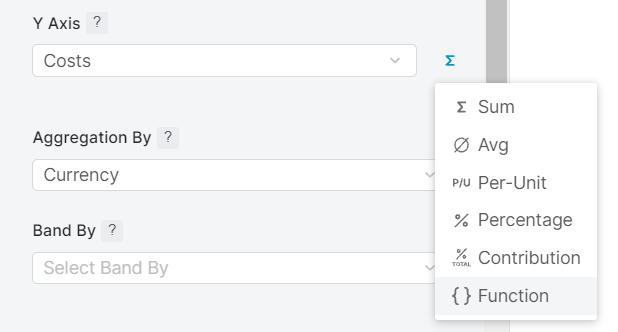
For each axis in the chart, you can specify how the value of the variable will be calculated.
The value can be defined in the following ways:
-
For numeric variables (Money, Number, Quantity data types): sum, per unit, percent, contribution, formula;
For Bar&Line, Time Series and Detailed Time Series charts there are also index, per unit index, cumulative sum and cumulative contribution. -
For string variables (Text data type): count, count distinct.
In the following example, we have three possible values of the Customer Type variable (Restaurant, Industry, Consumer) and there are nine records in the Invoice Price field, three for each of the Customer Type variable values:
|
Customer Type |
Restaurant |
Industry |
Consumer |
|---|---|---|---|
|
|
150 |
250 |
20 |
|
50 |
150 |
50 |
|
|
100 |
200 |
30 |
Using this sample data, we will demonstrate what the available calculation options actually calculate.
Sum
Sum ( ![]()
The sum function returns a simple total of all records of the field:
|
|
Restaurant |
Industry |
Consumer |
|---|---|---|---|
|
Σ Invoice Price |
300 |
600 |
100 |
Per Unit
Per unit ( ![]()
The per unit function takes the sum of the invoice price for each customer type and divides it by the amount of units purchased. The result is the price per unit:
|
|
Restaurant |
Industry |
Consumer |
|---|---|---|---|
|
Σ Invoice Price |
300 |
600 |
100 |
|
Quantity |
20 |
50 |
10 |
|
Per Unit |
15 |
12 |
10 |
Percent
Percent (%) calculates the percentage value of the selected data field in relation to the Percent Basis field. The Percent Basis field is set in the Datamart (Analytics > Datamarts; set the Function to Percent Basis).
The percent function takes the sum of the invoice price and returns its ratio to the sum of the list price (which is the percent basis field) as a percentage:
|
|
Restaurant |
Industry |
Consumer |
|---|---|---|---|
|
Σ Invoice Price |
300 |
600 |
100 |
|
Σ List Price |
360 |
700 |
110 |
|
Percent |
83.3% |
85.7% |
90.9% |
Contribution
Contribution ( ![]()
This option is not supported by Rollups.
The contribution function takes the sum of the invoice price for each customer type and calculates its proportionate part of the Invoice Price total:
|
|
Restaurant |
Industry |
Consumer |
|---|---|---|---|
|
Σ Invoice Price |
300 + 600 + 100 = 1000 |
||
|
Contribution |
0.3 |
0.6 |
0.1 |
Index
Index ( ![]()
This option is not supported by Rollups.
|
Record # |
Net Margin |
Index |
|---|---|---|
|
1 |
6.29 |
1 |
|
2 |
8.60 |
1.37 |
|
3 |
9.00 |
1.43 |
|
4 |
5.88 |
0.93 |
Per Unit Index
Per unit index ( ![]()
This option is not supported by Rollups.
Cumulative Sum
Cumulative sum ( ![]()
This option is not supported by Rollups.
|
Record # |
Invoice Price |
Cumulative Σ |
|---|---|---|
|
1 |
250 |
250 |
|
2 |
150 |
400 |
|
3 |
200 |
600 |
Cumulative Contribution
Cumulative contribution ( ![]()
This option is not supported by Rollups.
|
|
Restaurant |
Industry |
Consumer |
|---|---|---|---|
|
Σ Invoice Price |
300 + 600 + 100 = 1000 |
||
|
Contribution |
0.3 |
0.6 |
0.1 |
|
Cumulative Contribution |
0.3 |
0.9 |
1 |
Count
Count (#) returns the number of records (table rows) of the selected data field.
Count Distinct
Count Distinct ( ![]()
|
|
Customer Type |
|---|---|
|
TapasBar |
Restaurant |
|
Meat&Co. |
Industry |
|
John Smith |
Consumer |
|
Ealing Deli |
Restaurant |
|
Canned Food Ltd |
Industry |
|
Count |
5 |
|
Count Distinct |
3 |
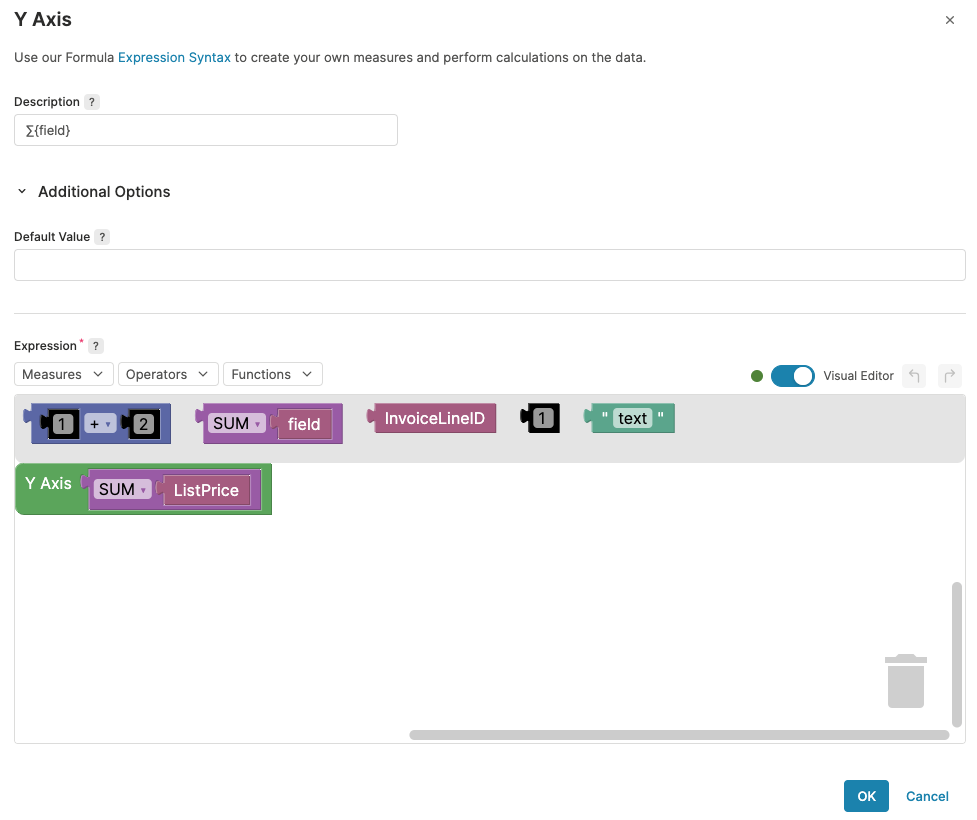
Function
For each of the options for numeric variables, you can define a mathematic formula for calculating the values. Select 'Function' ( ![]()
-
Description – Label for the newly created Measure.
-
Default Value – The default value returned when there is no value available in your data.
-
Expression – A formula used for expressing the aggregation. You can use the Visual Editor or the standard script editor. In the Measures drop-down list, you will find Datamart fields which can be used in the expression. For each Datamart field there is a sub-menu with all the aggregations available for that field. For a list of available Functions, see below.
-
Run – Click the button to trigger a test run of your formula. You can check a sample row of the results in the Result Preview table below.
All charts in Pricefx are designed to display aggregations, i.e. rollups on the database level. This means that any formula must include an aggregation function to work correctly.
Example
The following formula computes the gross profit given that you have the variables 'Cost' and 'Revenue' in your Datamart and you have previously selected 'Revenue' as the measure:
Sum({field} - Cost)
If you want to use some of the available functions, there must always be an aggregation in the formula:
if(sum({field})>10,10,0)
or
sum(if({field}<5,0,10))
Functions available in the Formula Builder:
-
Min – Returns the minimum value of the expression result.
-
Max – Returns the maximum value of the expression result.
-
Avg – Returns the average value of the expression result.
-
Sum – Returns the sum of the expression result.
-
Count – Returns the count of the expression result.
-
Count distinct values – Returns the distinct count of the expression result.
-
Discrete percentile – Returns the given percentile in the discrete distribution.
-
Continuous percentile – Returns the given percentile in the continuous distribution.
-
Correlation coefficient
-
Population covariance
-
Sample covariance
-
Population standard deviation
-
Sample standard deviation
-
Population variance – Returns the population variance of the input values (calculated as square of the population standard deviation).
-
Sample variance – Returns the sample variance of the input values (calculated as square of the sample standard deviation).
-
Average of the independent variable: (Σ(X)/N)
-
Average of the dependent variable: (Σ(Y)/N)
-
Number of input rows in which both X and Y are non-null
-
Y-intercept of the (X, Y) linear regression
-
R2: square of the (X, Y) linear regression correlation coefficient
-
Coefficient (slope) of the (Y, X) linear regression
-
Sum of squares of the independent variable: Σ(X - (X/N))2
-
Sum of products of independent times dependent variable: Σ(X*Y) - Σ(X) * Σ(Y)/N
-
Sum of squares of the dependent variable: Σ(Y - (Y/N))2
-
Is null? – Checks whether the expression is null.
-
If – Evaluates a Boolean expression and defines values that will be returned for both true and false result.
-
If null value – Checks whether the expression is null and provides a replacement value.
-
Convert to string – Converts the result of the expression to string.