If you want to include your chart in a dashboard, you can do so by clicking the Add to Dashboard button.
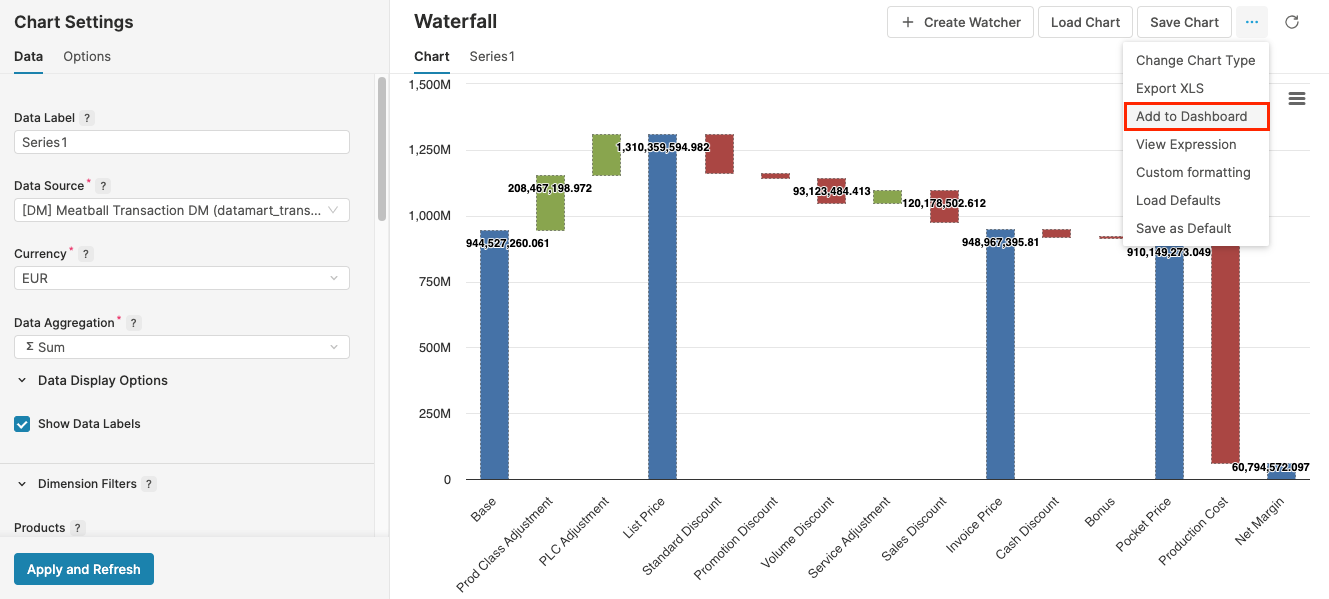
After you click the button, a dialog opens. Select the Dashboard, to which the chart should be added and enter a label for the chart. Optionally, you can make further settings:
-
Show Generic Filter – Generic and Aggregation filters defined in the chart will be shown and available for editing in the dashboard.
-
Show Dim Filters – Dim filters defined in the chart will be shown in the dashboard. Users will only be able to change the filter value.
-
Allow adding and removing Dim Filters – Dim filters defined in the chart will be shown in the dashboard and users will be able to add and remove them.
-
Replace if exists – If a portlet with the entered label exists, it will be replaced by this one.
-
In the Expression Editor, you can adjust the chart definition, if required.