
This page outlines the configuration details essential for effectively utilizing the Revenue and Profit Dashboard, covering fields such as Revenue, Profit, and Margin percentages.
Fields Definition
Summary Table
Applied period filter: Review Period
|
Field |
Formula |
|---|---|
|
Revenue |
SUM(revenue) |
|
Profit |
SUM(profit) |
|
Margin % |
SUM(profit)/SUM(revenue) |
|
Yearly Revenue Trend |
12 * â / ȳ
For more information see Trend (Insights Dashboards). |
|
Yearly Profit Trend |
12 * â / ȳ For more information see Trend (Insights Dashboards). |
Revenue and Margin % Over Time
Applied period filter: Review Period
|
Field |
Formula |
|---|---|
|
Revenue |
SUM(revenue) |
|
Profit |
SUM(profit) |
|
Margin % |
SUM(profit)/SUM(revenue) |
Revenue and Margin % by Product Category
Applied period filter: Review Period
|
Field |
Formula |
|---|---|
|
Revenue |
SUM(revenue) |
|
Profit |
SUM(profit) |
|
Margin % |
SUM(profit)/SUM(revenue) |
Revenue and Margin % by Customer Category
Applied period filter: Review Period
|
Field |
Formula |
|---|---|
|
Revenue |
SUM(revenue) |
|
Profit |
SUM(profit) |
|
Margin % |
SUM(profit)/SUM(revenue) |
Product Contribution and Margin %
Applied period filter: Review Period
|
Field |
Formula |
|---|---|
|
Total Revenue |
SUM(revenue for particular Product Rank) |
|
Total Profit |
SUM(profit for particular Product Rank) |
|
Margin % |
SUM(profit)/SUM(revenue) |
Customer Contribution and Margin %
Applied period filter: Review Period
|
Field |
Formula |
|---|---|
|
Total Revenue |
SUM(revenue for particular Customer Rank) |
|
Total Profit |
SUM(profit for particular Customer Rank) |
|
Margin % |
SUM(profit)/SUM(revenue) |
Price Waterfall
Applied period filter: Review Period
Price Waterfall Components
Note that the following components are provided solely as illustrative examples and are not included in the accelerator solution by default.
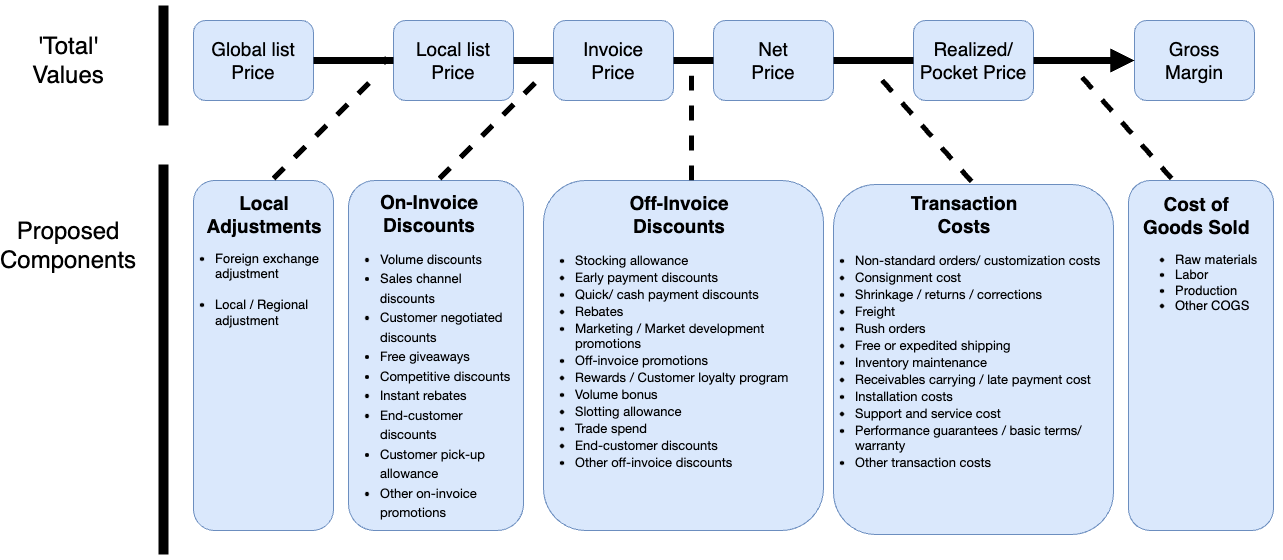
|
Total Value |
Component |
Description |
|---|---|---|
|
Local adjustments
|
Foreign exchange adjustment |
Adjustments due to exchange/currency issues |
|
Local/Regional adjustments |
Adjustments for local costs (e.g. tariffs), regional customer preferences and market competitiveness |
|
|
Volume discounts
|
Volume discounts |
Discounts for bulk purchases |
|
Sales channel discounts |
Discounts for a specific sales channel |
|
|
Seasonal discounts |
Discounts for seasonal sales objectives (e.g. reduce inventory) |
|
|
Customer negotiated discounts |
Customized discounts negotiated with the customer |
|
|
Free giveaways |
Free services or products given to customer with a purchase and shown on the invoice |
|
|
Competitive discounts |
Discretionary discounts negotiated before the order is taken based on competitors' prices |
|
|
Instant rebates |
Rebates given before the invoice price |
|
|
End-customer discounts |
Discounts for end-customer rather than retailer or distributor (typically large end-customers) |
|
|
Customer pick-up allowance |
Allowance paid for customers who pick up the goods by themselves |
|
|
Other on-invoice promotions |
Others |
|
|
Stocking allowance
|
Stocking allowance |
Discounts paid to wholesalers/retailers to make large purchases into inventory (often before seasonal demand increase) |
|
Early payment discounts |
Negotiated discounts or deduction from the invoice if the payment is made early |
|
|
Quick/cash payment discounts |
Deduction from the invoice price if payment is made quickly |
|
|
Rebates |
Refunds given for purchasing at certain times, early orders or for selling a product to a specific customer |
|
|
Marketing/Market development promotions |
Allowance paid to support advertising of manufacturer's brand or to promote sales in a specific market segment or during a promotional time period |
|
|
Rewards/Customer loyalty program |
Redeem points for gifts or receive one-time promotions for those in loyalty programs; long-term agreements |
|
|
Volume bonus |
End-of-year bonus paid to customers if the preset purchase volume targets are met |
|
|
Slotting allowance |
Allowance paid to retailer to secure the set amount of shelf space and product positioning |
|
|
Trade spend |
Allowance for retailer to discounts from MSRP (manufacturer's suggested retail price) |
|
|
End-customer discounts |
Discounts for end-customer rather than retailer or distributor, types of pass-through |
|
|
Other off invoice discounts |
Others |
|
|
Non-standard orders / customization costs
|
Non-standard orders / customization costs |
Costs associated with manufacturing and delivering a non-standard or customized order |
|
Consignment cost |
Cost of funds when the supplier provides consigned inventory to a retailer or wholesaler |
|
|
Shrinkage / returns / corrections |
Cost of defective or damaged products |
|
|
Freight |
Cost of transporting goods to customer |
|
|
Rush orders |
Higher costs associated with filing and transporting orders more quickly |
|
|
Free or expedited shipping |
Higher costs of transporting goods to a specific customer |
|
|
Inventory maintenance |
Cost to hold goods in inventory |
|
|
Receivables carrying / late payment cost |
Cost of funds from the moment the invoice is sent until the payment is received; cost of delayed payments |
|
|
Installation costs |
Cost of installing products, including transportation and labor costs |
|
|
Support and service cost |
Cost of maintenance, general customer services, dedicated services, additional support, etc. |
|
|
Performance guarantees / basic terms/ warranty |
Discounts that seller agrees to give buyers if the seller misses performance targets (e.g. quality levels, delivery times, price protects) |
|
|
Other transaction costs |
Others |
|
|
Raw materials
|
Raw materials |
Cost of materials used to manufacture the product |
|
Labor |
Wages for employees directly involved in manufacturing the product |
|
|
Production |
Cost to manufacture the product |
|
|
Other COGS |
Others |
Chart Definition
Summary Table
Not Applicable
Revenue and Margin % Over Time
|
Property |
Value |
|---|---|
|
Axes |
|
|
Data Series |
|
|
Colors |
|
|
Columns |
|
Revenue and Margin % by Product Category
|
Property |
Value |
|---|---|
|
Axes |
|
|
Data Series |
|
|
Colors |
The Mauvelous Long palette is utilized, and it is repeated when the number of categories exceeds the number of colors available in the palette. |
|
Color Behavior |
If Product Category and Color Product By are set to the same hierarchy level and value, all data points in the chart are rendered in a single color. To distinguish categories visually, use a different hierarchy level or attribute in Color Product By than in Product Category. |
|
Columns |
|
Revenue and Margin % by Customer Category
|
Property |
Value |
|---|---|
|
Axes |
|
|
Data Series |
|
|
Colors |
The Gold Crayola Long palette is utilized, and it is repeated when the number of categories exceeds the number of colors available in the palette. |
|
Color Behavior |
If Customer Category and Color Customer By are set to the same hierarchy level and value, all data points in the chart are rendered in a single color. To distinguish categories visually, use a different hierarchy level or attribute in Color Customer By than in Customer Category. |
|
Columns |
|
Product Contribution and Margin %
|
Property |
Value |
|---|---|
|
Axes |
|
|
Data Series |
|
|
Colors |
|
|
Columns |
|
Customer Contribution and Margin %
|
Property |
Value |
|---|---|
|
Axes |
|
|
Data Series |
|
|
Colors |
|
|
Columns |
|
Price Waterfall
|
Property |
Value |
|---|---|
|
Axes |
|
|
Data Series |
|
|
Colors |
|
|
Columns |
|
Data Tables
Aggregated Transactions
Default Filters
Data Filter
|
Input |
Type |
Required |
Default Value |
Relation to Other Input? |
|---|---|---|---|---|
|
Customer(s) |
Multi Selection |
No |
Empty Value |
No |
|
Product(s) |
Multi Selection |
No |
Empty Value |
No |
|
Review Period |
Range Selection |
Yes |
Last 12 Full Months |
Yes (Time Period) |
|
General Filter |
Many Multi Selection |
No |
Empty |
No |
More Options
|
Input |
Type |
Required |
Default Value |
Part of any container?
|
Relation to Other Input? |
|---|---|---|---|---|---|
|
Time Period |
Simple Selection |
Yes |
MONTH |
Yes, More Options |
No |
|
Customer Category |
Simple Selection |
Yes |
Second level of customer hierarchy |
Yes, More Options |
No |
|
Color Customer By |
Simple Selection |
No |
First level of customer hierarchy |
Yes, More Options |
No |
|
Product Category |
Simple Selection |
No |
Second level of product hierarchy |
Yes, More Options |
No |
|
Color Product By |
Simple Selection |
No |
First level of product hierarchy |
Yes, More Options |
No |
|
Revenue Axis Scale |
Simple Selection |
Yes |
Linear |
Yes, More Options |
No |