The Insights Dashboards accelerator supports Pricing Analytics teams seeking to analyze transactions and consists of a series of Dashboards dedicated to pricing. The solution is tailored to real-world use cases, providing Dashboards that range from high-level overviews to detailed analyses. Additionally, the Insights Dashboards enhance user experience by simplifying navigation, guiding users seamlessly from a broad overview to detailed insights.
From pricing insight to action in one connected experience
Insights Dashboards gives pricing teams an easy-to-navigate set of dashboards for customer analytics, revenue and margin analysis, performance diagnostics, and trend monitoring. Designed to move users from high-level overview to detailed investigation and actionable follow-through.
-
4 Linked Dashboards
-
Pricing-focused Experience
-
360° Customer, Product, Margin, Trend View
-
AI Copilot-ready and Agents-enabled
Built for Pricing Teams
Tailored dashboards, practical KPIs, and context-preserving drill downs across customer, product, segment, and time.
Why Insights Dashboards
The accelerator is designed for Pricing Analysts and Pricing Managers who need a reliable, business-friendly way to detect trends, find underperforming customers or products, understand root causes, and prevent margin leakage.
What Problem Does It Solve?
-
Provides a reliable, business‑friendly view of performance.
-
Detecting trends and market shifts to adjust pricing and commercial strategy.
-
Identifying underperforming customers or products and understanding the root causes.
-
Preventing margin leakages.
What Does It Do?
-
Delivers four linked dashboards covering customer analytics, margin and revenue analysis, performance diagnostics and trend monitoring.
-
Provides a clear set of pricing and performance charts (multi‑gauge KPI views, time-series, hierarchy drill downs, waterfalls, bubble charts, tables) focused on revenue, profit, margin %, health score, price realization, pricing opportunity, cross-sell and other key KPIs.
-
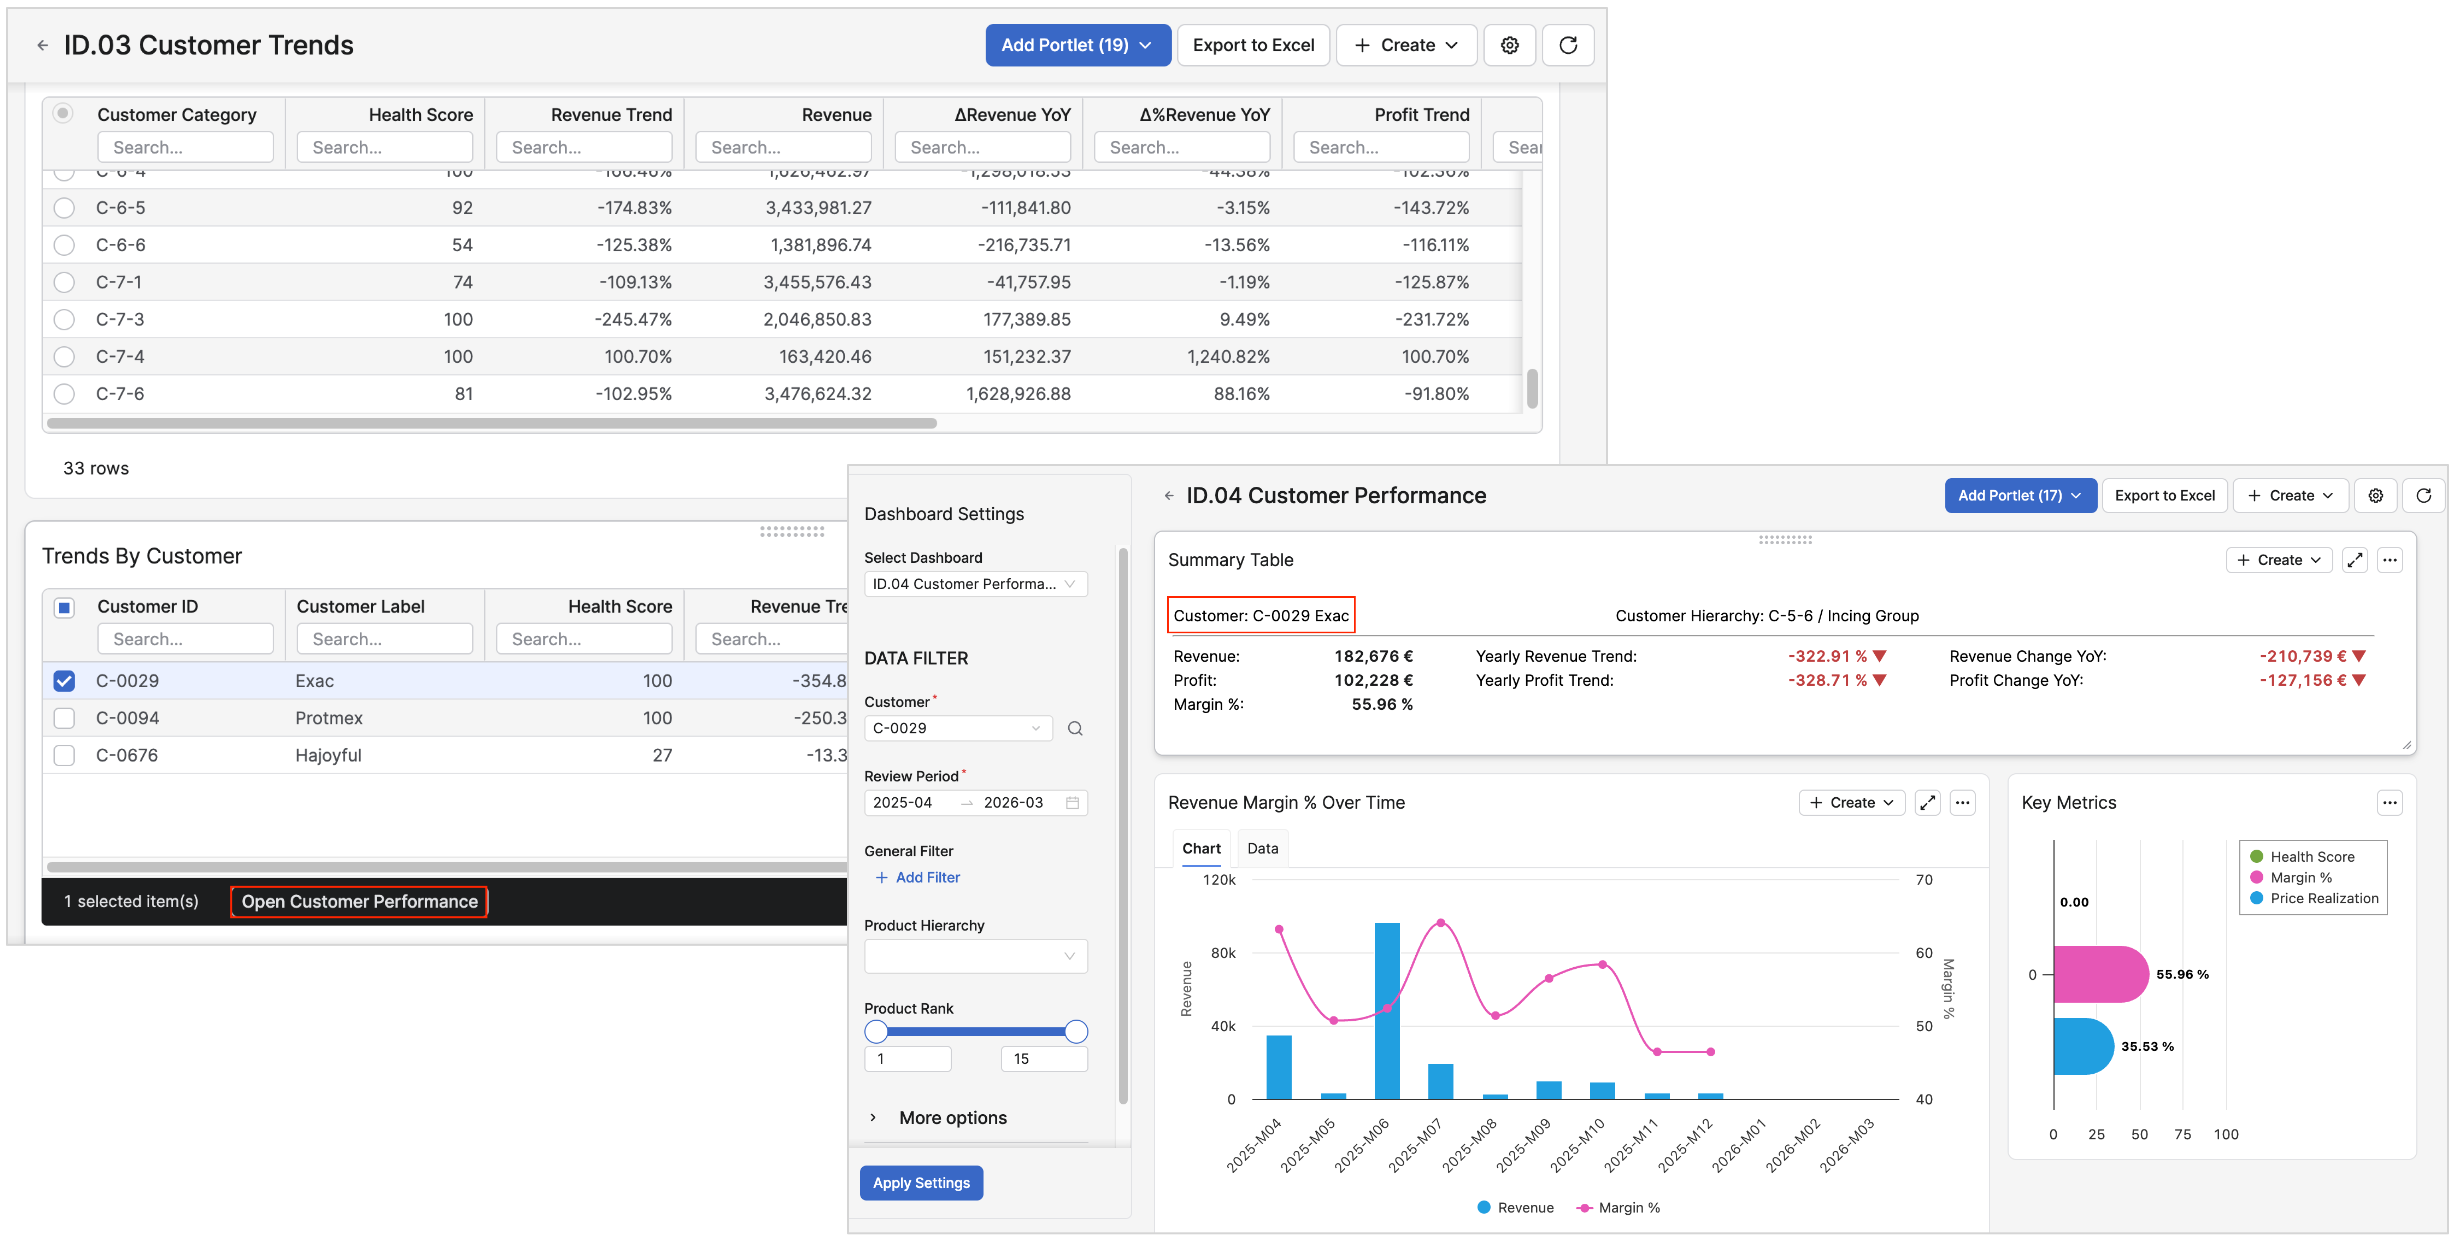
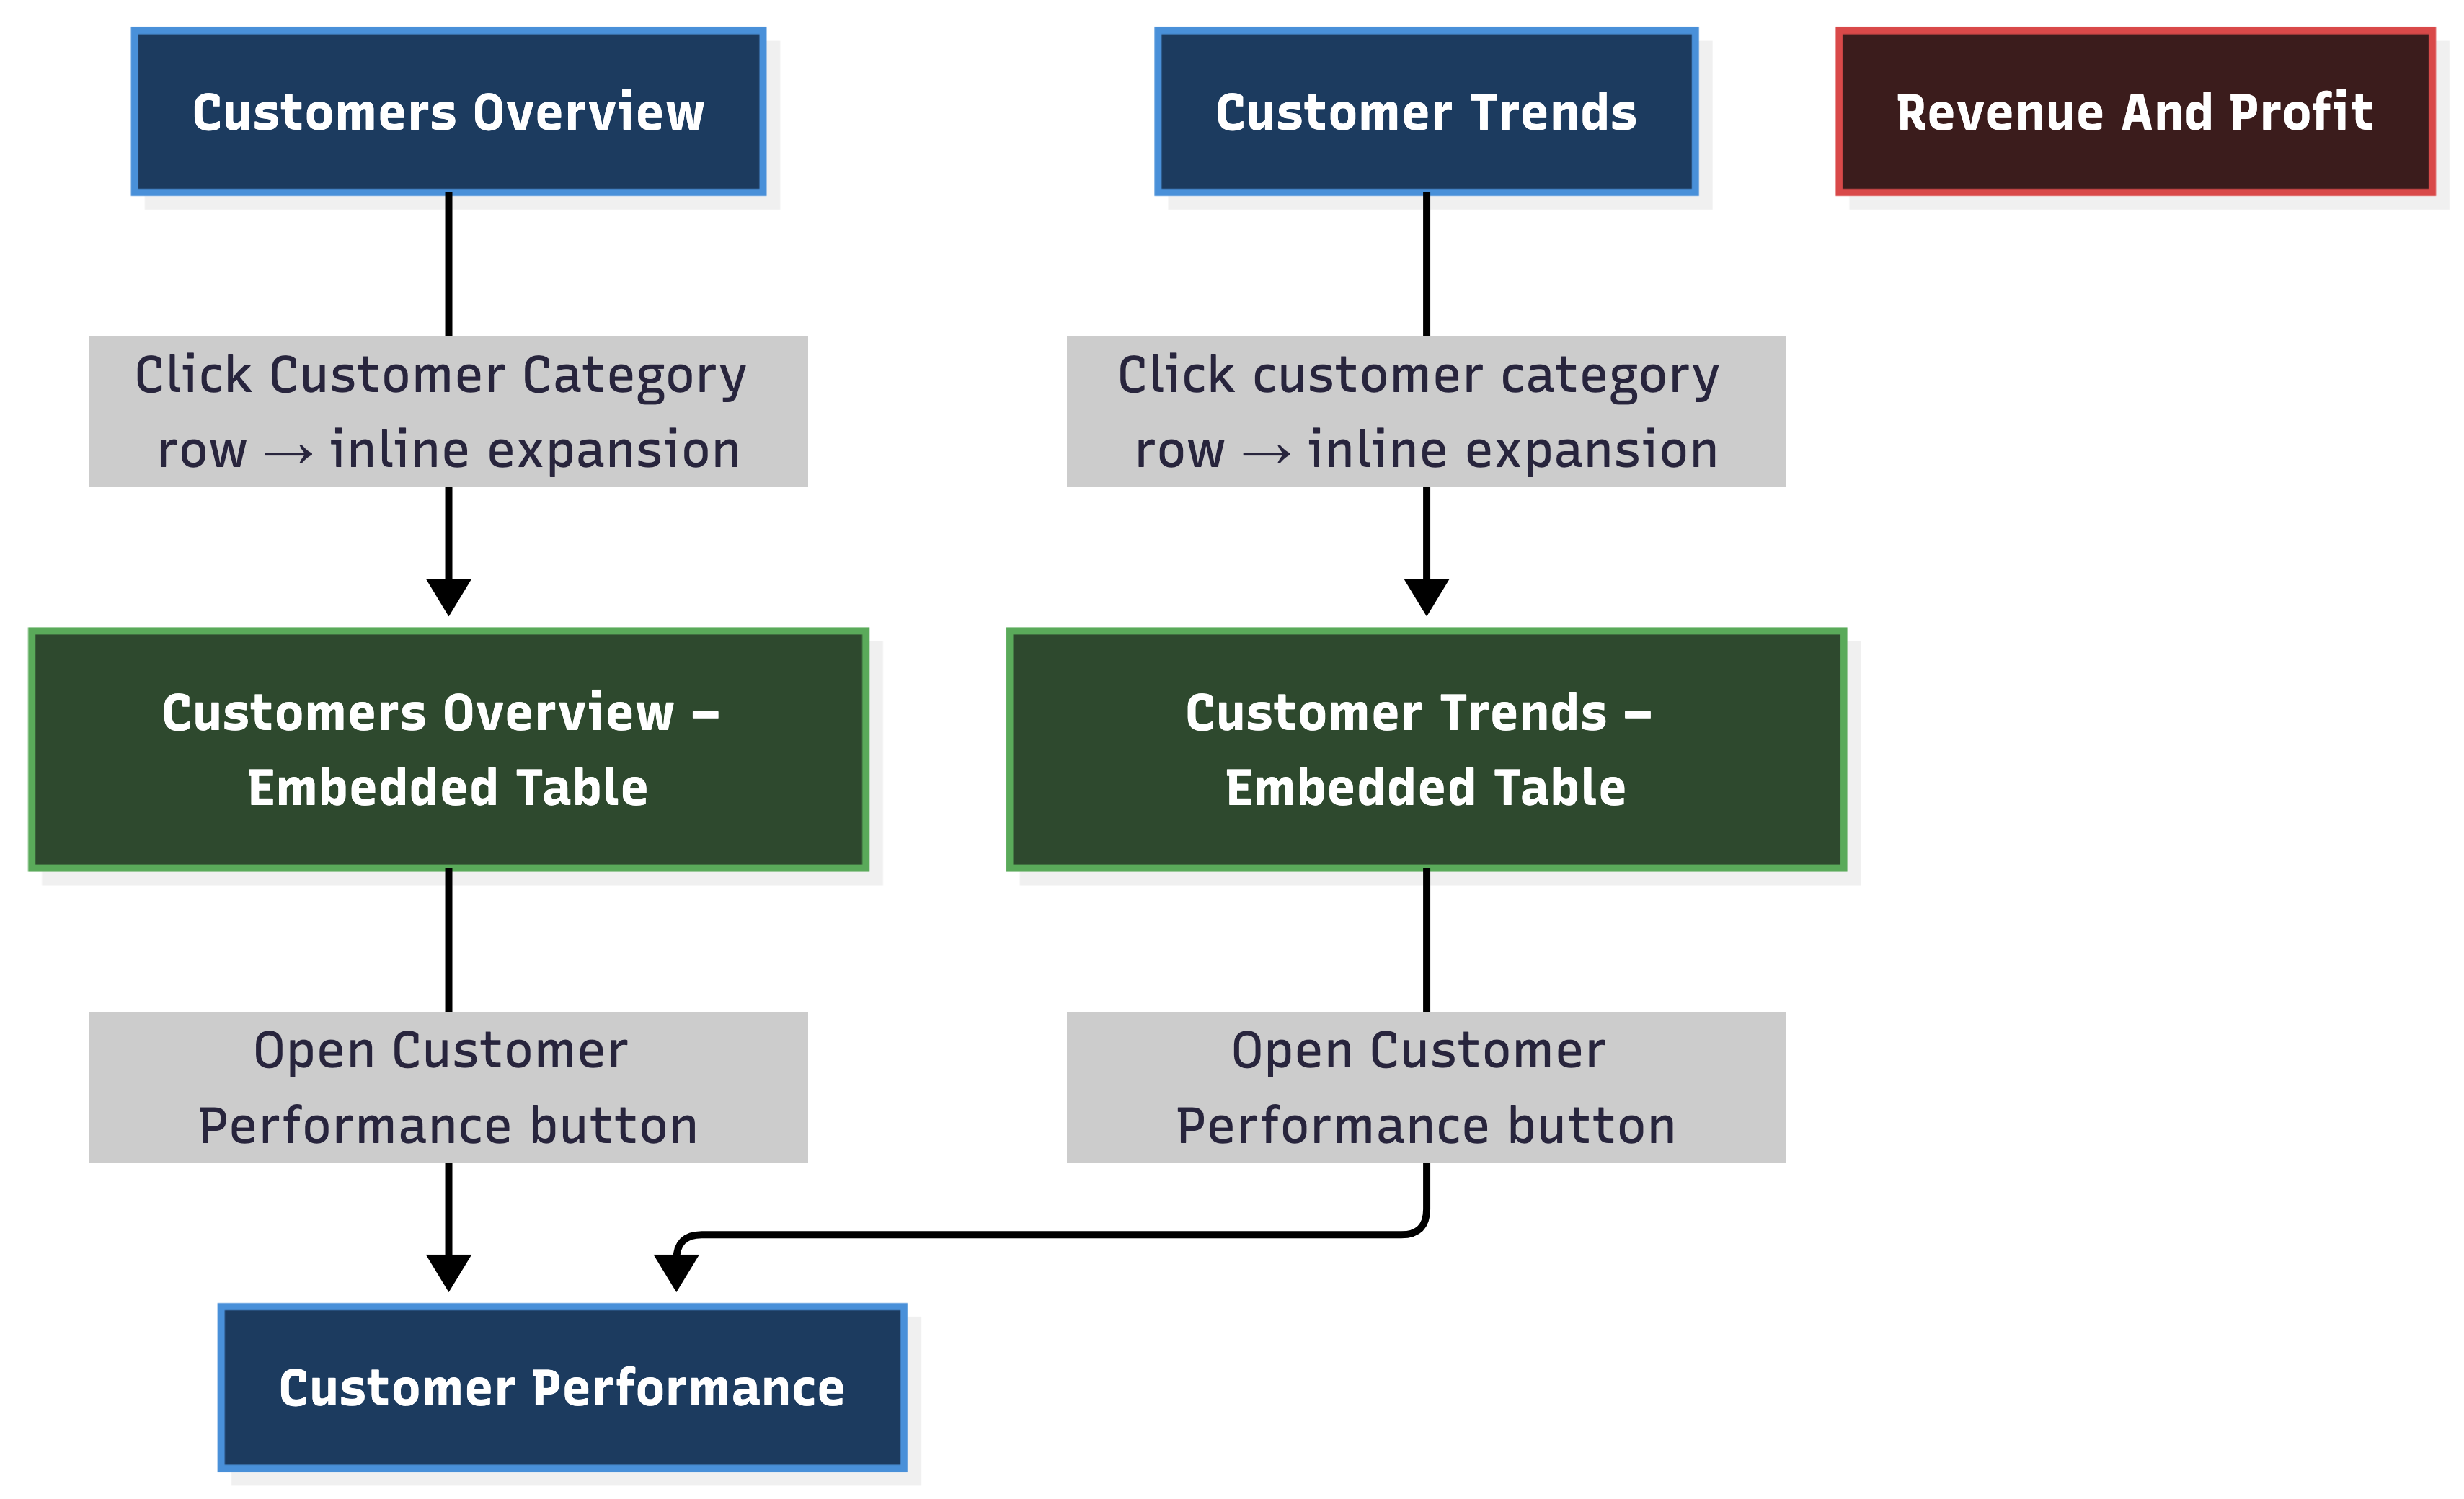
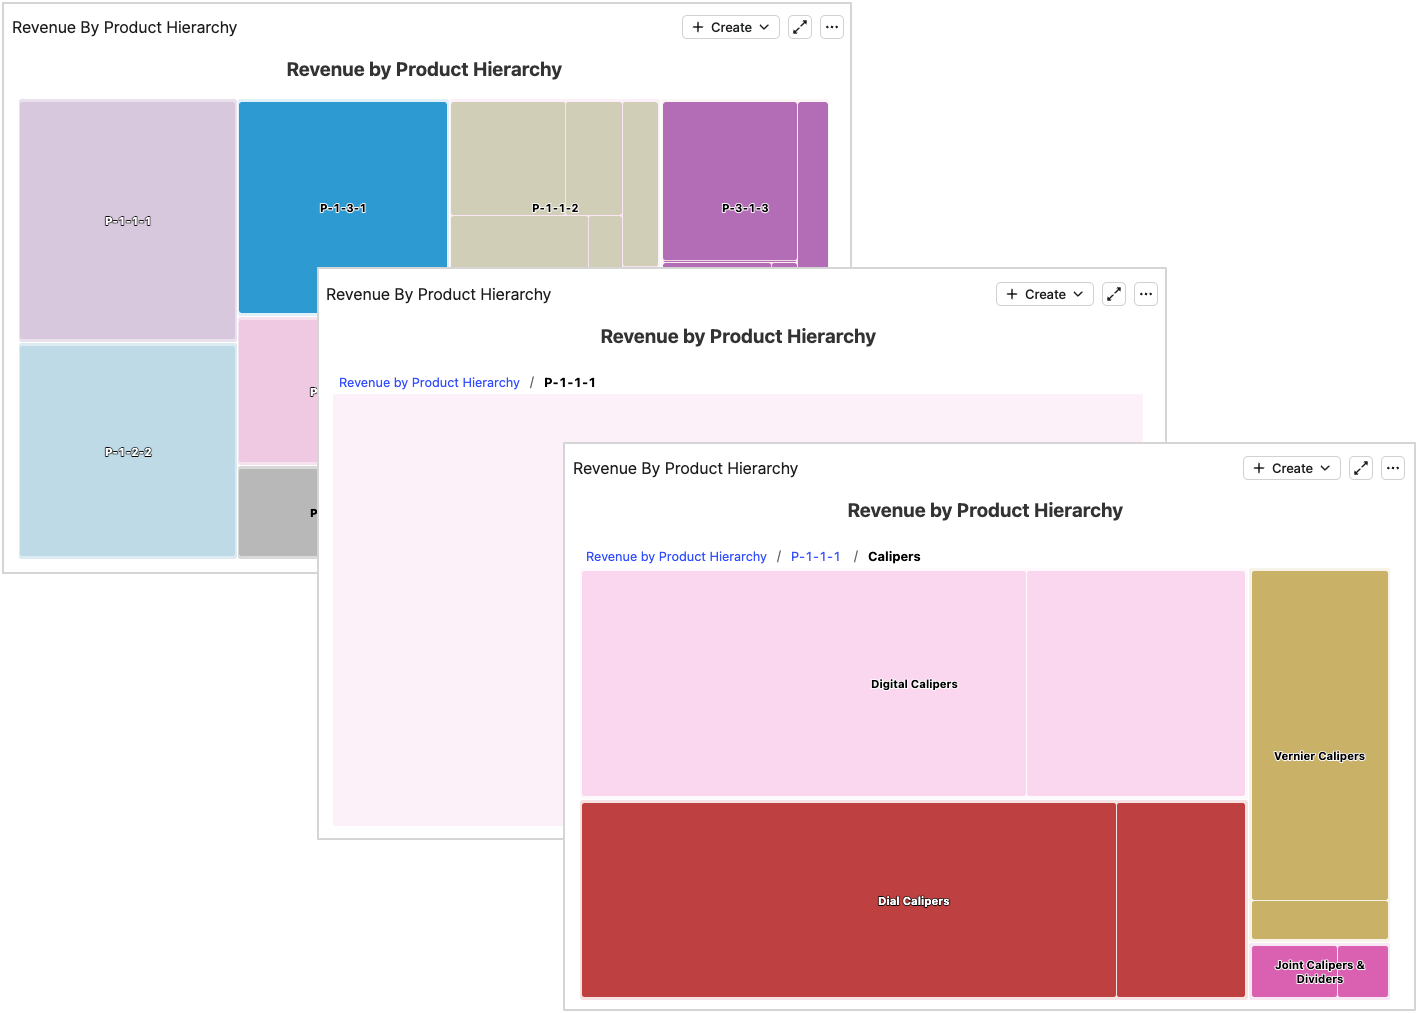
Supports a guided user flow: you start from a high‑level overview, drill down by customer, product, segment or time, and then move to more detailed dashboards while keeping filters and context aligned.
-
Helps business users identify and quantify opportunities and, when Pricefx Agents are installed, trigger Agents and Actions directly from the dashboard UI, closing the loop between insight and execution.
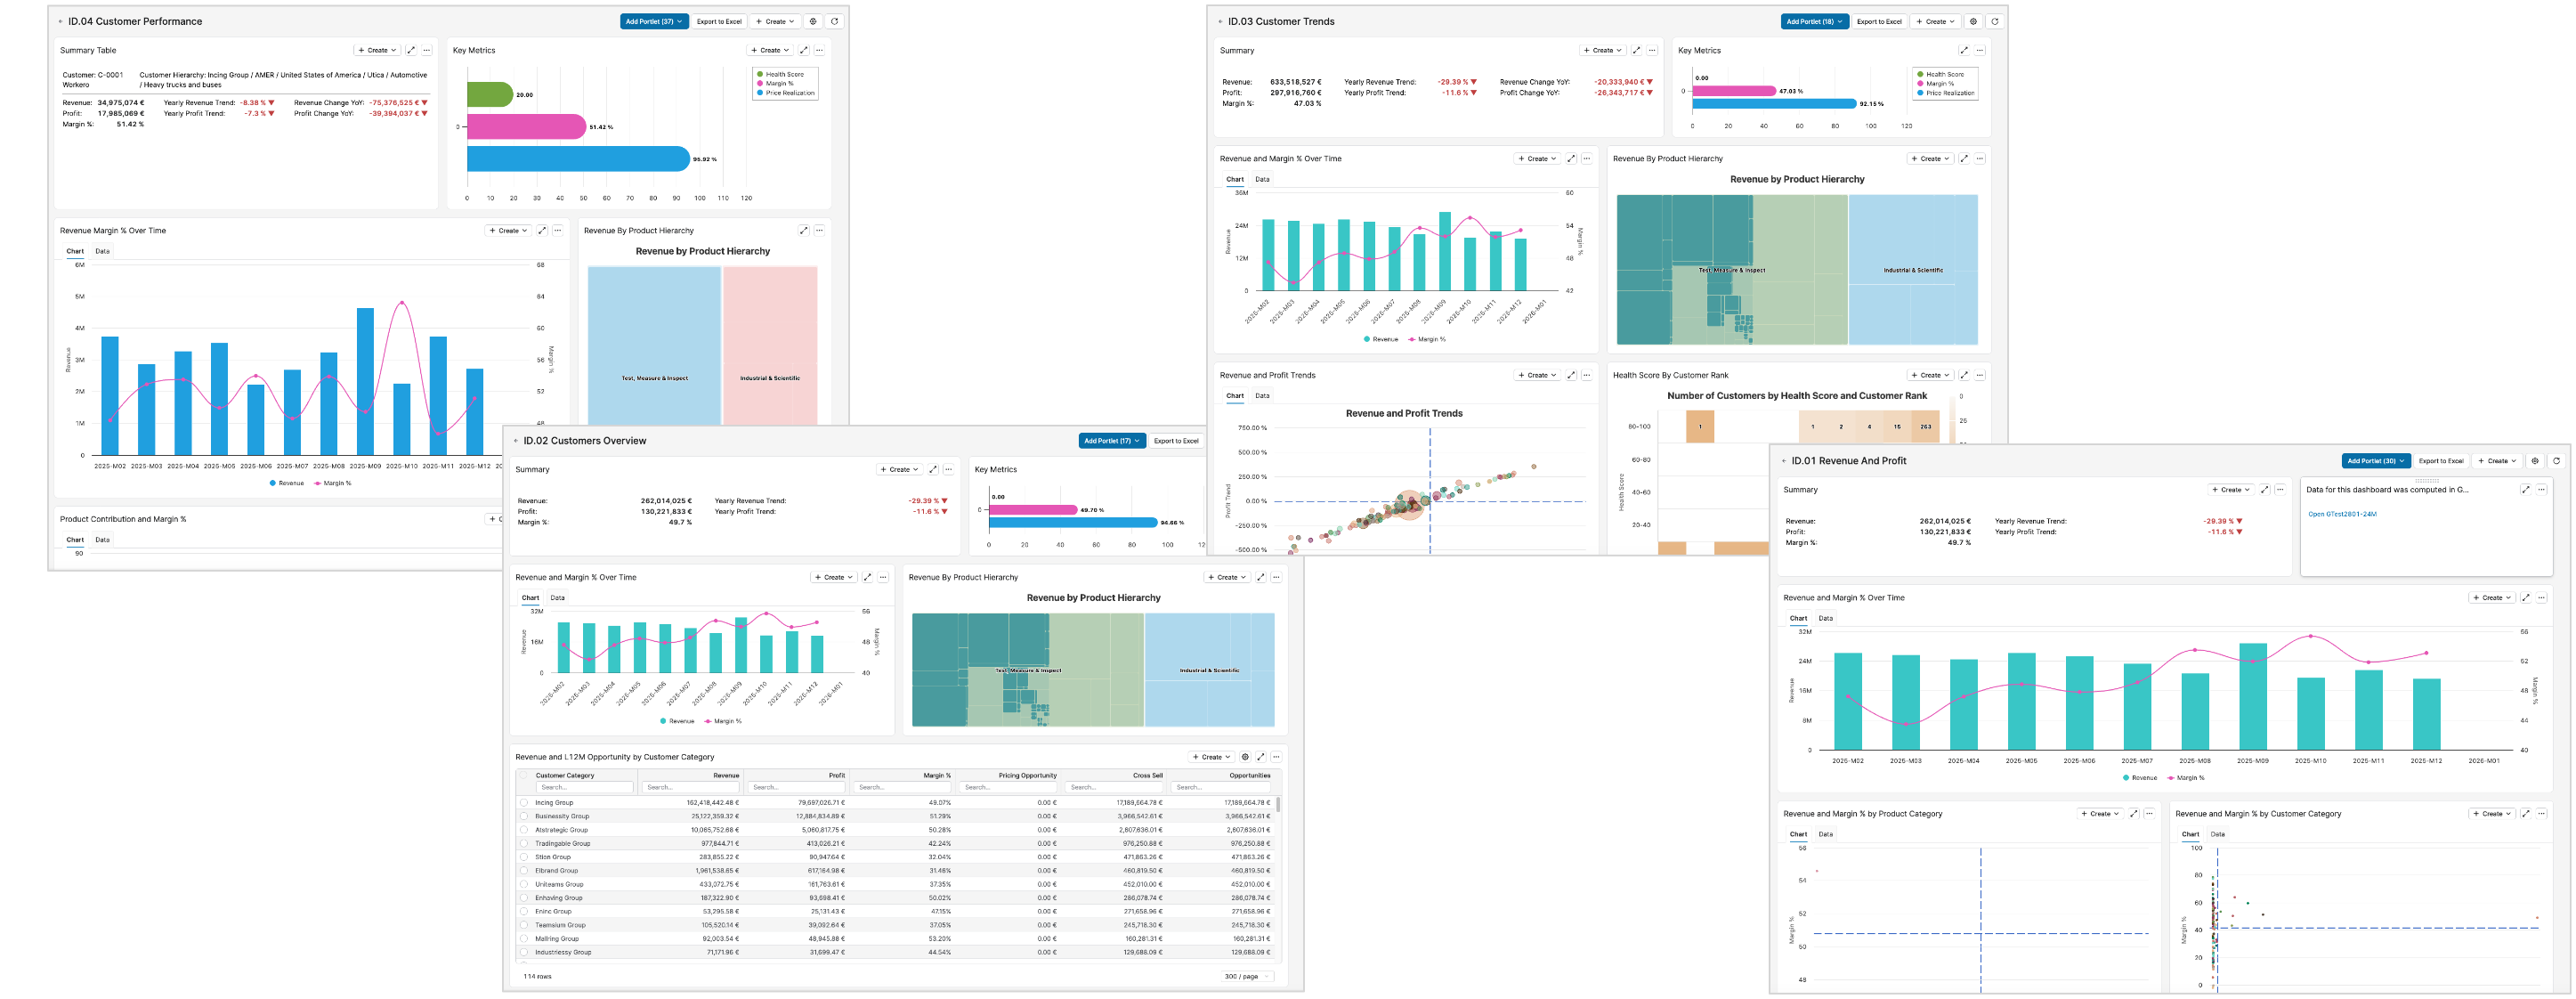
Four Connected Dashboards
Insights Dashboards combines customer analytics, revenue and profit analysis, customer performance diagnostics, and trend monitoring in a single connected suite.
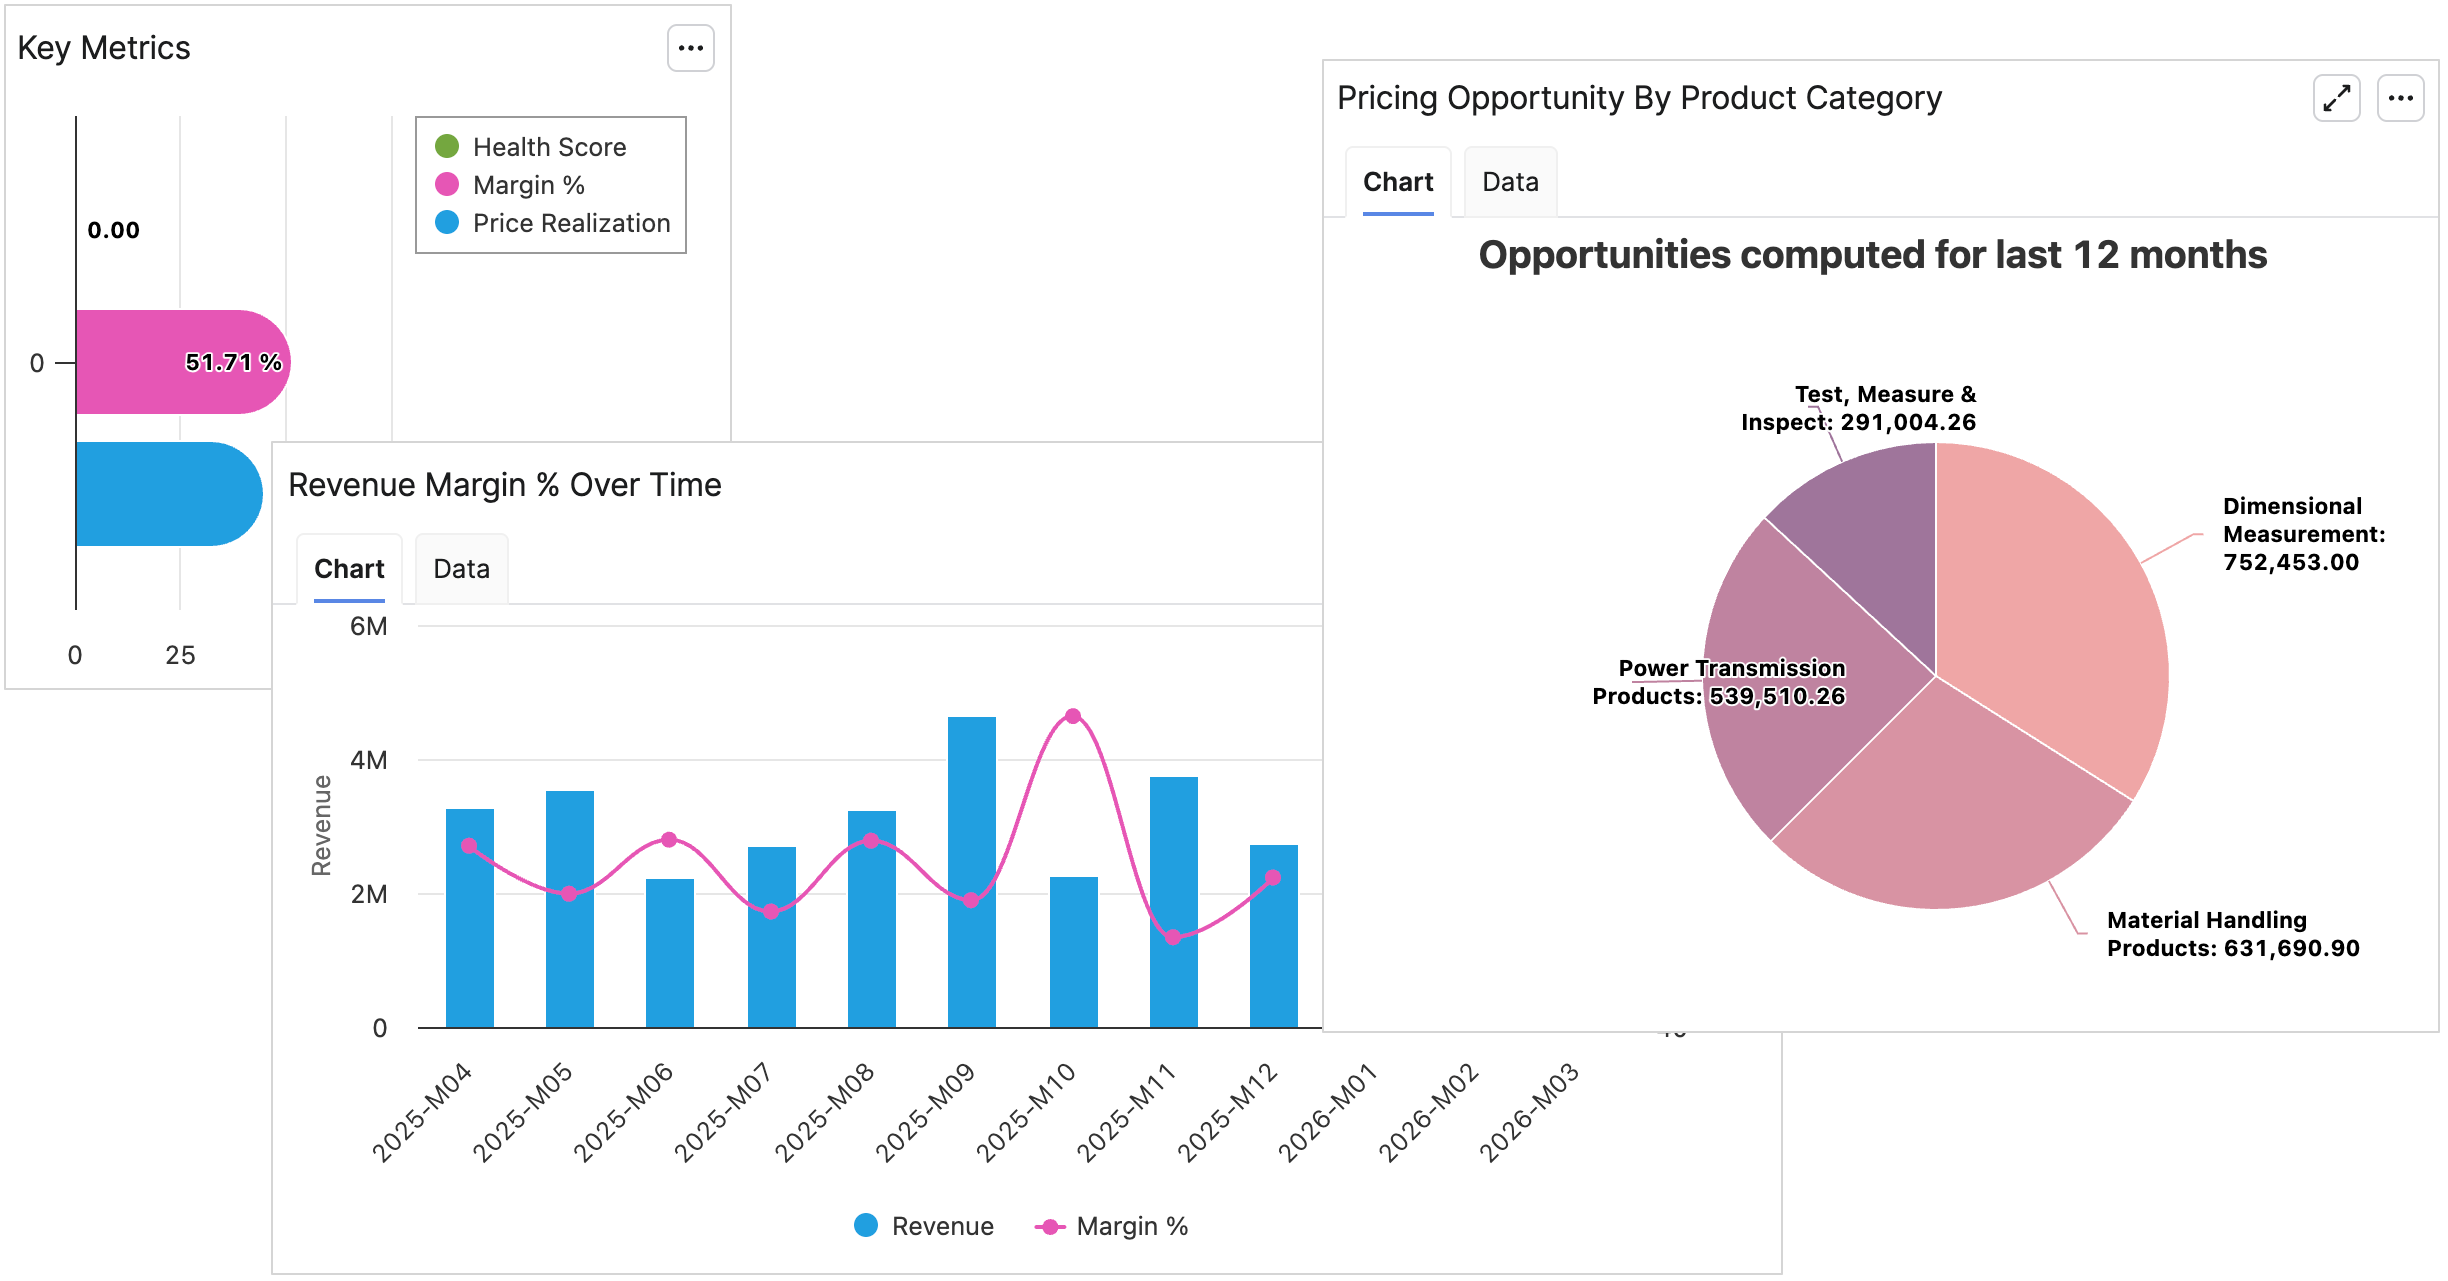
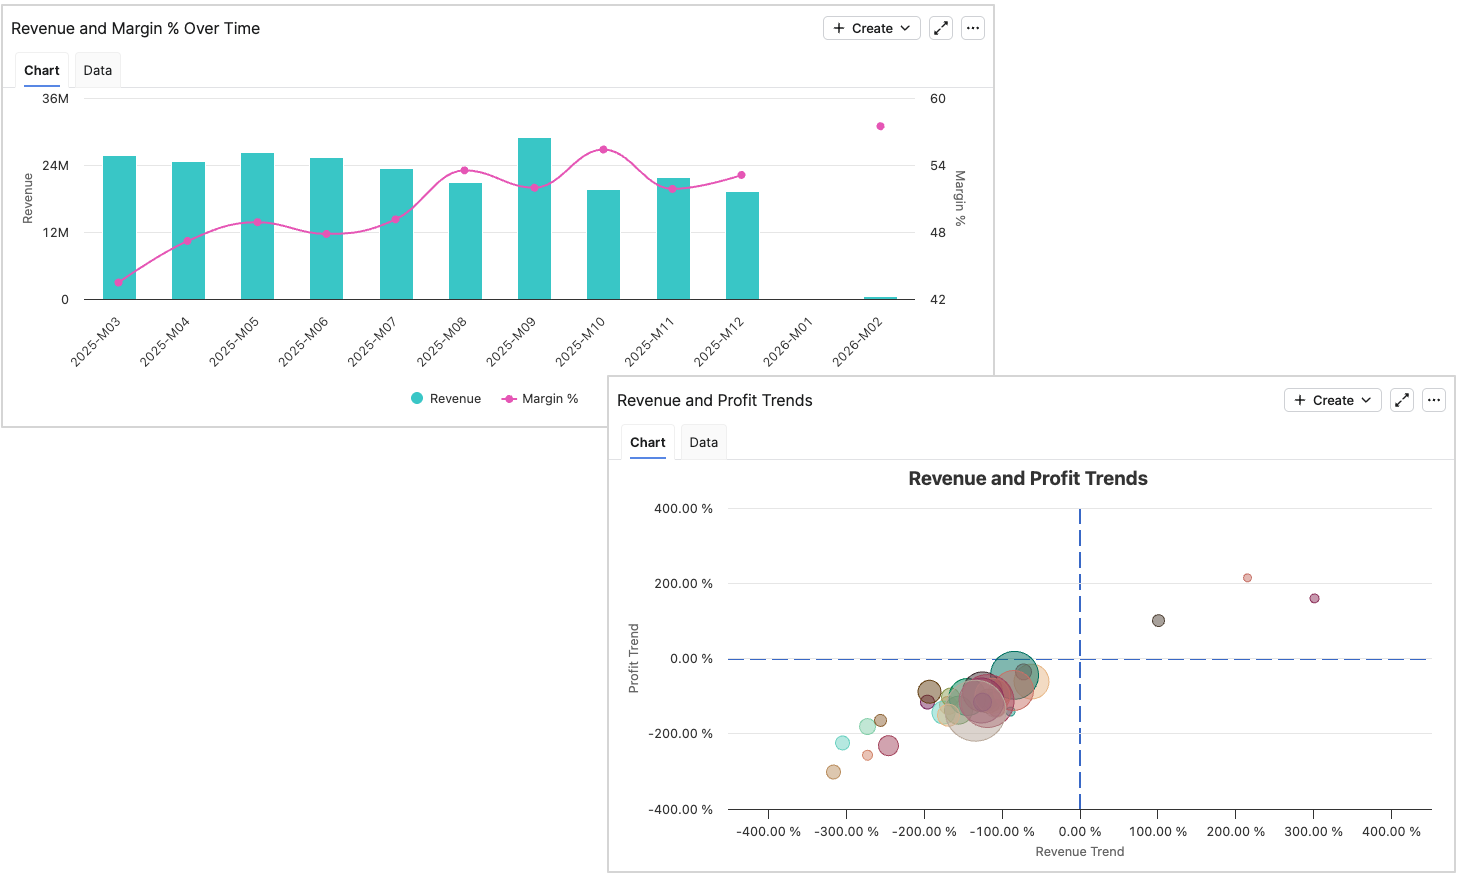
Revenue and Profit
Visualize the relationship between revenue and margin across time, product, and customer dimensions, including time-series and waterfall analysis.
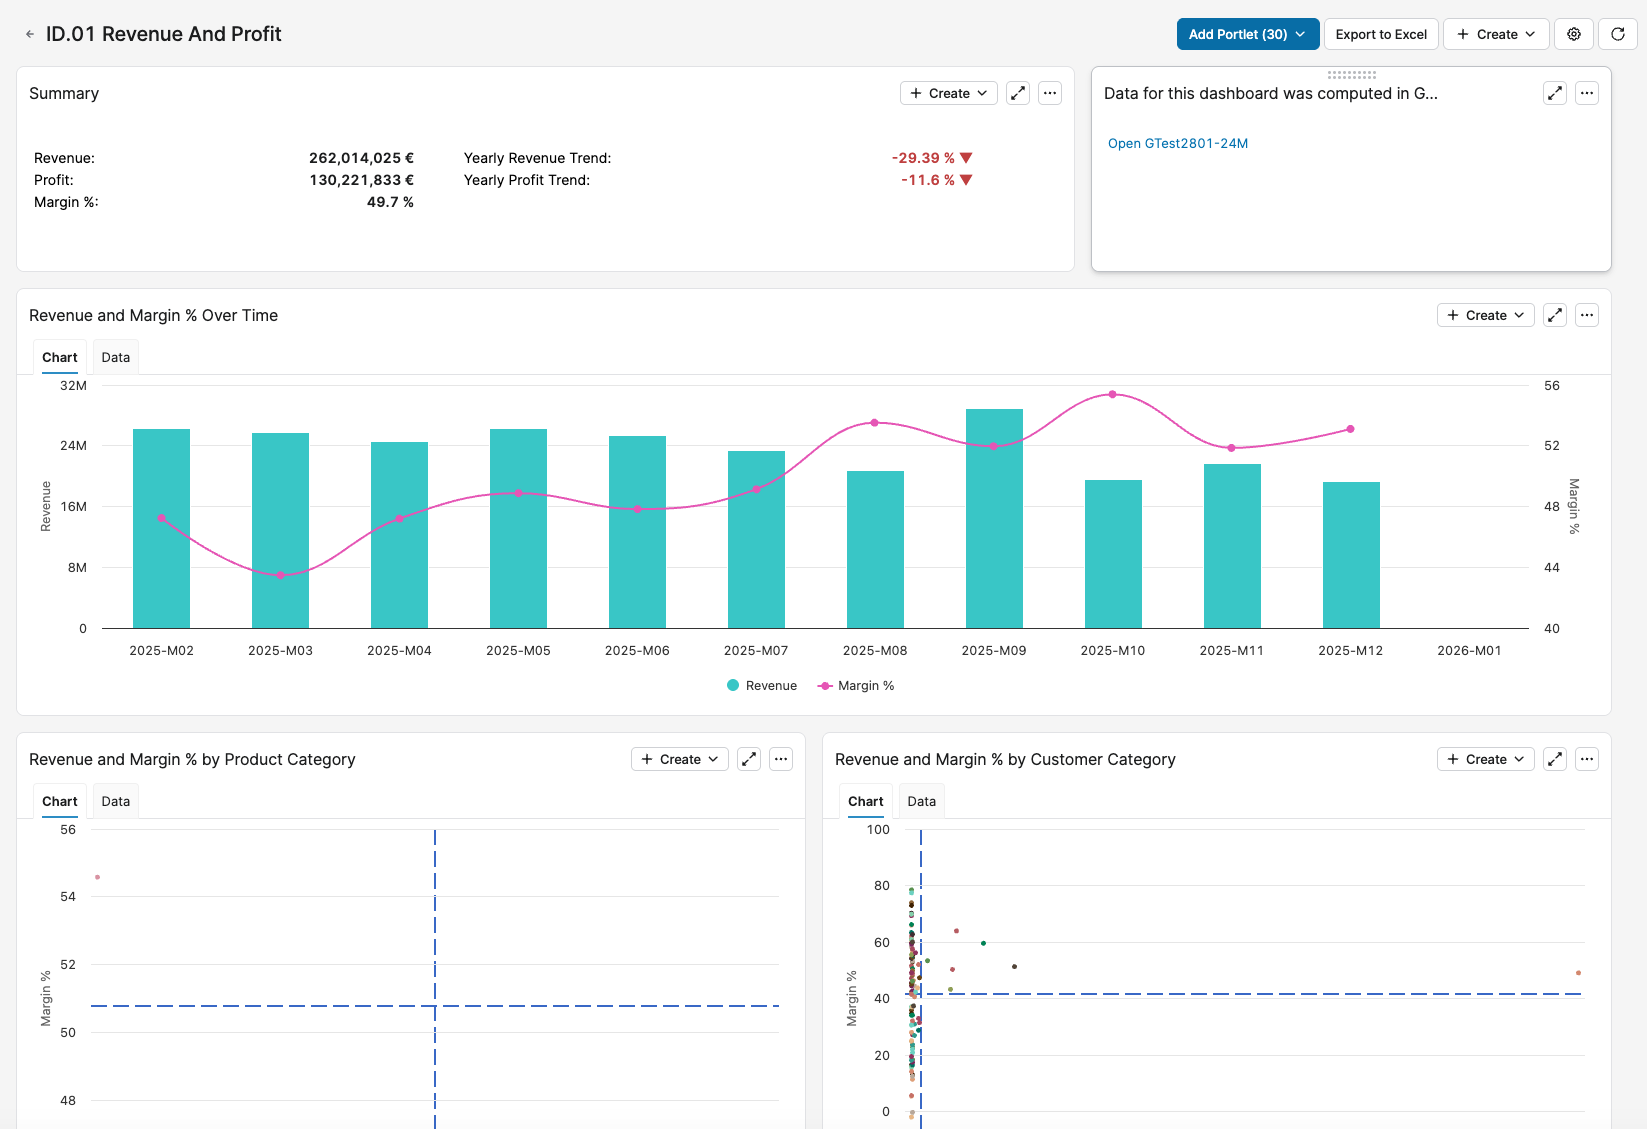
For more information see Revenue And Profit Dashboard (Insights Dashboards).
Customer Performance
Investigate relationships between contribution, performance, and pricing outcomes to pinpoint where action is needed.
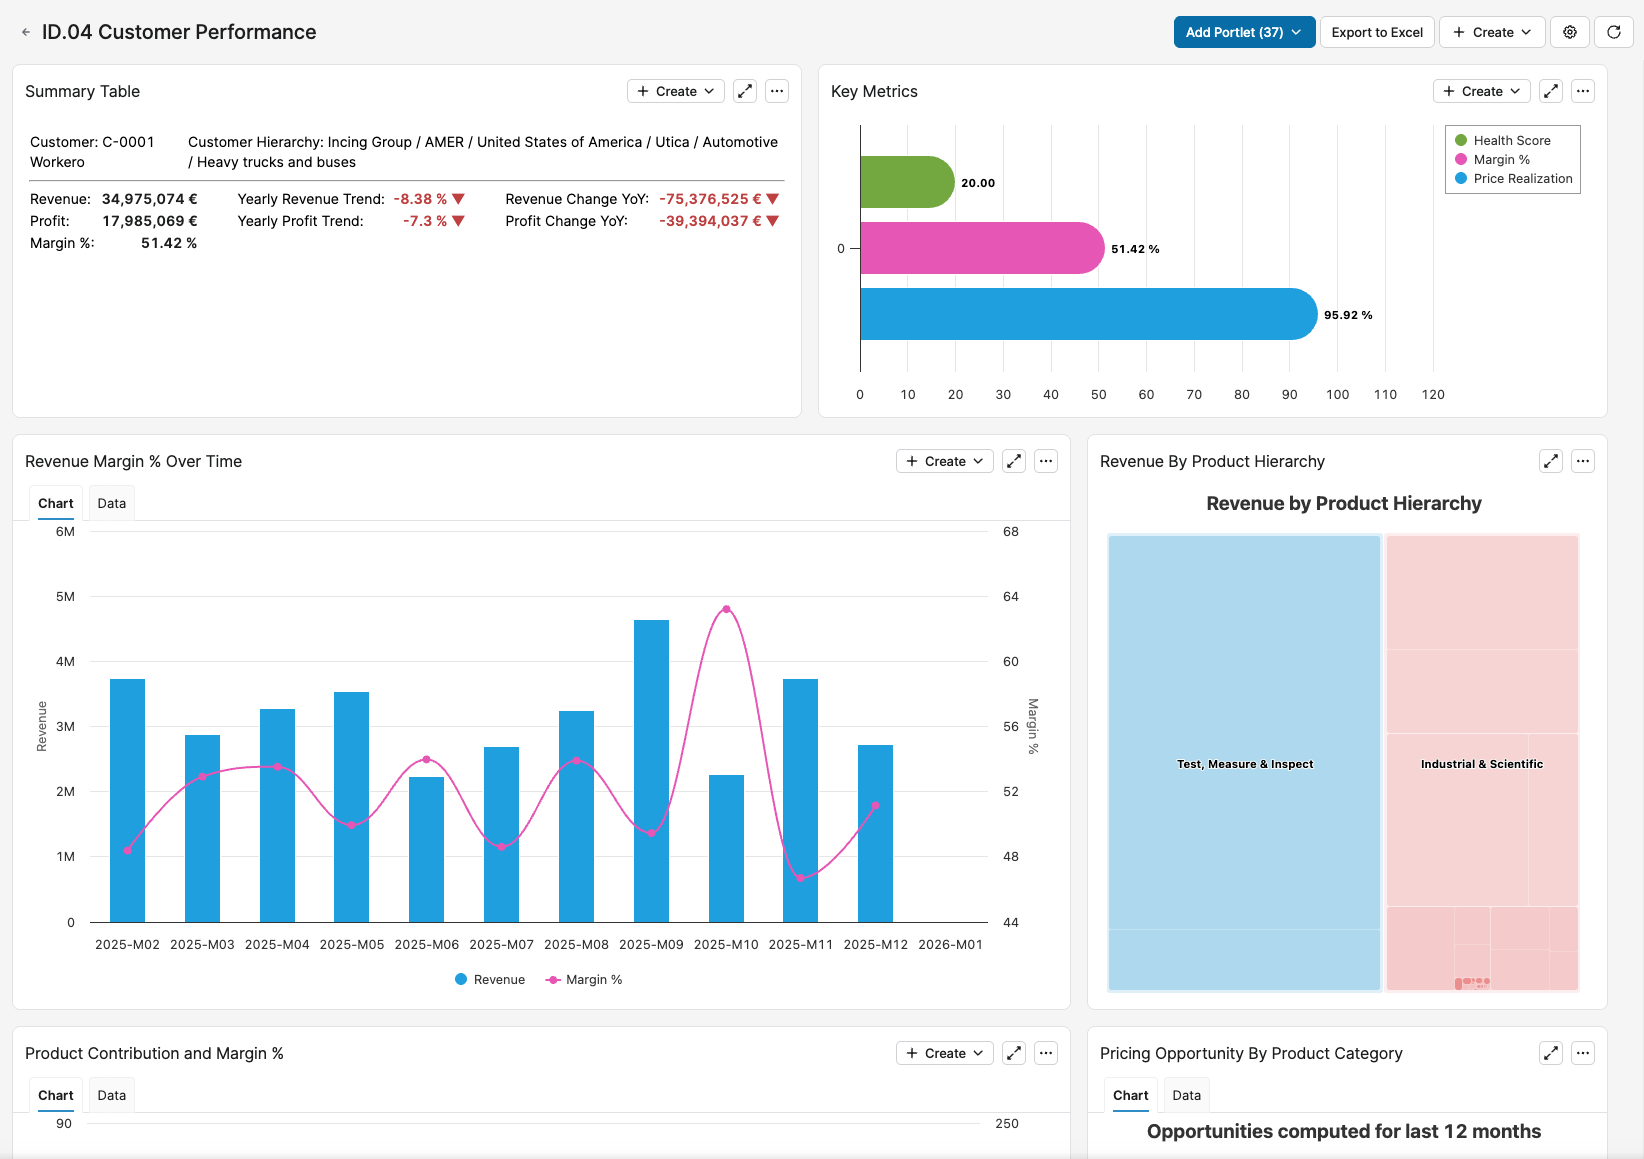
For more information see Customer Performance Dashboard (Insights Dashboards).
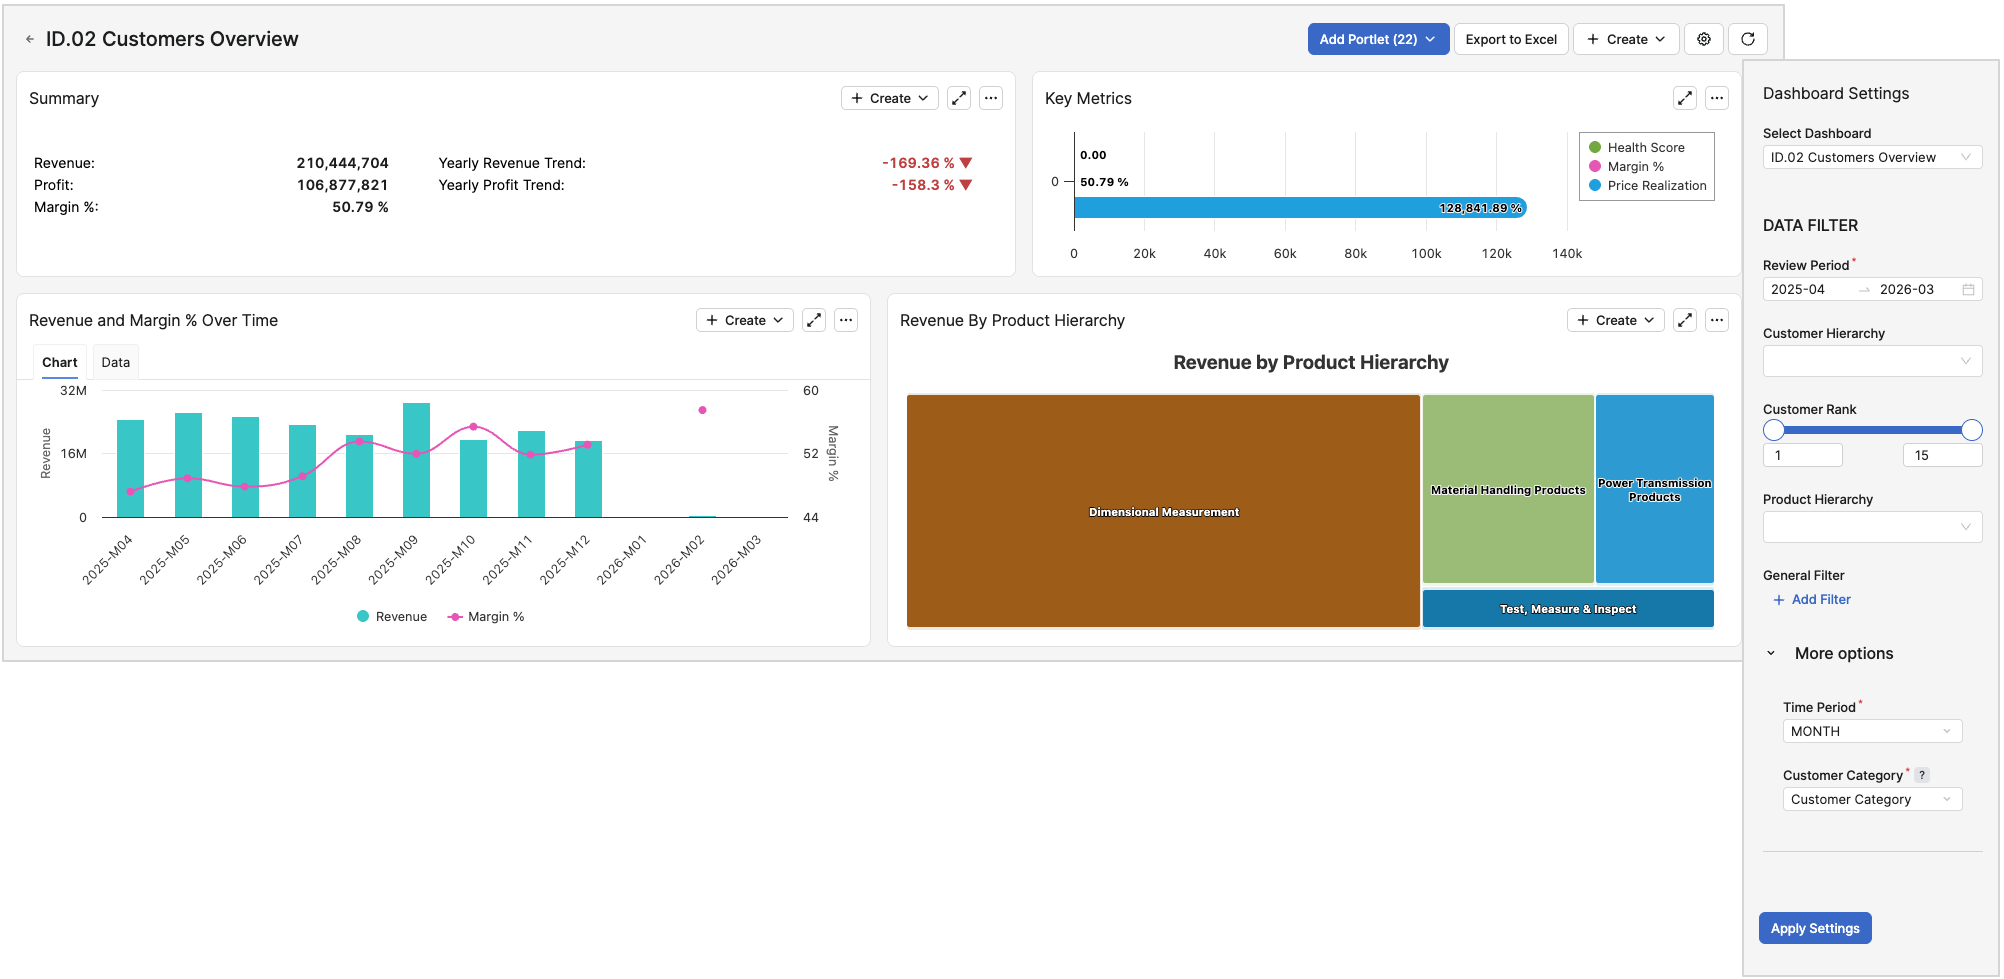
Customers Overview
See revenue, profit, margin %, health score, price realization, pricing opportunity, and cross-sell from a customer-centered perspective.
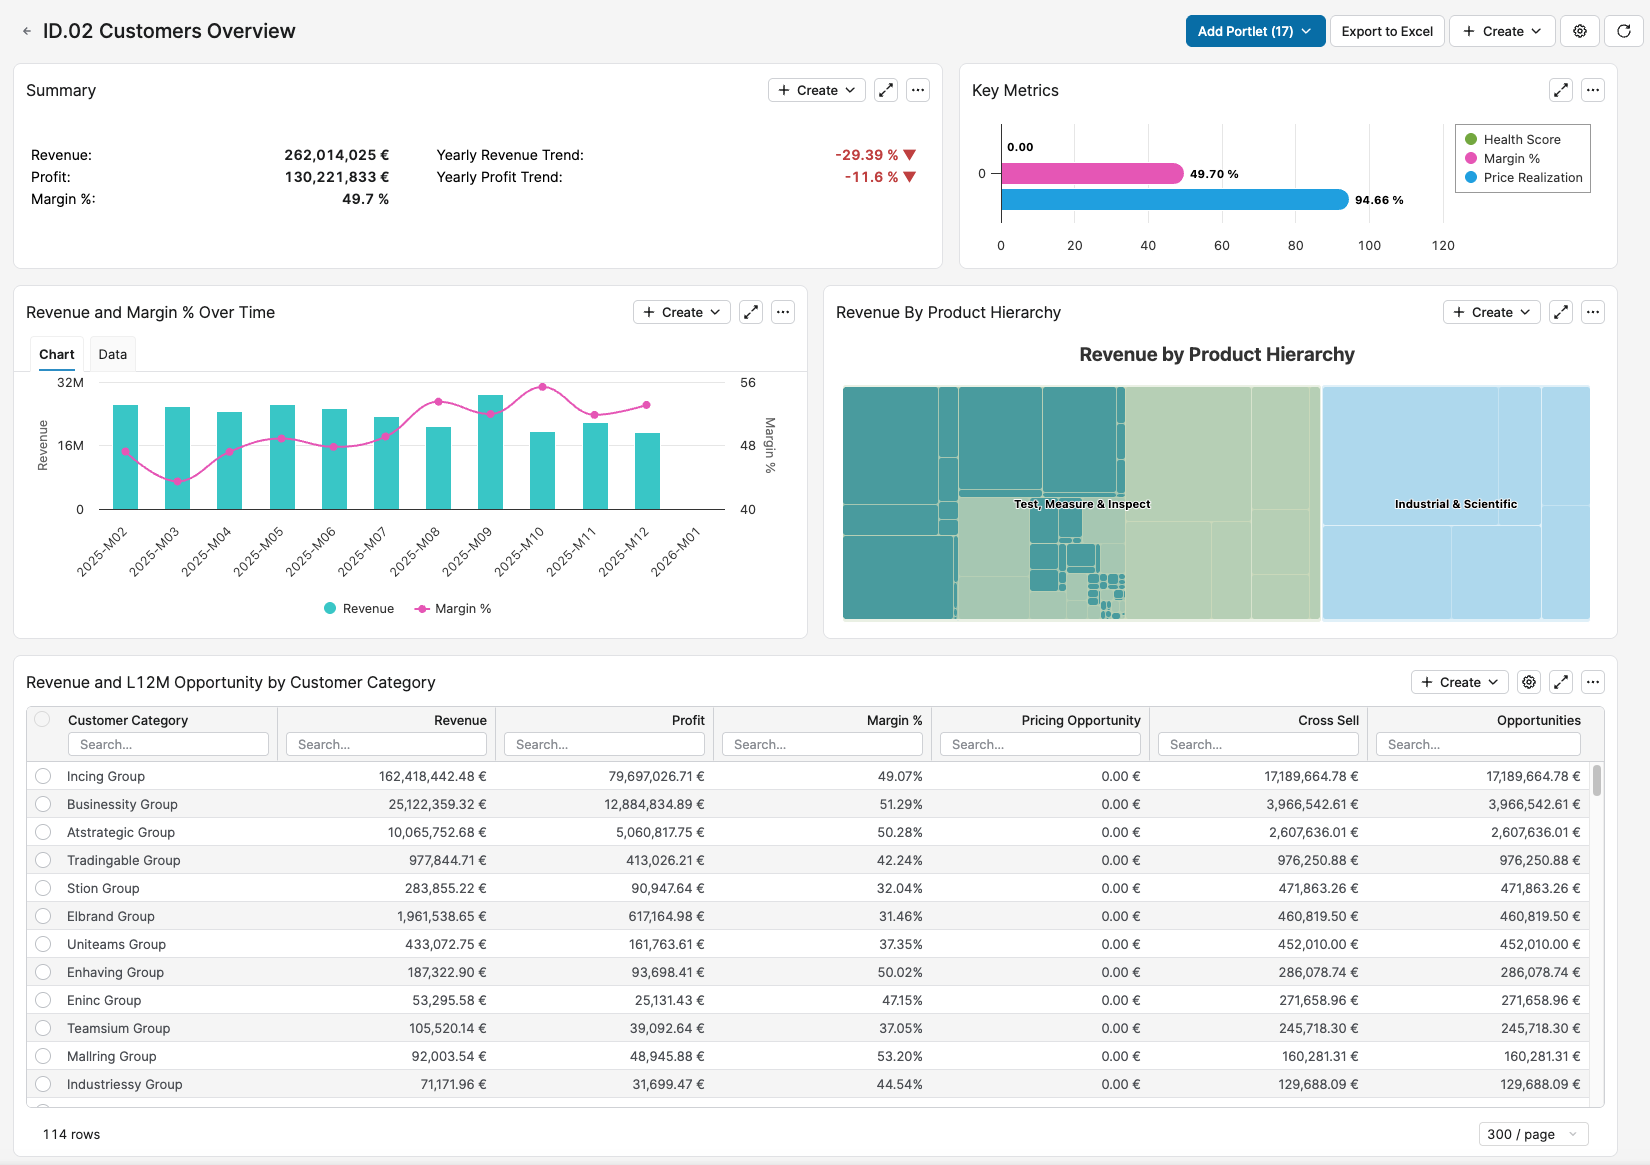
For more information see Customers Overview Dashboard (Insights Dashboards).
Customer Trends
Track revenue, profit, margin, and health score trends over time, including year-over-year changes and anomaly spotting.
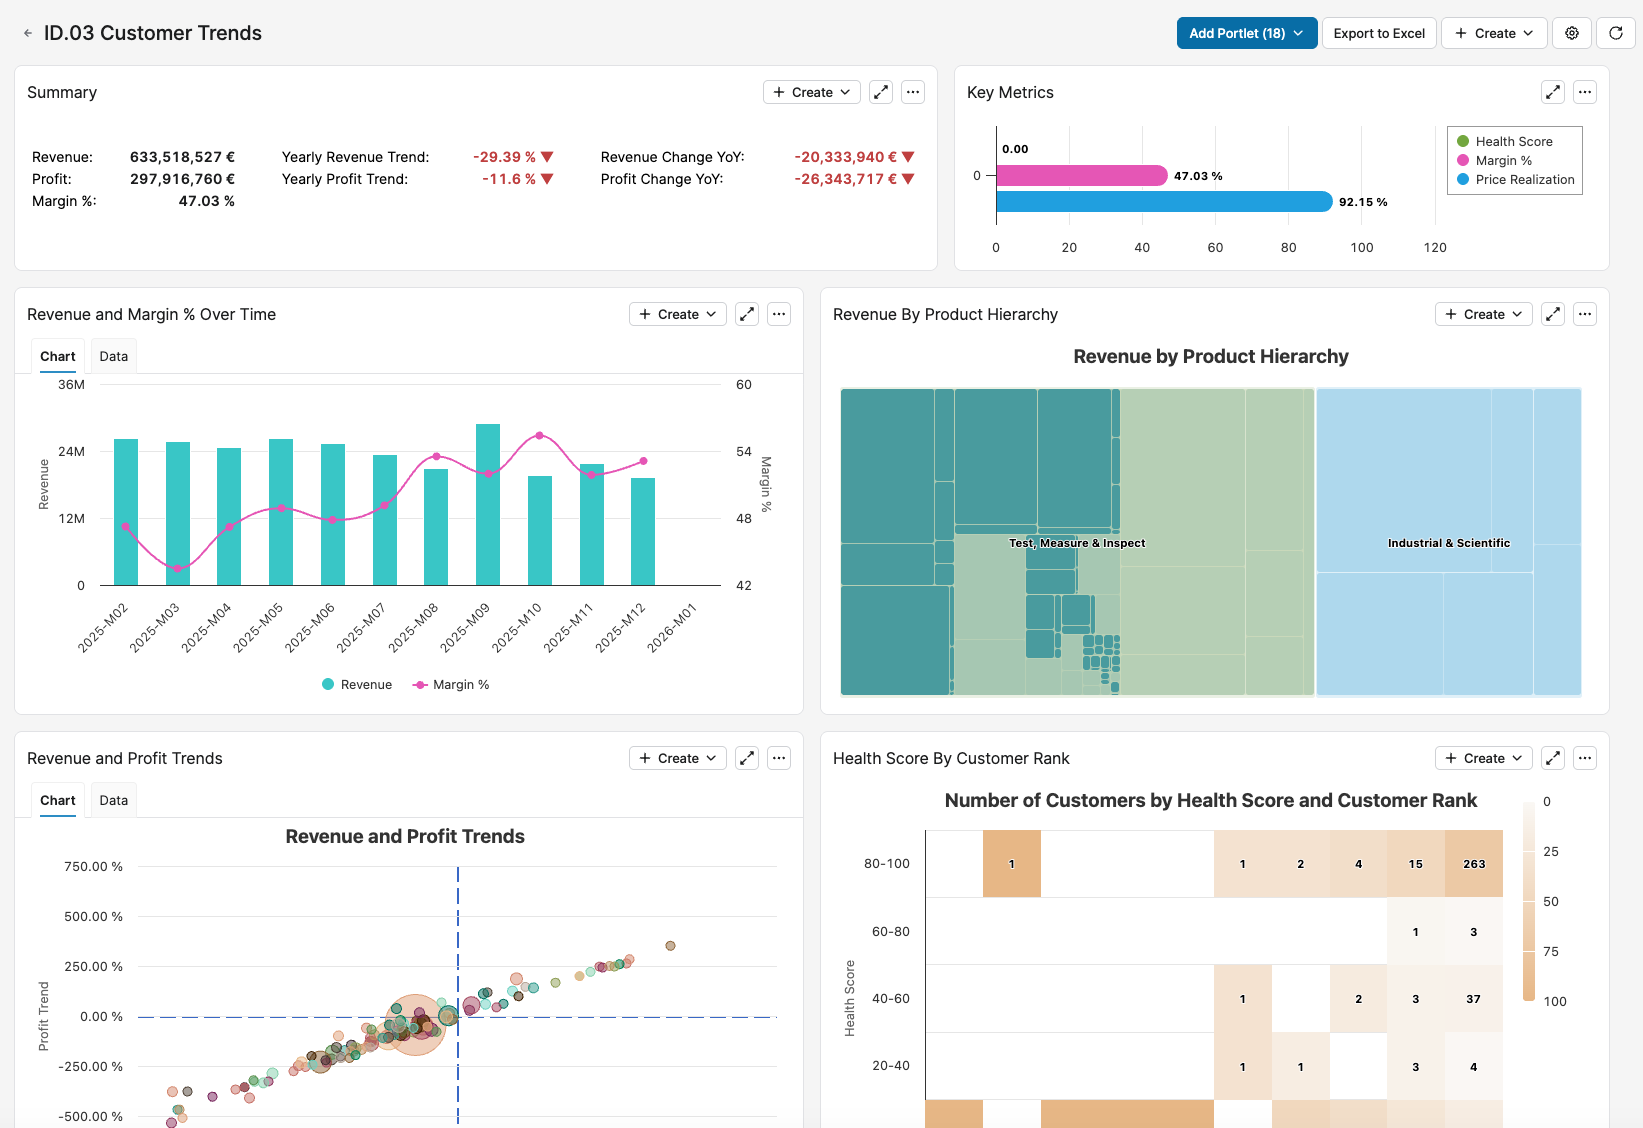
For more information see Customer Trends Dashboard (Insights Dashboards).
Key Features
The Insights Dashboards is a unified, pricing-centric replacement for legacy Sales Insights and Customer Insights patterns, with connected analysis and modern navigation.
Pricing-first Dashboards
Charts and KPIs are tuned for pricing performance, margin management, and opportunity discovery.
Connected Navigation
Filters and drilldowns stay aligned as users move from summary to detail across dashboards.
Unified Experience
Designed to substitute Sales Insights and Customer Insights with one more integrated flow.
Copilot-ready
Structured metadata and dashboard context support smarter assistance and action-oriented workflows.
Designed with Guided User Flow
The documented interaction model is simple: start broad, identify anomalies, drill down with preserved context, and turn findings into action.
1. Monitor
Open the overview dashboard, review KPIs, and apply filters.
2. Spot Issues
Notice margin shortfalls, trend changes, or performance outliers.
3. Drill Down
Click through to customer or product detail with the relevant context intact.
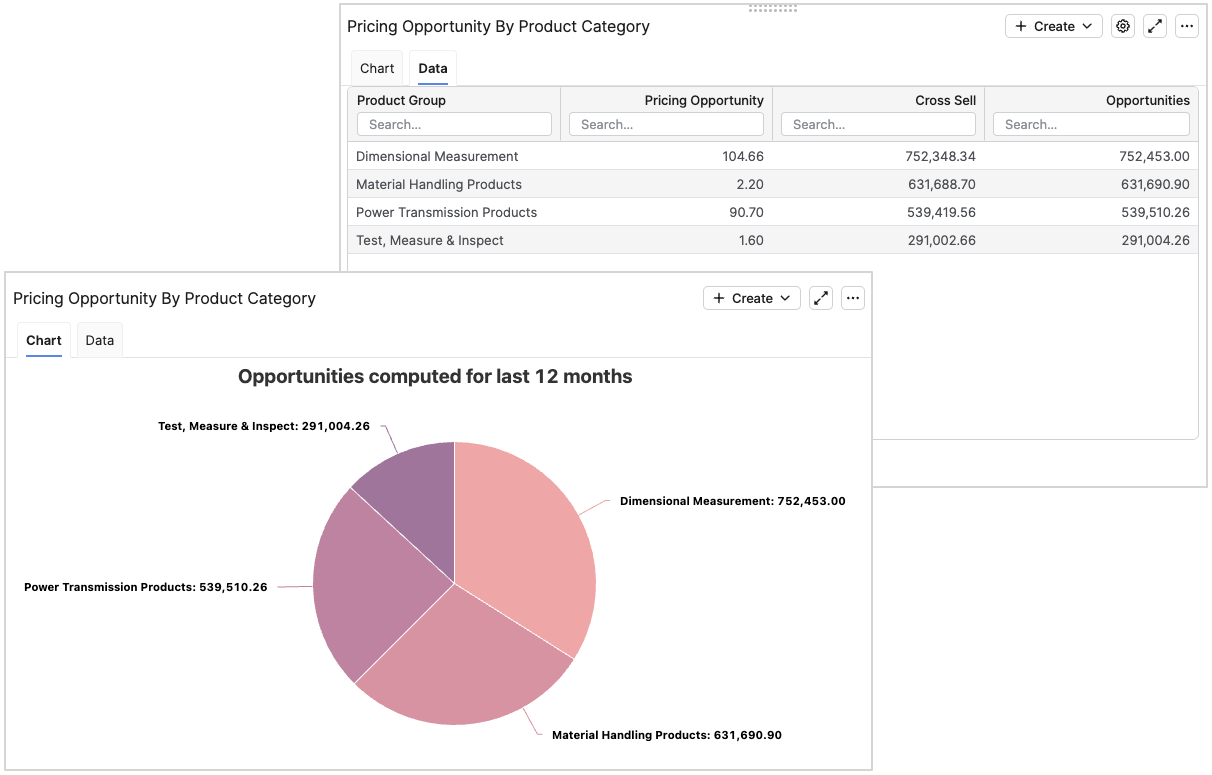
4. Quantify Opportunity
Identify pricing opportunity, excessive discounting, or cross-sell potential.
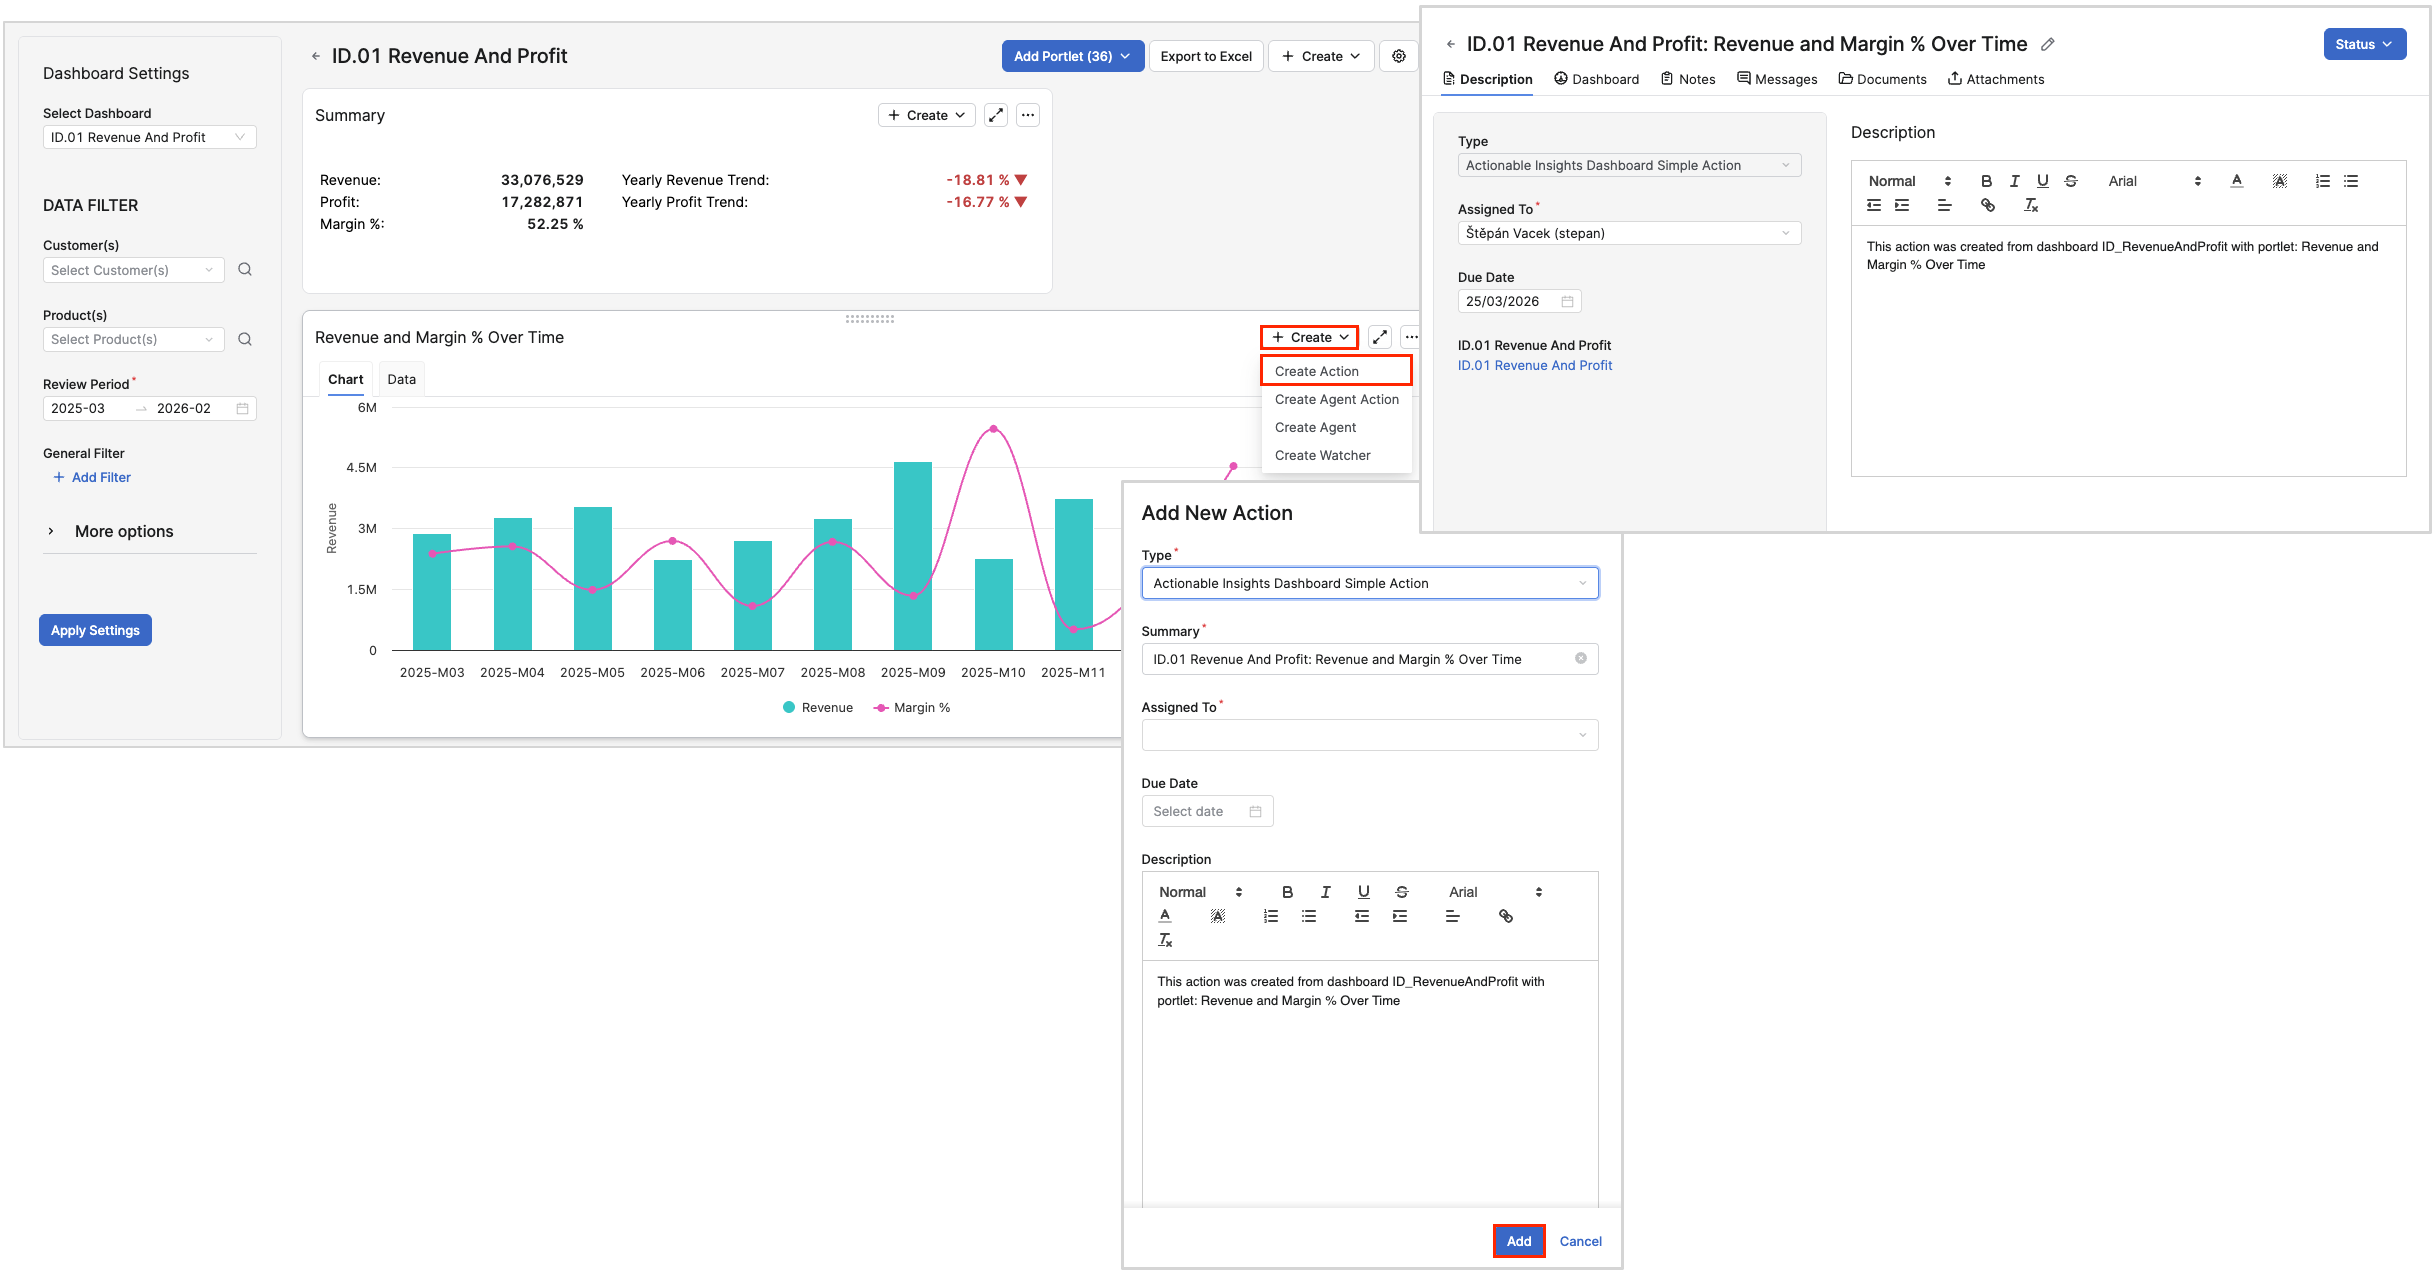
5. Act
Create Actions or Agents when installed, then monitor outcomes in the same flow.
Close Loop Between Insight and Execution
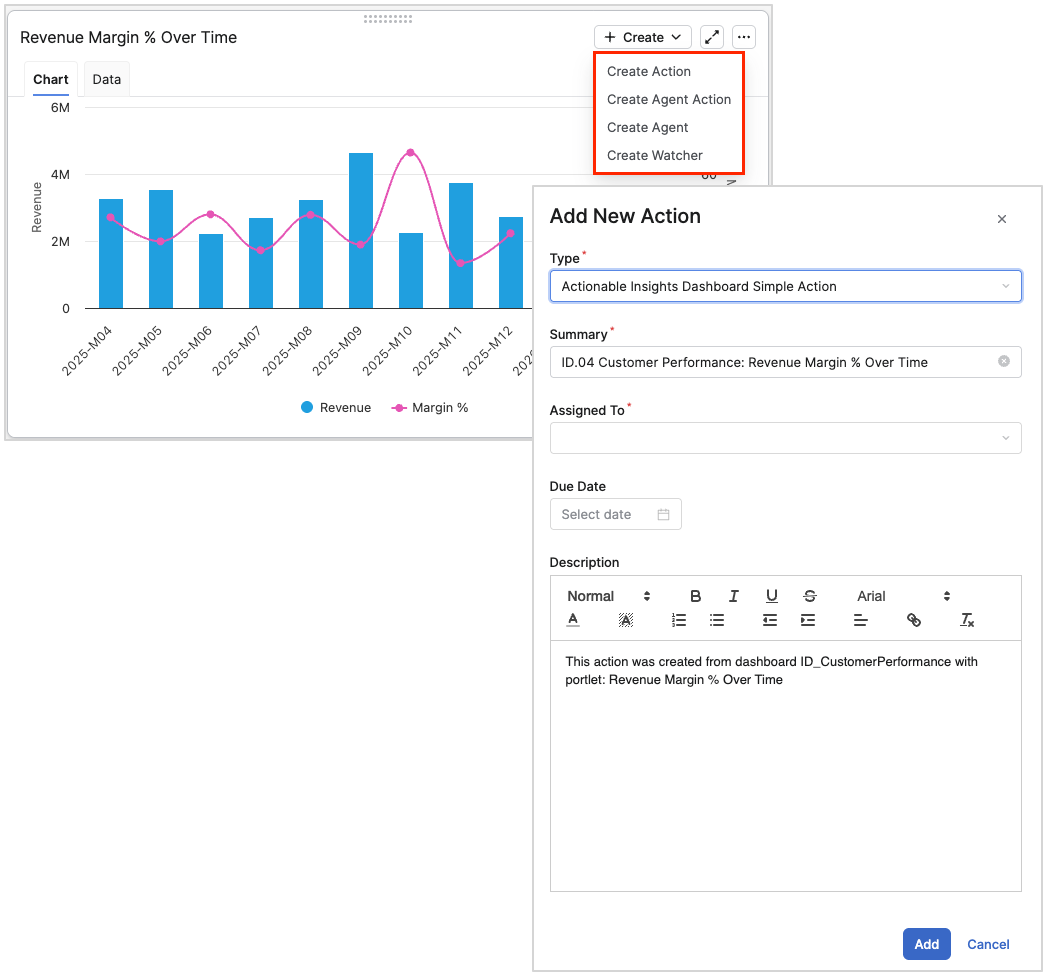
When Pricefx Agents are installed, Insights Dashboards can support action creation directly from the dashboard context. Users can create Actions, create Agent Actions, or define a new Agent to continuously monitor recurring patterns.
-
Create follow-up tasks directly from the situation visible in a dashboard.
-
Carry customer, product, and time context into the assigned action.
-
Turn recurring risks into continuously monitored Agent-driven workflows.
Business Impact at Glance
Insights Dashboards is built to enhance profitability by helping teams understand revenue and margin dynamics, recognize opportunities for improvement, and navigate quickly from metrics to root cause analysis.