
Revenue, Margin and Volume Trend Last 12 Months
First, the respective metric (revenue, margin or volume) is calculated for every single time unit.
Customer level: time unit = month
Product level: time unit = month
The least-square approach is used to compute the trend. The trend formula was updated in the Insights Dashboards 1.1.0 to ensure accurate data visualization across dashboards and the monitoring overview.
For more information see the Fitting a trend: Least-squares (Wikipedia).
Formula
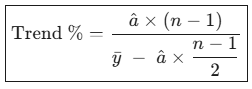
Formula Text Version
Trends % = â × (n-1) / [ȳ - â× (n-1)/2
â = [Σᵢ₌₁ⁿ (xᵢ – x̄)(yᵢ – ȳ)] / [Σᵢ₌₁ⁿ (xᵢ – x̄)²]
-
x is the month number (like month 1 would be the first month in scope)
-
x̄ is the average month number
-
y is the metric to consider, like margin
-
ȳ is the average metric to consider, like average margin
To convert the trend value â back to a percentage, the following formula is used: â / average(metric)
Periods with no transactions are considered to have zero revenue, margin, and volume, and are included in the trend computation. The updated formula correctly handles missing data periods, resolving a previous inconsistency between the trend values displayed on dashboards and those shown in the monitoring overview.
Example
Find the example in the following attachment (TrendValueWithLeastSquare_v_1_1.xlsx).