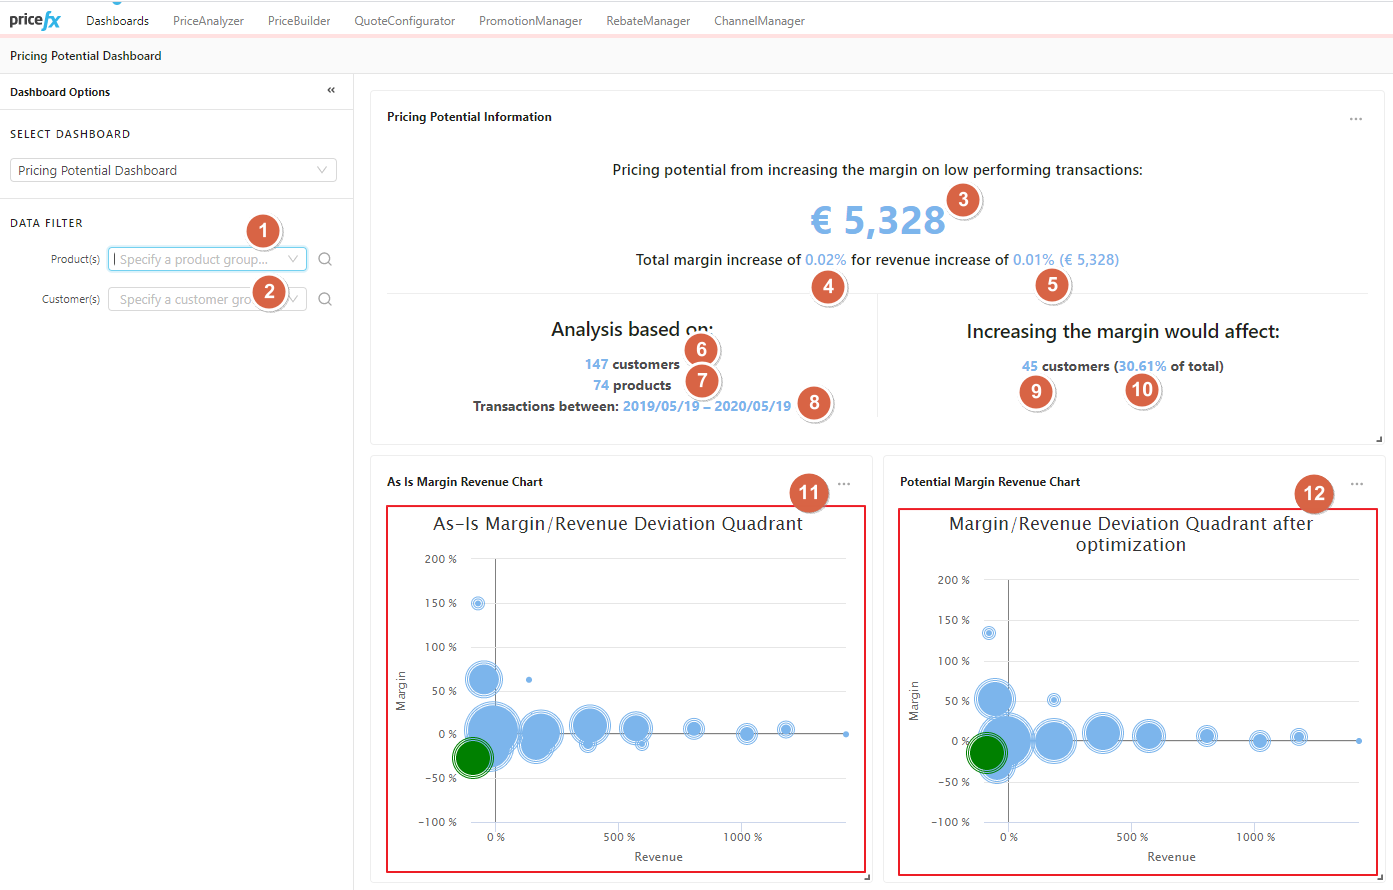
This dashboard is based on the Aggressive Price Increase Strategy. It displays the Margin/Revenue Deviation Quadrant in the chart.
Legend:
-
Data filter by Products
-
Data filter by Customers
-
Increase in total margin after using Blade strategies
-
Increase in total margin in percentage after using Blade strategies
-
Increase in total revenue and revenue percentage after using Blade strategies
-
Number of customers involved in analysis using Blade strategies
-
Number of products involved in analysis using Blade strategies
-
Data filtered by a date range
-
Number of customers affected (increase margin or eliminated) after using Blade strategies
-
Number of affected customers in percentage (increase margin or eliminated) after using Blade strategies
-
Chart with the current data. Each dot (Customer/Product pair) is displayed with a deviation from Median Revenue in % on the X axis and deviation from Median Margin in % on the Y axis
-
Chart with new data after using Blade strategies