This dashboard contains charts useful for Pricing Scientists and is usually used when setting up a PO Model. At the moment it consists of the charts listed below.
TODO:
- Extract screenshot example from demofx-dev
- Extract chart builder code from demofx-dev
- Compare if something is already in SIP
- Define what has to be mapped to DM
- Define Input / Filter fields
Charts (Portlets)
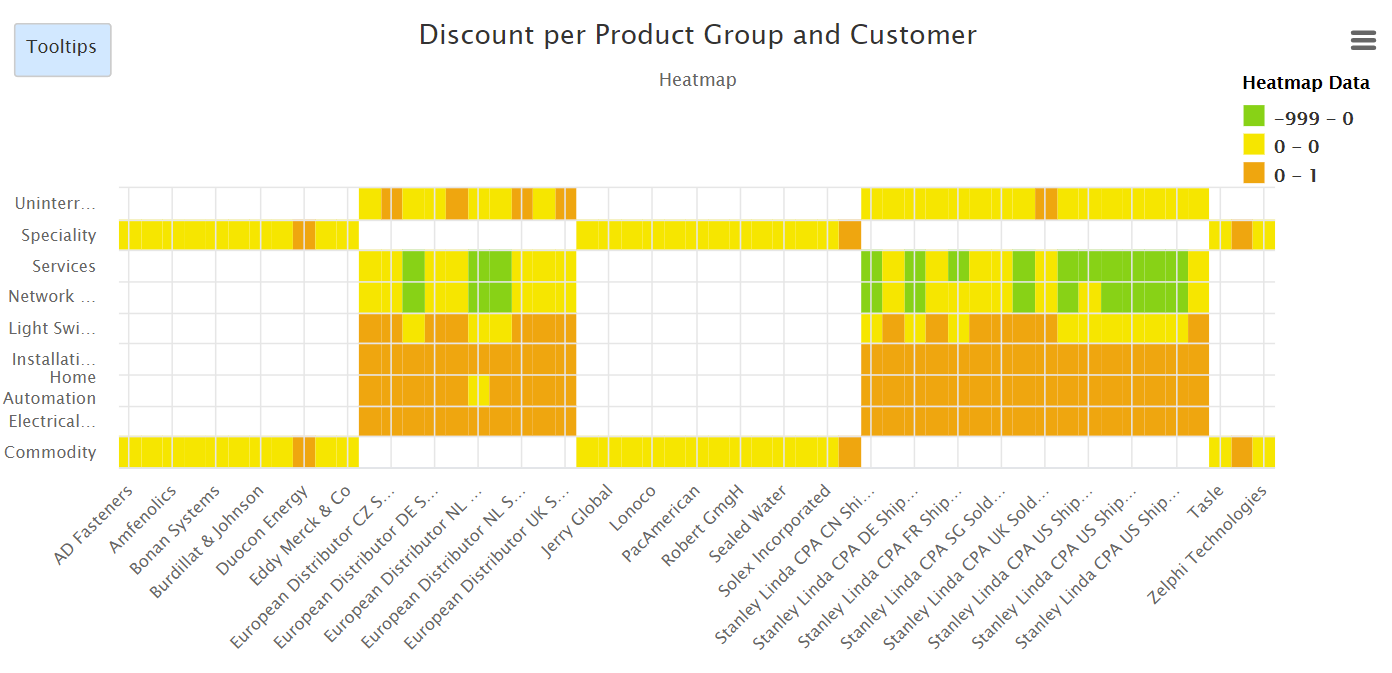
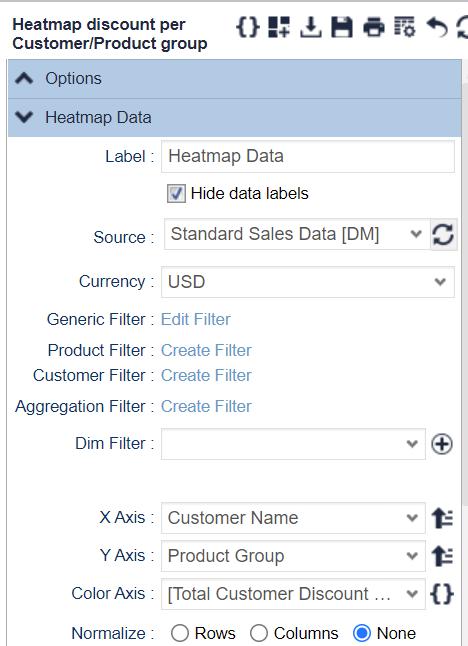
1. Heatmap: Discount per Product Group and Customer
def chart = api.newChartBuilder()
	.newHeatmap()
		.getOptions()
			.setTitle('Discount per Product Group and Customer')
			.setHideLegend(false)
			.setHideTooltips(false)
			.setSubtitle('Heatmap')
			.setColorAxisType(ColorAxisType.RANGED)
			.withInterpolatedColorAxis()
				.addStop('#EFEFFF', 0)
				.addStop('#003875', 100)
				.back()
			.withRangedColorAxis()
				.addRange('#7ed321', -999, 0.25)
				.addRange('#f8e71c', 0.25, 0.4)
				.addRange('#f5a623', 0.4, 1)
				.back()
			.back()
		.getSeries()
			.setLabel('Heatmap Data')
			.setHideDataLabels(true)
			.setDatamart('DM.Standard_Sales_Data')
			.setCurrency('USD')
			.addFilters(FilterOperator.AND)
				.addFilter('Classification', null, 'A')
				.back()
			.setAxisX('CustomerName')
			.setAxisY('ProductGroup')
			.setColorAxis('[Total Customer Discount Percentage]')
				.withExpression()
					.setExpression('((sum(VolumeDiscounts)+sum(SalesChannelDiscount)+sum(PromotionDiscount)+sum(CompetitorDiscount)+sum(CustomerNegotiatedDiscount))/sum(InvoicePrice))')
					.setDescription('[Total Customer Discount Percentage]')
					.back()
				.back()
			.withSortByAxisX(SortType.ASCENDING)
			.withSortByAxisY(SortType.ASCENDING)
			.setGeneratedQueryDto('{"datamart":"DM.Standard_Sales_Data","source":"DM.Standard_Sales_Data","name":null,"label":"Heatmap Data","rollup":true,"projections":{"x":{"alias":"x","label":"Customer Name","expression":"CustomerName","format":null},"y":{"alias":"y","label":"Product Group","expression":"ProductGroup","format":null},"z":{"alias":"z","label":"Gross Margin %","expression":"((sum(VolumeDiscounts)+sum(SalesChannelDiscount)+sum(PromotionDiscount)+sum(CompetitorDiscount)+sum(CustomerNegotiatedDiscount))/sum(InvoicePrice))","format":null,"name":"[Total Customer Discount Percentage]","advancedProjection":true,"function":null,"default":null,"formatString":"Total Customer Discount Percentage","parameters":{"field":"[Total Customer Discount Percentage]","quantity":"Quantity","base":"InvoicePrice"}}},"filter":{"_constructor":"AdvancedCriteria","operator":"and","criteria":[{"fieldName":"Classification","operator":"iEquals","value":"A"}]},"aggregateFilter":null,"sortBy":[],"options":{"currency":"USD","distinctValues":["x","y"]}}')
			.back()
		.getDictionary()
			.buildFromOpaqueString('[{"sectionIdx":1,"category":"PROJECTION","categoryLabel":"Projection","defaultValue":"Total Customer Discount Percentage","key":"z","keyLabel":"Color Axis","sectionLabel":"Heatmap Data","format":" % ","value":"Gross Margin %"},{"sectionIdx":1,"category":"PROJECTION","categoryLabel":"Projection","defaultValue":"Customer Name","field":{"name":"CustomerName","label":"Customer Name","rank":59,"sourceField":"CustomerName","expression":"CustomerName","numeric":false,"key":false,"time":false,"persisted":true,"auxiliary":false,"deployed":true,"dimension":true,"calculated":false,"queryable":true,"aggregation":false,"deleted":false,"system":false,"type":"TEXT","source":"DMDS.Customer","owningFC":"Customer"},"key":"x","keyLabel":"X Axis","sectionLabel":"Heatmap Data"},{"sectionIdx":1,"category":"PROJECTION","categoryLabel":"Projection","defaultValue":"Product Group","field":{"name":"ProductGroup","label":"Product Group","rank":44,"sourceField":"ProductGroup","expression":"ProductGroup","numeric":false,"key":false,"time":false,"persisted":true,"auxiliary":false,"deployed":true,"dimension":true,"calculated":false,"queryable":true,"aggregation":false,"deleted":false,"system":false,"type":"TEXT","source":"DMDS.Product","owningFC":"Product"},"key":"y","keyLabel":"Y Axis","sectionLabel":"Heatmap Data"}]')
			.back()
		.build()
It is configured like this:
To be configured:
-
Field for customer name → mapping
-
Field for product group → Filter field
-
Default filters
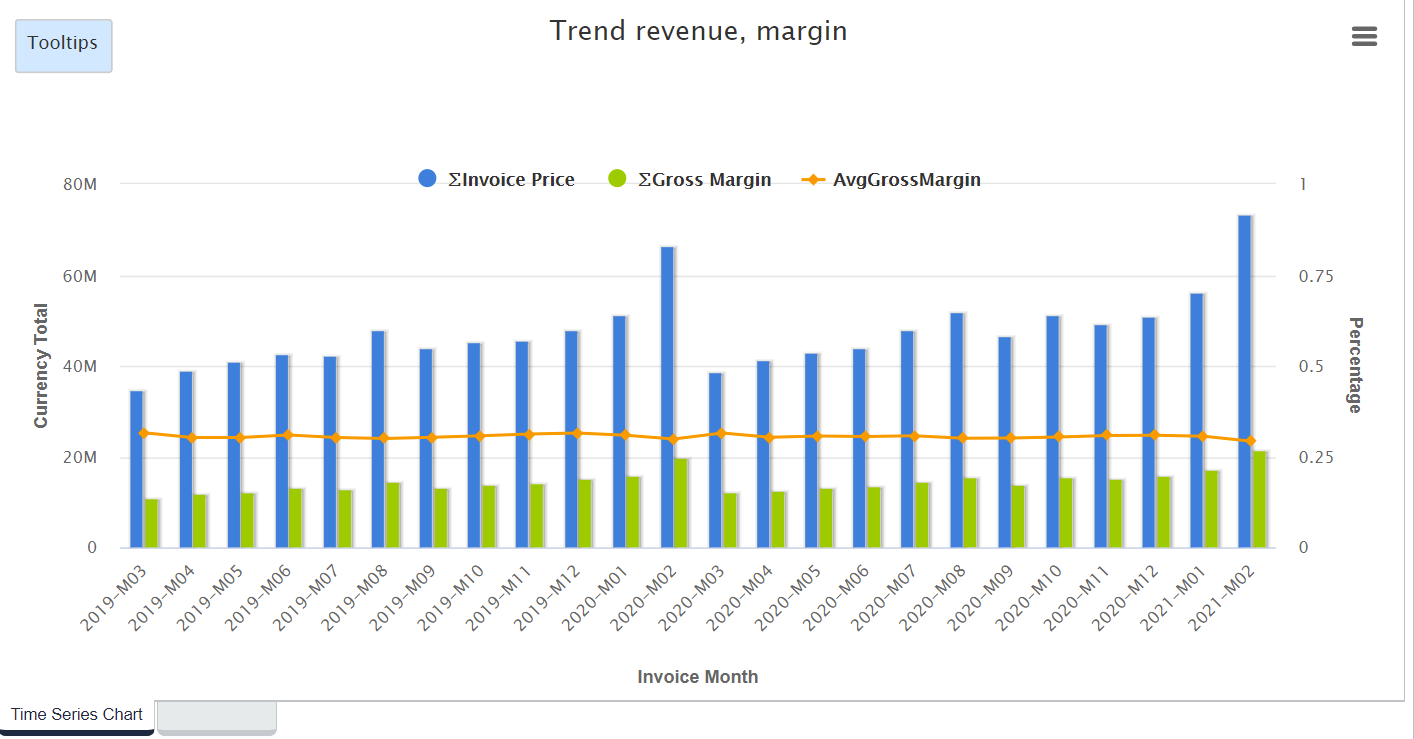
2. Trend Revenue and Margin
def chart = api.newChartBuilder()
	.newTimeSeries()
		.getOptions()
			.setTitle('Trend revenue, margin')
			.setSubtitle('')
			.setHideLegend(false)
			.setHideTooltips(false)
			.setXLabel('Invoice Month')
			.setYLabel('Currency Total')
			.setLegacyComparisonMode(true)
			.setShowZAxis(true)
			.setZLabel('Percentage')
			.setZMin(0)
			.setZMax(1)
			.setBoxplotAxisLabel('Box Plot')
			.back()
		.addSeries()
			.setHideDataLabels(true)
			.setDatamart('DM.Standard_Sales_Data')
			.setCurrency('EUR')
			.addFilters(FilterOperator.AND)
				.addFilter('Quantity', FilterOperator.GREATER_THAN, 0.01)
				.addFilter('InvoicePrice', FilterOperator.GREATER_THAN, 0.01)
				.addFilter('GrossMarginPct', FilterOperator.GREATER_THAN_OR_EQUAL_TO, -0.1)
				.addFilter('GrossMarginPct', FilterOperator.LESS_THAN_OR_EQUAL_TO, 1)
				.back()
			.setAxisX('PricingDateMonth')
			.setAxisY('InvoicePrice')
				.withTotal()
				.back()
			.setType(SeriesType.BAR)
			.setShowBoxplot(false)
			.setBoxplotAxis()
				.withField()
				.back()
			.setWhisker(WhiskerType.MIN_MAX)
			.addAdditionalMeasure()
				.setMeasure('GrossMargin')
				.setId(1)
				.setType(SeriesType.BAR)
				.setOnZAxis(false)
				.withTotal()
				.withBoxplotField()
				.back()
			.addAdditionalMeasure()
				.setMeasure('GrossMargin')
				.setId(2)
				.setType(SeriesType.LINE)
				.setOnZAxis(true)
				.withExpression()
					.setExpression('SUM(GrossMargin)/SUM(InvoicePrice)')
					.setDescription('AvgGrossMargin')
					.back()
				.withBoxplotField()
				.back()
			.setGeneratedQueryDto('{"datamart":"DM.Standard_Sales_Data","source":"DM.Standard_Sales_Data","name":null,"label":null,"rollup":true,"projections":{"x":{"alias":"x","label":"Pricing Date Month","expression":"PricingDateMonth","format":null},"y":{"alias":"y","label":"∑Invoice Price","expression":"SUM({field})","format":null,"name":"InvoicePrice","advancedProjection":true,"function":null,"default":null,"formatString":"∑{field}","parameters":{"field":"InvoicePrice","quantity":"Quantity","base":"InvoicePrice"}},"m1":{"alias":"m1","label":"∑Gross Margin","expression":"SUM({field})","format":null,"name":"GrossMargin","advancedProjection":true,"function":null,"default":null,"formatString":"∑{field}","parameters":{"field":"GrossMargin","quantity":"Quantity","base":"InvoicePrice"}},"m2":{"alias":"m2","label":"AvgGrossMargin","expression":"SUM(GrossMargin)/SUM(InvoicePrice)","format":null,"name":"GrossMargin","advancedProjection":true,"function":null,"default":null,"formatString":"AvgGrossMargin","parameters":{"field":"GrossMargin","quantity":"Quantity","base":"InvoicePrice"}}},"filter":{"_constructor":"AdvancedCriteria","operator":"and","criteria":[{"fieldName":"Quantity","operator":"greaterThan","value":0.01},{"fieldName":"InvoicePrice","operator":"greaterThan","value":0.01},{"operator":"betweenInclusive","fieldName":"GrossMarginPct","start":-0.1,"end":1}]},"aggregateFilter":null,"sortBy":["x"],"options":{"currency":"EUR","regression":["y","x"]}}')
			.back()
		.getDictionary()
			.buildFromOpaqueString('[{"sectionIdx":1,"category":"PROJECTION","key":"m1","sectionLabel":null,"categoryLabel":"Projection","keyLabel":"Measure 1","defaultValue":"∑Gross Margin"},{"sectionIdx":1,"category":"PROJECTION","key":"m2","sectionLabel":null,"categoryLabel":"Projection","keyLabel":"Measure 2","defaultValue":"AvgGrossMargin"},{"sectionIdx":1,"category":"PROJECTION","key":"x","sectionLabel":null,"categoryLabel":"Projection","keyLabel":"X Axis","defaultValue":"Pricing Date Month"},{"sectionIdx":1,"category":"PROJECTION","key":"y","sectionLabel":null,"categoryLabel":"Projection","keyLabel":"Y Axis","defaultValue":"∑Invoice Price"},{"sectionIdx":1,"category":"PROJECTION","key":"bplot_y","sectionLabel":null,"categoryLabel":"Projection","keyLabel":"Y Axis (Box Plot Chart)","defaultValue":"Invoice Price"}]')
			.back()
		.build()
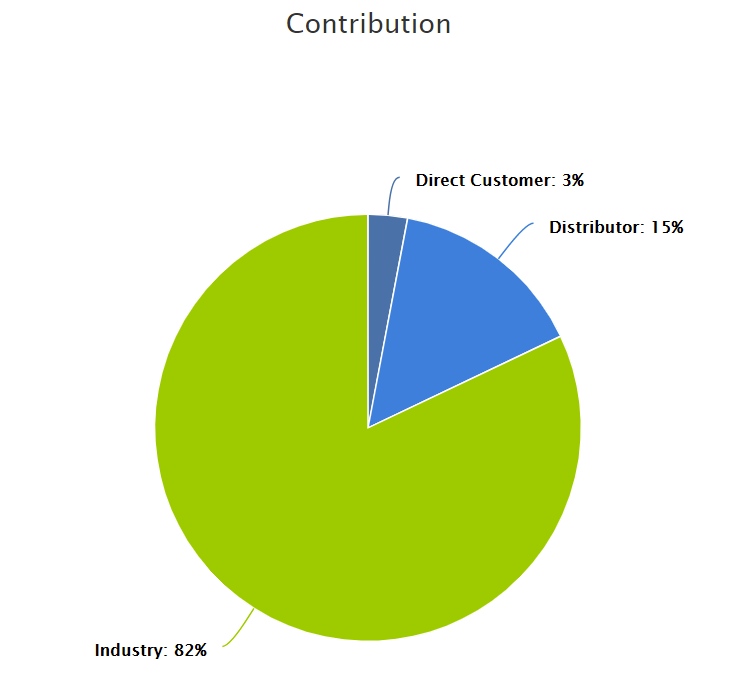
3. Contribution
def chart = api.newChartBuilder()
	.newPie()
		.getOptions()
			.setTitle('Contribution')
			.setHideLegend(false)
			.setHideTooltips(false)
			.setSubtitle('')
			.setVerticalLayout(false)
			.back()
		.addSeries()
			.setHideDataLabels(false)
			.setDatamart('DM.Standard_Sales_Data')
			.setCurrency('EUR')
			.addFilters(FilterOperator.AND)
				.addFilter('Quantity', FilterOperator.GREATER_THAN, 0.01)
				.addFilter('InvoicePrice', FilterOperator.GREATER_THAN, 0.01)
				.addFilter('GrossMarginPct', FilterOperator.GREATER_THAN_OR_EQUAL_TO, -0.1)
				.addFilter('GrossMarginPct', FilterOperator.LESS_THAN_OR_EQUAL_TO, 1)
				.back()
			.setHideOther(false)
			.setCategories('Customertype')
			.setSize('InvoicePrice')
				.withTotal()
				.back()
			.withSortBySize(SortType.ASCENDING)
			.setGeneratedQueryDto('{"datamart":"DM.Standard_Sales_Data","source":"DM.Standard_Sales_Data","name":null,"label":null,"rollup":true,"projections":{"x":{"alias":"x","label":"Customer type","expression":"Customertype","format":null},"y":{"alias":"y","label":"∑Invoice Price","expression":"SUM({field})","format":null,"name":"InvoicePrice","advancedProjection":true,"function":null,"default":null,"formatString":"∑{field}","parameters":{"field":"InvoicePrice","quantity":"Quantity","base":"InvoicePrice"}}},"filter":{"_constructor":"AdvancedCriteria","operator":"and","criteria":[{"fieldName":"Quantity","operator":"greaterThan","value":0.01},{"fieldName":"InvoicePrice","operator":"greaterThan","value":0.01},{"operator":"betweenInclusive","fieldName":"GrossMarginPct","start":-0.1,"end":1}]},"aggregateFilter":null,"sortBy":["y"],"options":{"currency":"EUR","distribution":["y"]}}')
			.back()
		.getDictionary()
			.buildFromOpaqueString('[{"sectionIdx":1,"category":"PROJECTION","key":"x","sectionLabel":null,"categoryLabel":"Projection","keyLabel":"Categories","defaultValue":"Customer type"},{"sectionIdx":1,"category":"PROJECTION","key":"y","sectionLabel":null,"categoryLabel":"Projection","keyLabel":"Size","defaultValue":"∑Invoice Price"}]')
			.back()
		.build()
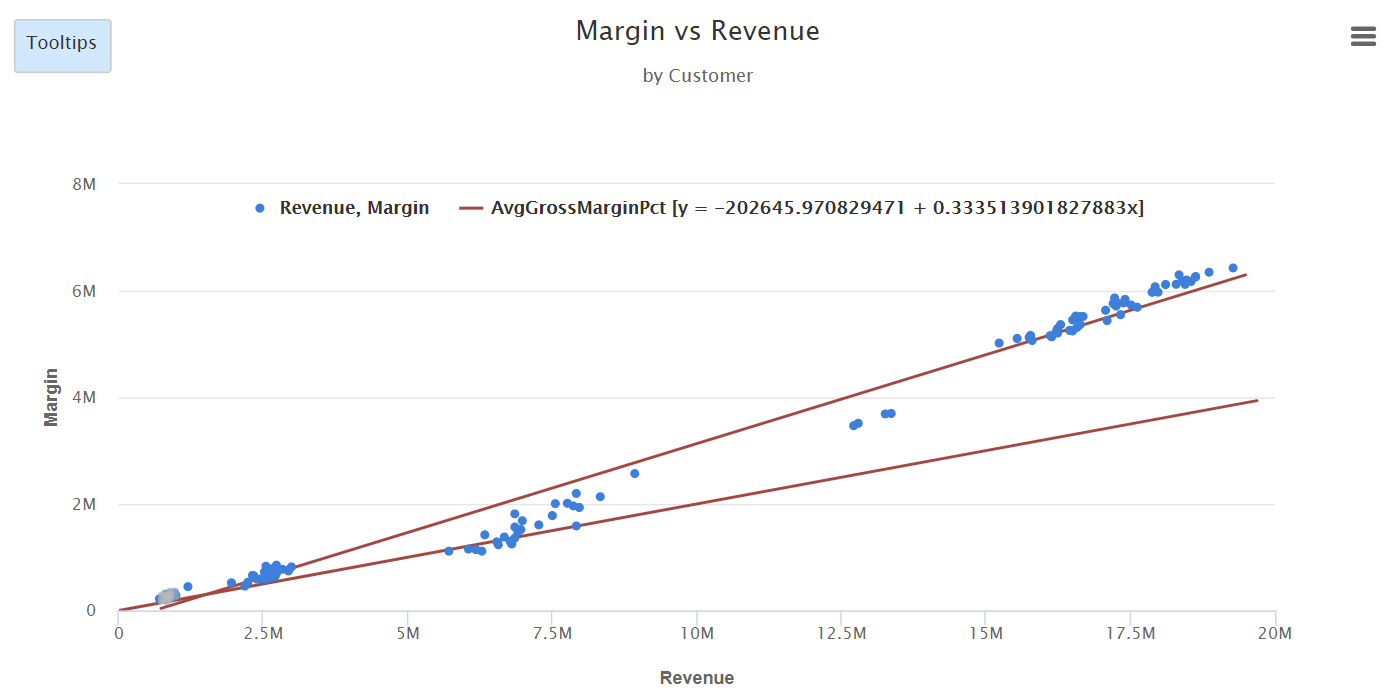
4. Margin vs. Revenue (By Customer)
def chart = api.newChartBuilder()
	.newScatter()
		.getOptions()
			.setTitle('Margin vs Revenue')
			.setHideLegend(false)
			.setHideTooltips(false)
			.setSubtitle('by Customer')
			.setXLabel('Revenue')
			.setYLabel('Margin')
			.setXMin(0)
			.setYMin(0)
			.setDiscretization(true)
			.back()
		.addSeries()
			.setLabel('Revenue, Margin')
			.setDatamart('DM.Standard_Sales_Data')
			.setCurrency('EUR')
			.addFilters(FilterOperator.AND)
				.addFilter('Quantity', FilterOperator.GREATER_THAN, 0.01)
				.addFilter('InvoicePrice', FilterOperator.GREATER_THAN, 0.01)
				.addFilter('GrossMarginPct', FilterOperator.GREATER_THAN_OR_EQUAL_TO, -0.1)
				.addFilter('GrossMarginPct', FilterOperator.LESS_THAN_OR_EQUAL_TO, 1)
				.back()
			.setAxisX('InvoicePrice')
				.withTotal()
				.back()
			.setAxisY('GrossMargin')
				.withTotal()
				.back()
			.setAggregationBy('CustomerId')
			.setShowBandByLegend(false)
			.withTrendLine()
				.setLabel('AvgGrossMarginPct')
				.setRegressionType('linear')
				.setShowInLegend(true)
				.setHideDataLabels(true)
				.setColor(AuxLineColor.RED)
				.back()
			.setGeneratedQueryDto('{"datamart":"DM.Standard_Sales_Data","source":"DM.Standard_Sales_Data","name":null,"label":"Revenue, Margin","rollup":true,"projections":{"x":{"alias":"x","label":"∑Invoice Price","expression":"SUM({field})","format":null,"name":"InvoicePrice","advancedProjection":true,"function":null,"default":null,"formatString":"∑{field}","parameters":{"field":"InvoicePrice","quantity":"Quantity","base":"InvoicePrice"}},"y":{"alias":"y","label":"∑Gross Margin","expression":"SUM({field})","format":null,"name":"GrossMargin","advancedProjection":true,"function":null,"default":null,"formatString":"∑{field}","parameters":{"field":"GrossMargin","quantity":"Quantity","base":"InvoicePrice"}},"groupBy":{"alias":"groupBy","label":"Customer Id","expression":"CustomerId","format":null}},"filter":{"_constructor":"AdvancedCriteria","operator":"and","criteria":[{"fieldName":"Quantity","operator":"greaterThan","value":0.01},{"fieldName":"InvoicePrice","operator":"greaterThan","value":0.01},{"operator":"betweenInclusive","fieldName":"GrossMarginPct","start":-0.1,"end":1}]},"aggregateFilter":null,"sortBy":[],"options":{"currency":"EUR","discretization":["x","y"],"distribution":["x","y"],"regression":["y","x"]}}')
			.back()
		.addAuxLine()
			.setLabel('AvgMarginPct')
			.setShowInLegend(false)
			.setHideDataLabels(true)
			.withLine()
				.setSteepness('0.2')
				.setYIntercept('0')
				.back()
			.setColor(AuxLineColor.RED)
			.back()
		.getDictionary()
			.buildFromOpaqueString('[{"sectionIdx":1,"category":"PROJECTION","key":"bandBy","sectionLabel":null,"categoryLabel":"Projection","keyLabel":"Band By","defaultValue":"Customer type"},{"sectionIdx":1,"category":"AUX_LINE","key":"trendLine1","sectionLabel":"AvgGrossMarginPct","categoryLabel":"Auxiliary line","keyLabel":"trendLine1","defaultValue":"AvgGrossMarginPct"},{"sectionIdx":1,"category":"AUX_LINE","key":"AuxLine1","sectionLabel":"AvgMarginPct","categoryLabel":"Auxiliary line","keyLabel":"AuxLine1","defaultValue":"AvgMarginPct"},{"sectionIdx":1,"category":"PROJECTION","key":"groupBy","sectionLabel":"Revenue, Margin","categoryLabel":"Projection","keyLabel":"Aggregation By","defaultValue":"Customer Id"},{"sectionIdx":1,"category":"PROJECTION","key":"x","sectionLabel":"Revenue, Margin","categoryLabel":"Projection","keyLabel":"X Axis","defaultValue":"∑Invoice Price"},{"sectionIdx":1,"category":"PROJECTION","key":"y","sectionLabel":"Revenue, Margin","categoryLabel":"Projection","keyLabel":"Y Axis","defaultValue":"∑Gross Margin"}]')
			.back()
		.build()
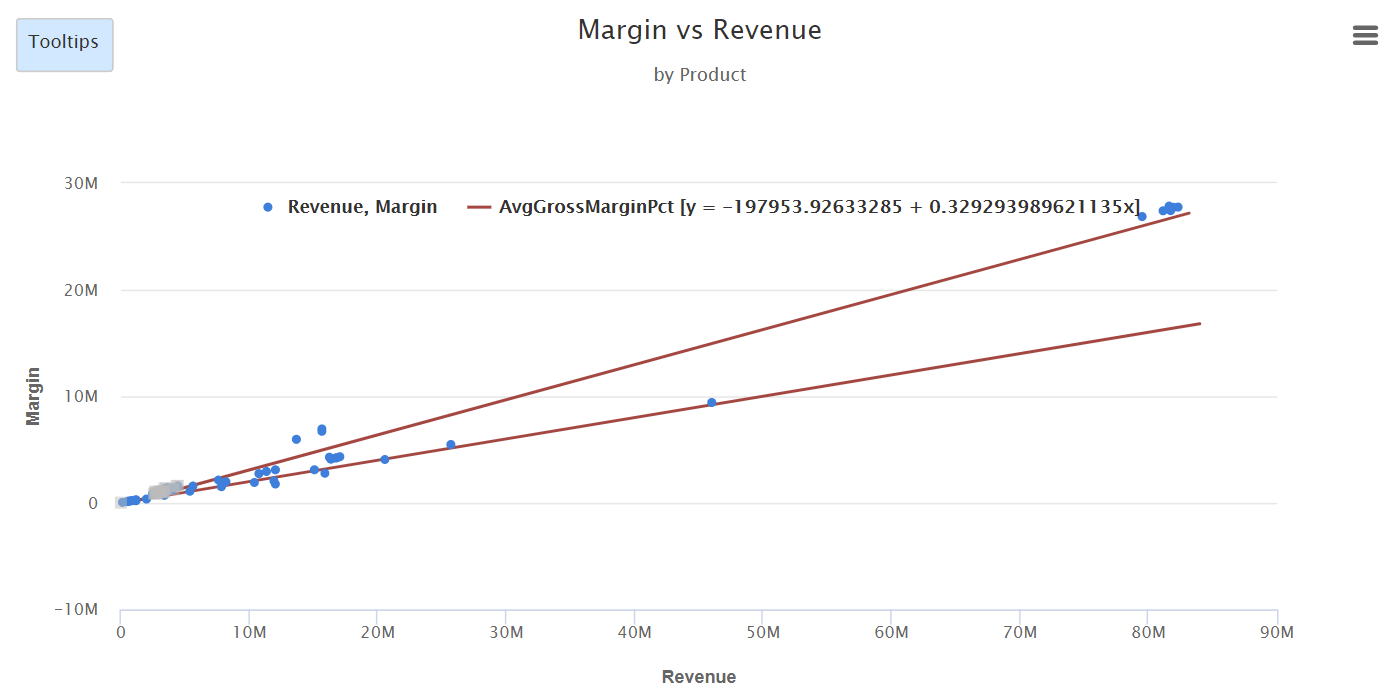
5. Margin vs. Revenue (By Product)
def chart = api.newChartBuilder()
	.newScatter()
		.getOptions()
			.setTitle('Margin vs Revenue')
			.setHideLegend(false)
			.setHideTooltips(false)
			.setSubtitle('by Product')
			.setXLabel('Revenue')
			.setYLabel('Margin')
			.setXMin(0)
			.setDiscretization(true)
			.back()
		.addSeries()
			.setLabel('Revenue, Margin')
			.setDatamart('DM.Standard_Sales_Data')
			.setCurrency('EUR')
			.addFilters(FilterOperator.AND)
				.addFilter('Quantity', FilterOperator.GREATER_THAN, 0.01)
				.addFilter('InvoicePrice', FilterOperator.GREATER_THAN, 0.01)
				.addFilter('GrossMarginPct', FilterOperator.GREATER_THAN_OR_EQUAL_TO, -0.1)
				.addFilter('GrossMarginPct', FilterOperator.LESS_THAN_OR_EQUAL_TO, 1)
				.back()
			.setAxisX('InvoicePrice')
				.withTotal()
				.back()
			.setAxisY('GrossMargin')
				.withTotal()
				.back()
			.setAggregationBy('ProductId')
			.setShowBandByLegend(false)
			.withTrendLine()
				.setLabel('AvgGrossMarginPct')
				.setRegressionType('linear')
				.setShowInLegend(true)
				.setHideDataLabels(true)
				.setColor(AuxLineColor.RED)
				.back()
			.setGeneratedQueryDto('{"datamart":"DM.Standard_Sales_Data","source":"DM.Standard_Sales_Data","name":null,"label":"Revenue, Margin","rollup":true,"projections":{"x":{"alias":"x","label":"∑Invoice Price","expression":"SUM({field})","format":null,"name":"InvoicePrice","advancedProjection":true,"function":null,"default":null,"formatString":"∑{field}","parameters":{"field":"InvoicePrice","quantity":"Quantity","base":"InvoicePrice"}},"y":{"alias":"y","label":"∑Gross Margin","expression":"SUM({field})","format":null,"name":"GrossMargin","advancedProjection":true,"function":null,"default":null,"formatString":"∑{field}","parameters":{"field":"GrossMargin","quantity":"Quantity","base":"InvoicePrice"}},"groupBy":{"alias":"groupBy","label":"Product Id","expression":"ProductId","format":null}},"filter":{"_constructor":"AdvancedCriteria","operator":"and","criteria":[{"fieldName":"Quantity","operator":"greaterThan","value":0.01},{"fieldName":"InvoicePrice","operator":"greaterThan","value":0.01},{"operator":"betweenInclusive","fieldName":"GrossMarginPct","start":-0.1,"end":1}]},"aggregateFilter":null,"sortBy":[],"options":{"currency":"EUR","discretization":["x","y"],"distribution":["x","y"],"regression":["y","x"]}}')
			.back()
		.addAuxLine()
			.setLabel('AvgMarginPct')
			.setShowInLegend(false)
			.setHideDataLabels(true)
			.withLine()
				.setSteepness('0.2')
				.setYIntercept('0')
				.back()
			.setColor(AuxLineColor.RED)
			.back()
		.getDictionary()
			.buildFromOpaqueString('[{"sectionIdx":1,"category":"PROJECTION","key":"bandBy","sectionLabel":null,"categoryLabel":"Projection","keyLabel":"Band By","defaultValue":"Customer type"},{"sectionIdx":1,"category":"AUX_LINE","key":"trendLine1","sectionLabel":"AvgGrossMarginPct","categoryLabel":"Auxiliary line","keyLabel":"trendLine1","defaultValue":"AvgGrossMarginPct"},{"sectionIdx":1,"category":"AUX_LINE","key":"AuxLine1","sectionLabel":"AvgMarginPct","categoryLabel":"Auxiliary line","keyLabel":"AuxLine1","defaultValue":"AvgMarginPct"},{"sectionIdx":1,"category":"PROJECTION","key":"groupBy","sectionLabel":"Revenue, Margin","categoryLabel":"Projection","keyLabel":"Aggregation By","defaultValue":"Product Id"},{"sectionIdx":1,"category":"PROJECTION","key":"x","sectionLabel":"Revenue, Margin","categoryLabel":"Projection","keyLabel":"X Axis","defaultValue":"∑Invoice Price"},{"sectionIdx":1,"category":"PROJECTION","key":"y","sectionLabel":"Revenue, Margin","categoryLabel":"Projection","keyLabel":"Y Axis","defaultValue":"∑Gross Margin"}]')
			.back()
		.build()
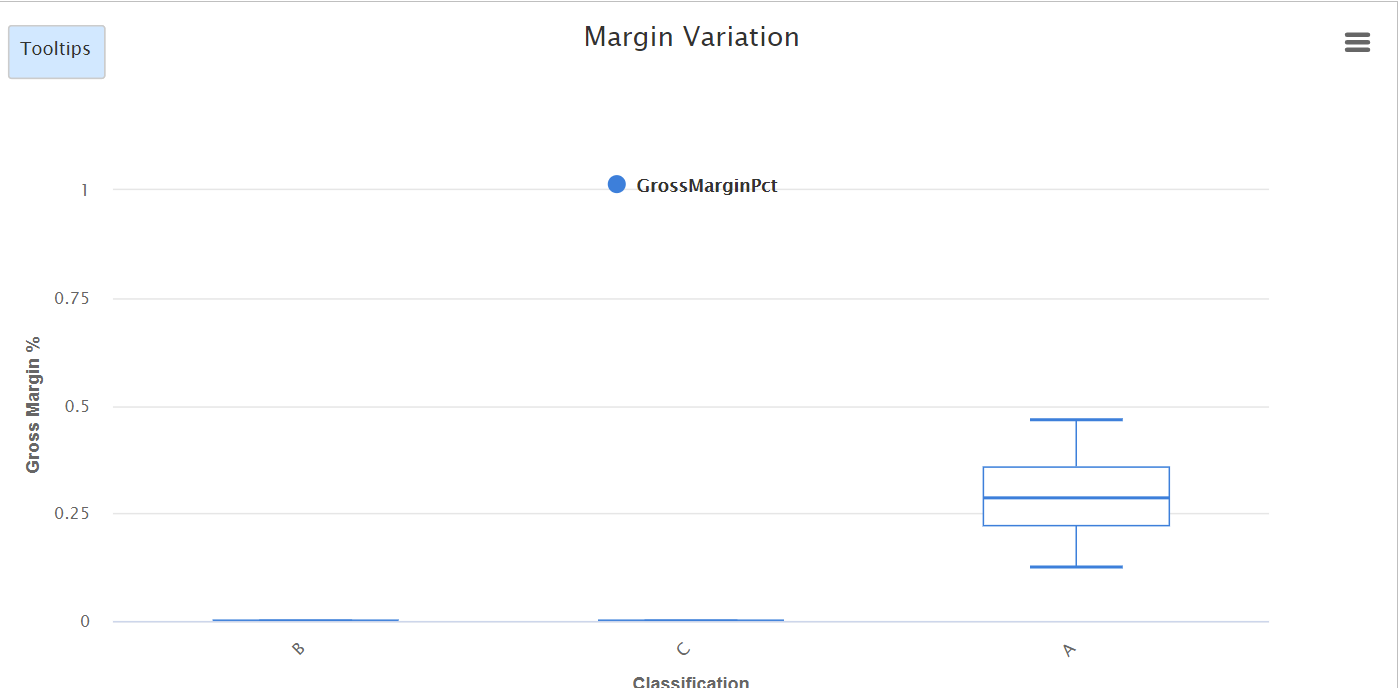
6. Margin Variation
def chart = api.newChartBuilder()
	.newBoxplot()
		.getOptions()
			.setTitle('Margin Variation')
			.setHideLegend(false)
			.setHideTooltips(false)
			.setSubtitle('')
			.setComparison(true)
			.setYLabel('Gross Margin %')
			.setMaxDataPoints(0)
			.setYMin(0)
			.setYMax(1)
			.setShowZAxis(false)
			.setZLabel('Other')
			.back()
		.addSeries()
			.setDatamart('DM.Standard_Sales_Data')
			.setCurrency('EUR')
			.addFilters(FilterOperator.AND)
				.addFilter('Quantity', FilterOperator.GREATER_THAN, 0.01)
				.addFilter('InvoicePrice', FilterOperator.GREATER_THAN, 0.01)
				.addFilter('GrossMarginPct', FilterOperator.GREATER_THAN_OR_EQUAL_TO, -0.1)
				.addFilter('GrossMarginPct', FilterOperator.LESS_THAN_OR_EQUAL_TO, 1)
				.back()
			.setAxisX('Classification')
			.setAxisY('GrossMarginPct')
				.withField()
				.back()
			.withSortByAxisY(SortType.ASCENDING)
			.withWhisker(WhiskerType.P_05_95TH)
			.setGeneratedQueryDto('{"datamart":"DM.Standard_Sales_Data","source":"DM.Standard_Sales_Data","name":null,"label":null,"rollup":true,"projections":{"x":{"alias":"x","label":"Classification","expression":"Classification","format":null},"y":{"alias":"y","label":"GrossMarginPct","expression":"{field}","format":null,"name":"GrossMarginPct","advancedProjection":true,"function":"Field","default":null,"formatString":"{field}","parameters":{"field":"GrossMarginPct"}}},"filter":{"_constructor":"AdvancedCriteria","operator":"and","criteria":[{"fieldName":"Quantity","operator":"greaterThan","value":0.01},{"fieldName":"InvoicePrice","operator":"greaterThan","value":0.01},{"operator":"betweenInclusive","fieldName":"GrossMarginPct","start":-0.1,"end":1}]},"aggregateFilter":null,"sortBy":["x"],"options":{"currency":"EUR","statistics":{"y":["q.25","q.5","q.75","q.05","q.95"]}}}')
			.back()
		.getDictionary()
			.buildFromOpaqueString('[{"sectionIdx":1,"category":"PROJECTION","key":"x","sectionLabel":null,"categoryLabel":"Projection","keyLabel":"X Axis","defaultValue":"Classification"},{"sectionIdx":1,"category":"PROJECTION","key":"y","sectionLabel":null,"categoryLabel":"Projection","keyLabel":"Y Axis","defaultValue":"GrossMarginPct"}]')
			.back()
		.build()
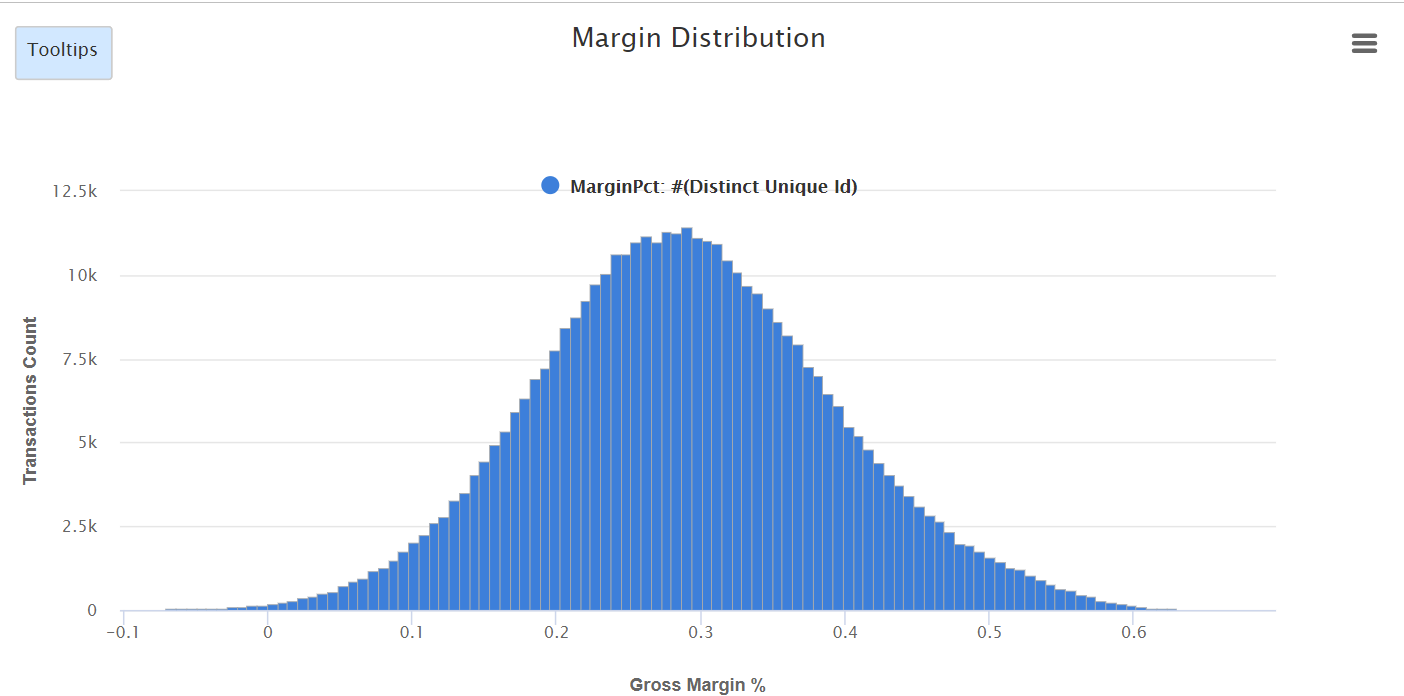
7. Margin Distribution
def chart = api.newChartBuilder()
	.newHistogram()
		.getOptions()
			.setTitle('Margin Distribution')
			.setSubtitle('')
			.setHideLegend(false)
			.setHideTooltips(false)
			.setXLabel('Gross Margin %')
			.setYLabel('Transactions Count')
			.setShowZAxis(false)
			.setZLabel('Other')
			.back()
		.getSeries()
			.setLabel('MarginPct')
			.setHideDataLabels(true)
			.setDatamart('DM.Standard_Sales_Data')
			.setCurrency('EUR')
			.addFilters(FilterOperator.AND)
				.addFilter('Quantity', FilterOperator.GREATER_THAN, 0.01)
				.addFilter('InvoicePrice', FilterOperator.GREATER_THAN, 0.01)
				.addFilter('GrossMarginPct', null, null)
				.back()
			.setAxisX('GrossMarginPct')
				.withTotal()
				.back()
			.setBins(110)
			.setAxisY('UniqueId')
			.withSortByAxisX(SortType.ASCENDING)
			.setGeneratedQueryDto('{"datamart":"DM.Standard_Sales_Data","source":"DM.Standard_Sales_Data","name":null,"label":"MarginPct","rollup":true,"projections":{"binLabel":{"alias":"binLabel","label":"∑GrossMarginPct","expression":null,"format":null},"binFreq":{"alias":"binFreq","label":"Count","expression":null,"format":null},"x":{"alias":"x","label":"∑GrossMarginPct","expression":"SUM({field})","format":null,"name":"GrossMarginPct","advancedProjection":true,"function":null,"default":null,"formatString":"∑{field}","parameters":{"field":"GrossMarginPct","quantity":"Quantity","base":"InvoicePrice"}},"y":{"alias":"y","label":"Unique Id","expression":"UniqueId","format":null}},"filter":{"_constructor":"AdvancedCriteria","operator":"and","criteria":[{"fieldName":"Quantity","operator":"greaterThan","value":0.01},{"fieldName":"InvoicePrice","operator":"greaterThan","value":0.01},{"operator":"between","fieldName":"GrossMarginPct","start":-0.1,"end":1}]},"aggregateFilter":null,"sortBy":["x"],"options":{"currency":"EUR","discretization":["x"],"distribution":["x"],"bins":110}}')
			.back()
		.getDictionary()
			.buildFromOpaqueString('[{"sectionIdx":1,"category":"PROJECTION","key":"y","sectionLabel":"MarginPct","categoryLabel":"Projection","keyLabel":"Aggregation By","defaultValue":"Unique Id"},{"sectionIdx":1,"category":"PROJECTION","key":"x","sectionLabel":"MarginPct","categoryLabel":"Projection","keyLabel":"X Axis","defaultValue":"∑GrossMarginPct"}]')
			.back()
		.build()