This step first optimizes the segments and the transactions in the scope of the model. The optimization is composed of two parts: the first one, optional, is the alignments of the segments; in the second part, the floor, target, and ceiling percentile values are applied to the source data to simulate the optimization strategy on the historical data. Once the calculations have run, six tabs are displayed. They provide different views on the optimization results. Last, but not least, two evaluations are available: they are ways to use the optimization results from any other part of the partition, such as Quotes, Price Lists etc.
Alignment and Optimization Calculations
When you arrive at the Results step from the Segmentation step, the model first runs the alignments of the segments, then the optimization calculation of each segment. It may take some minutes, depending on the size of the model. It is a sequence of six calculations, so the interface may display an advancement of n over six (it may be less, at the beginning of the process, or if no alignments are set).
First, an Optimization Engine is triggered, then change of the optimization target values (margin rate or discount rate) in order for some segments to be aligned with the gap defined previously. Then, the percentile values entered as the floor, target, and ceiling, are applied to the aligned optimization target values in each segment, with the defined strategy coefficients. Refer Segmentation Step (Optimization - Negotiation Guidance) | Selection Alignments and Segmentation Step (Optimization - Negotiation Guidance) | Optimization Setup for more details.
Impact Tab
This dashboard displays the optimization result for the strategy floor-target-ceiling. Refer to the paragraph Segmentation Step (Optimization - Negotiation Guidance) | How the Percentile Values Are Used? for more explanations.
The left panel allows you to choose the granularity of the bar charts and the overall realization dashboard.
-
Segmentation level – All the transactions of the scope are aggregated at this level to provide the bar charts of the projected revenue and profit. The global overview and the profit potential matrix are not impacted by this input value.
-
Overall Realization % – The optimization strategy is the best to have. You can simulate with this input the fact that only a certain percentage of the optimization target is reached. The value must be between 0 and 100 and will impact all the dashboard portlets.
Review Tab
This dashboard helps to review how the recommendations (Floor / Target / Ceiling) fit the historical transactions, by comparing where transactions fall relative to the guidance across segments and over time.
The left panel allows you to choose:
-
Segmentation level to explore - segmentation level used to group the analyses. If empty, the dashboard uses overall aggregation.
-
Specific value to detail - segmentation level value for more detailed analysis. When a value is selected, two additional charts are displayed with details for this selected value - Distribution of Transactions and Evolution over Time.
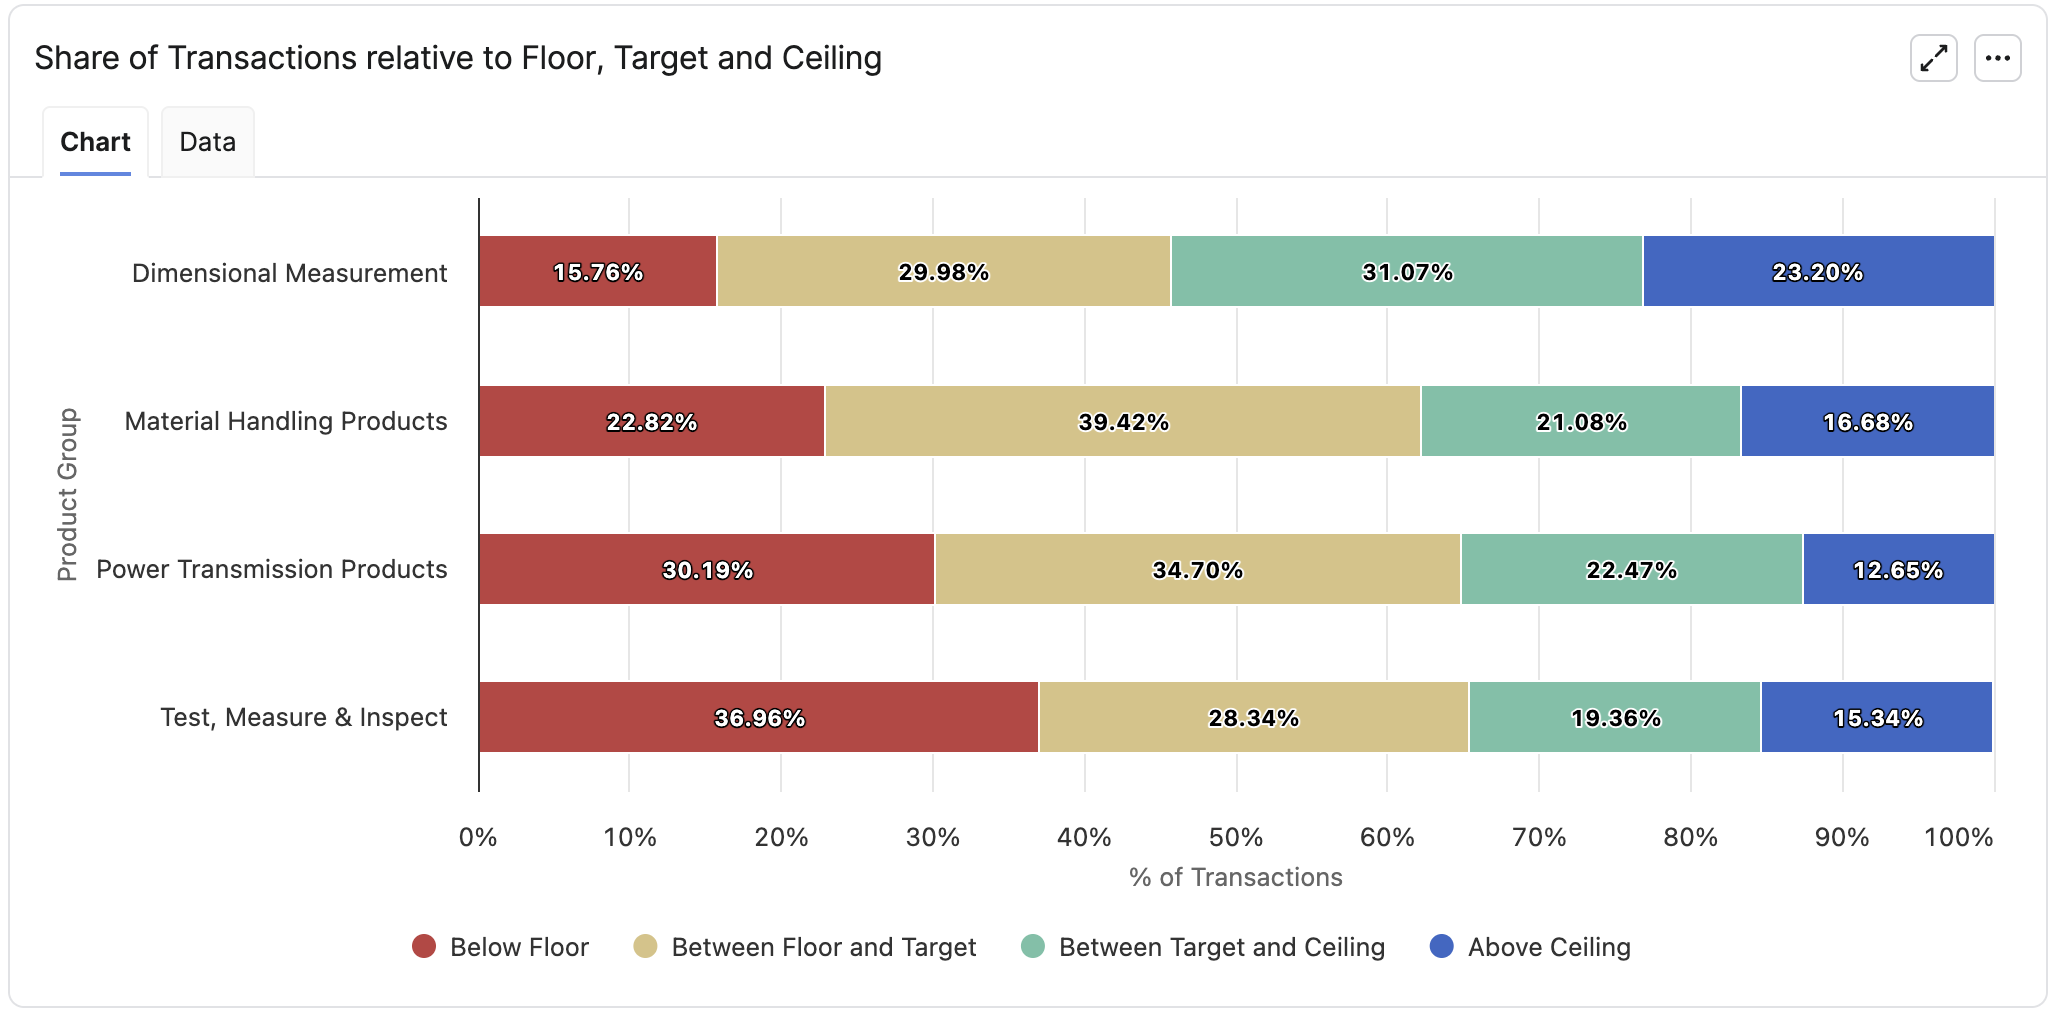
Share of Transactions relative to Floor, Target and Ceiling
This stacked 100% bar chart shows, for each value of the Segmentation level to explore, how historical transactions are distributed relative to the recommended Floor / Target / Ceiling. On the vertical axis, there are values of the selected segmentation level. The horizontal axis always displays 100% of transactions for that row, split into four categories: Below Floor, Between Floor and Target, Between Target and Ceiling and Above Ceiling.
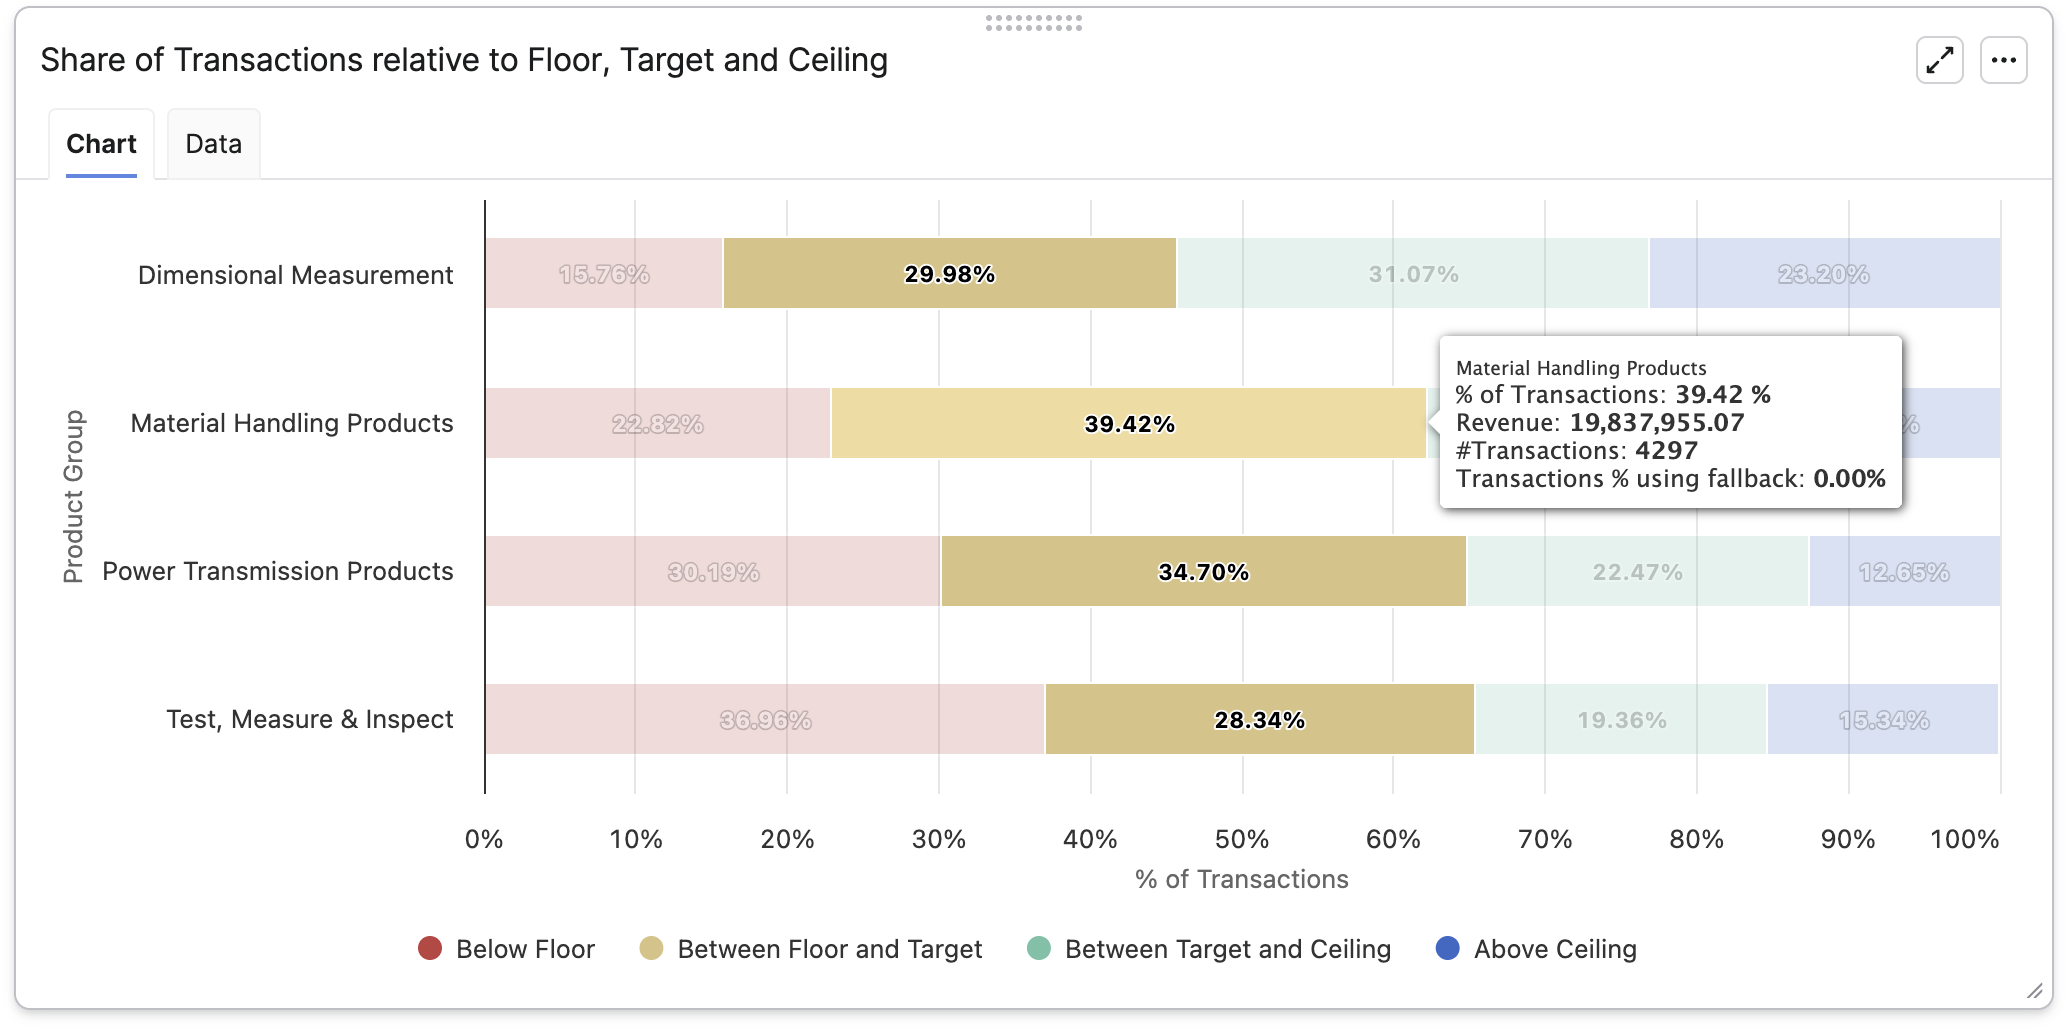
When you hover over a colored bucket of the bar, the tooltip summarizes the key metrics for that share bucket:
-
% of transactions: Percentage of historical transactions for the given segmentation value that fall into this share bucket.
-
Revenue: Total historical revenue of transactions in this share bucket.
-
#Transactions: Total count of transactions in this share bucket.
-
Transactions % using fallback – Among the transactions in this share bucket, the percentage that use a fallback segment at a higher level of the segmentation tree because they are not segmented at the selected Segmentation level to explore.
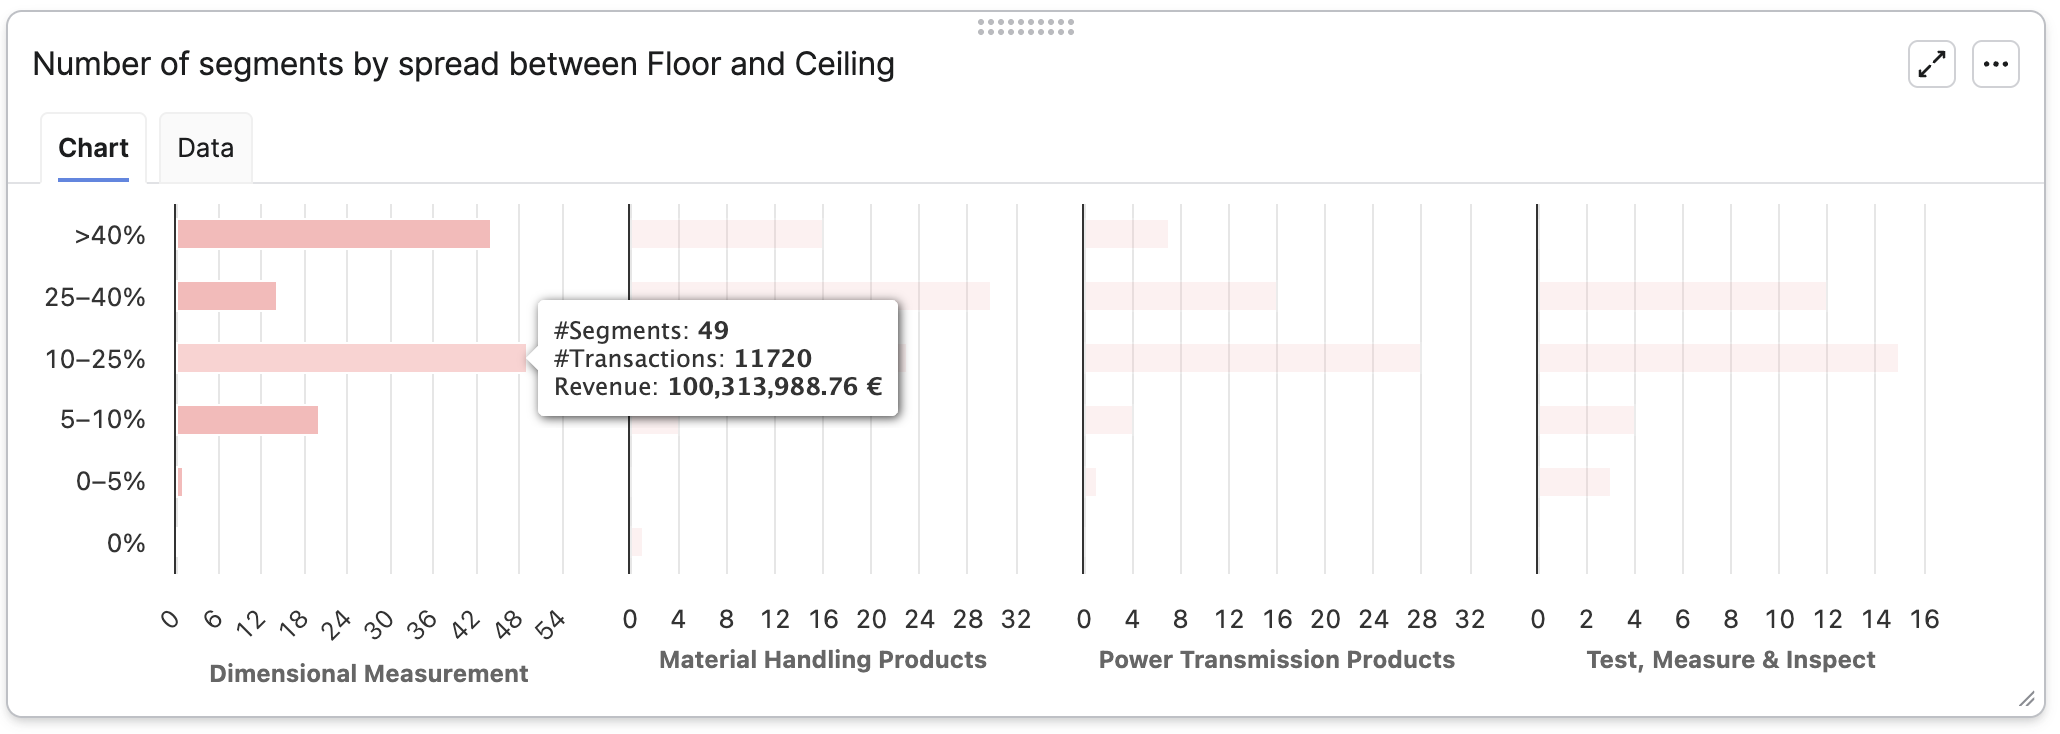
Number of segments by spread between Floor and Ceiling
This set of bar charts shows how wide the difference between Floor and Ceiling is across segments. There is a separate sub-chart for each value of the Segmentation level to explore. If there are more than 10 distinct values, all of them are aggregated into a single chart (note: the Data tab always lists all individual bucket values to support deeper analysis).
On the vertical axis, there are fixed spread buckets based on Ceiling – Floor (0%, 0-5%, 5-10%…). The horizontal axis shows number of segments in each bucket. For percentage metrics (Margin%, Discount%), the spread is directly Ceiling – Floor. For the other target types, the spread is first converted to a percentage of the overall average value.
Detailed Metrics
The Detailed Metrics table summarizes, for each value of Segmentation level to explore, how guidance compares to the history. Each row of the table corresponds to one distinct value of Segmentation level to explore and contains:
-
Segmentation value
-
# Transactions: Number of relevant transactions (with corresponding segmentation level value).
-
# Segments: Number of distinct segments across all relevant transactions.
-
Revenue: Sum of revenue across across all relevant transactions.
-
Profit: Sum of margin across all relevant transactions.
-
Quantity: Sum of quantity across all relevant transactions.
-
Current Average Optimization Target: Historical average of the optimization metric.
-
AVG Target: Weighted average of the optimized target metric.
-
AVG Floor: Weighted average of the floor value.
-
AVG Ceiling: Weighted average of the ceiling value.
-
AVG Floor–Ceiling Spread:
AVG Ceiling – AVG Floor -
Δ Current vs Target:
AVG Target – Current Average Optimization Target -
Standard Deviation: Pooled standard deviation of the segments that contribute to this value.
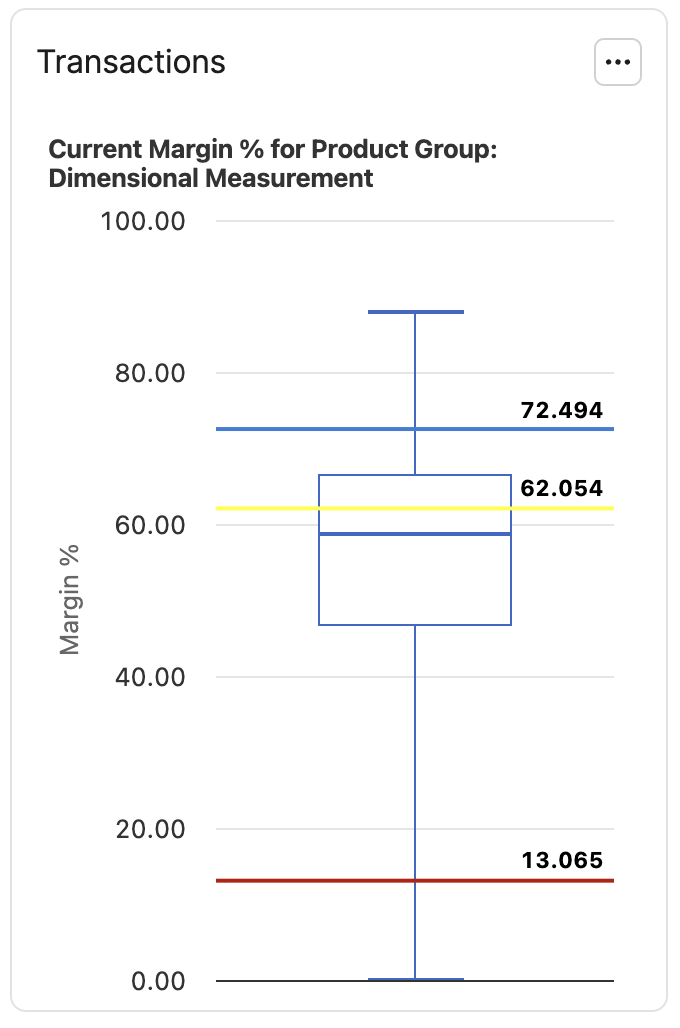
Transactions
When Specific value to detail is selected in the configurator, the Transactions portlet is displayed with a box plot of the historical optimization metric for the selected value of Segmentation level to explore. In addition, AVG Target, AVG Floor, and AVG Ceiling (as computed in the Detailed Metrics table) are drawn as horizontal reference lines.
Evolution over Time
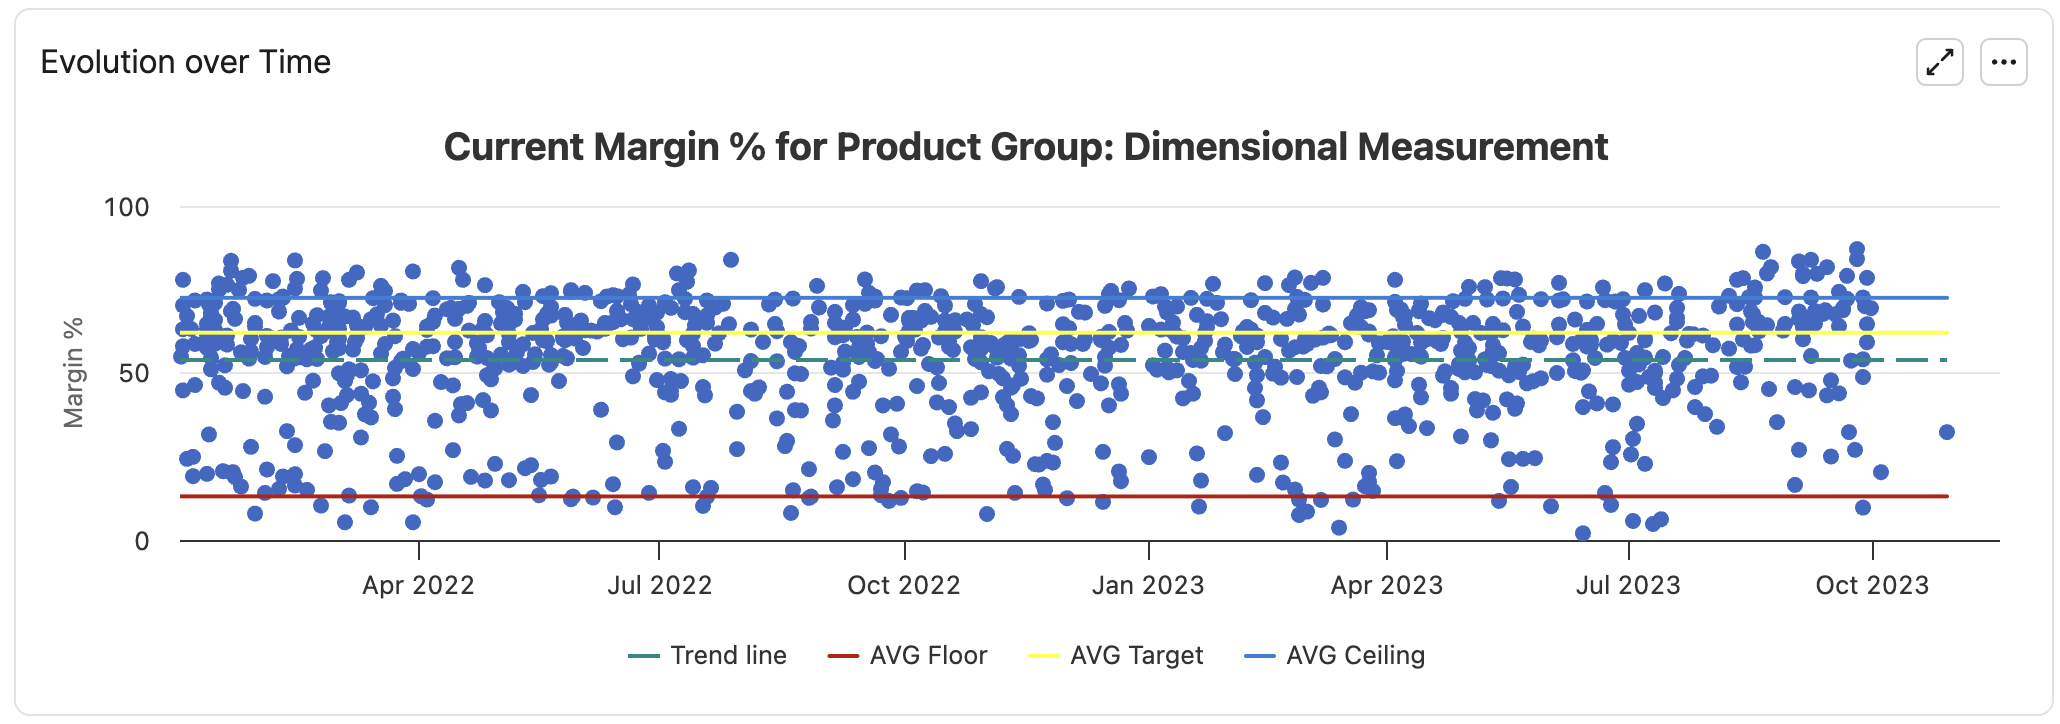
When Specific value to detail is selected in the configurator, the Evolution over Time portlet is displayed with a scatter plot of the optimization metric over time for transactions with selected value of Segmentation level to explore.
When Specific value to detail is selected in the configurator, the Evolution over Time portlet shows a scatter plot of the optimization metric over time, using transactions that match the Specific value to detail of Segmentation level to explore. A trend line is shown together with AVG Target, AVG Floor and AVG Ceiling (as computed in the Detailed Metrics table) as horizontal reference lines.
Note that number of data points in the scatter chart is limited to 1000 (randomly sampled).
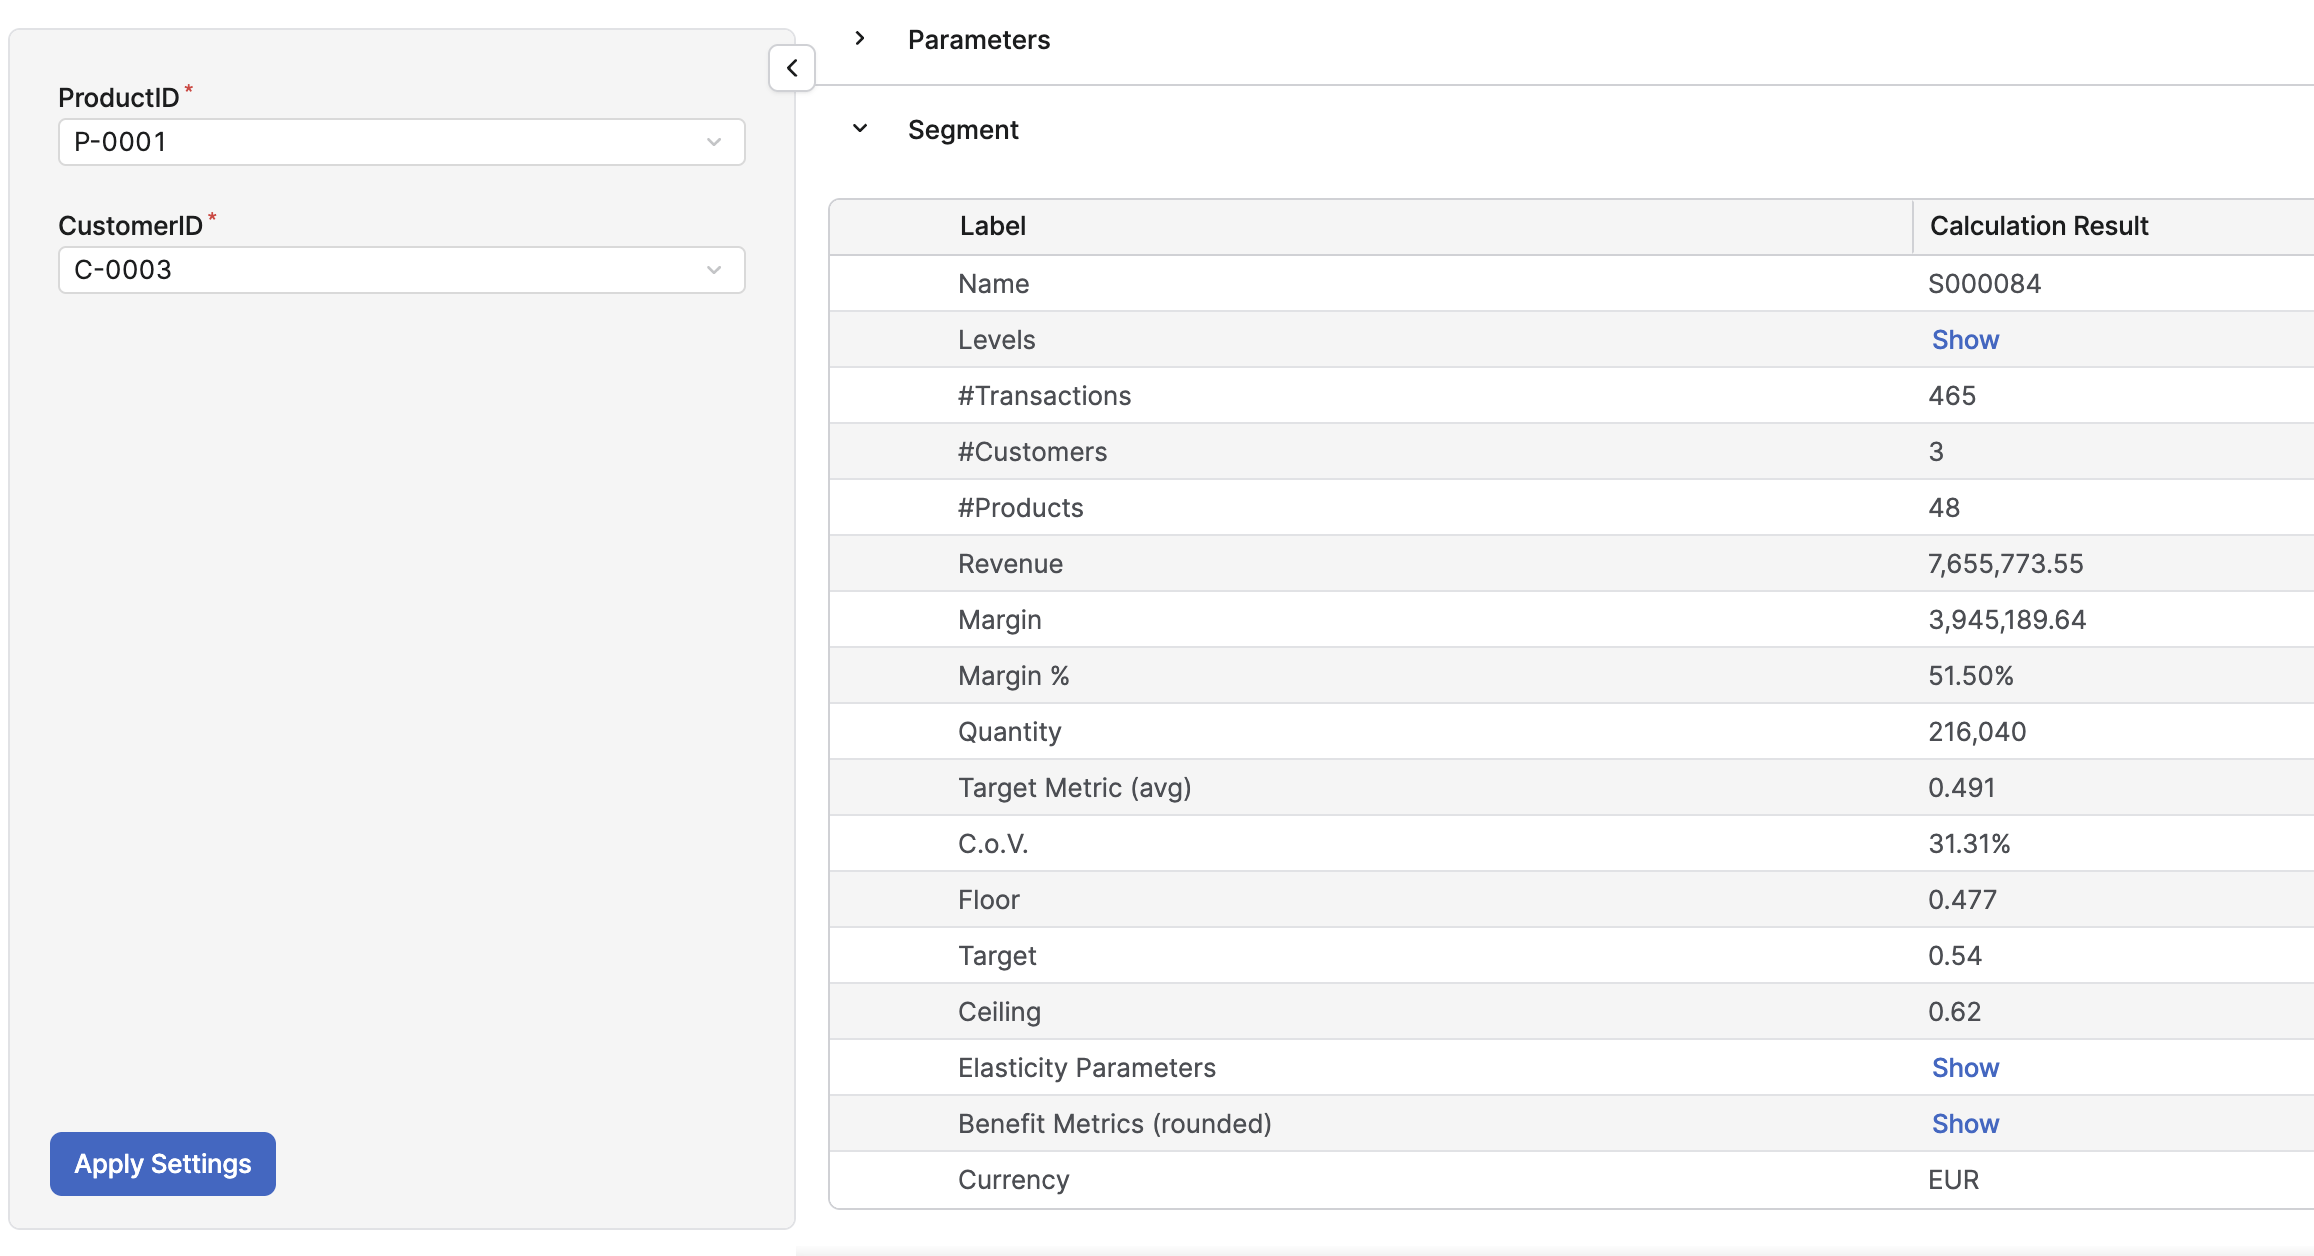
Tree View
This view is the same as Segmentation Step (Optimization - Negotiation Guidance) | Tree View but now more results are provided when clicking on a segment. The Price Recommendation section provides the score, target percentile, values of the optimization metric for the given percentiles, and projections of metrics based on the optimization strategy defined in the previous paragraph.
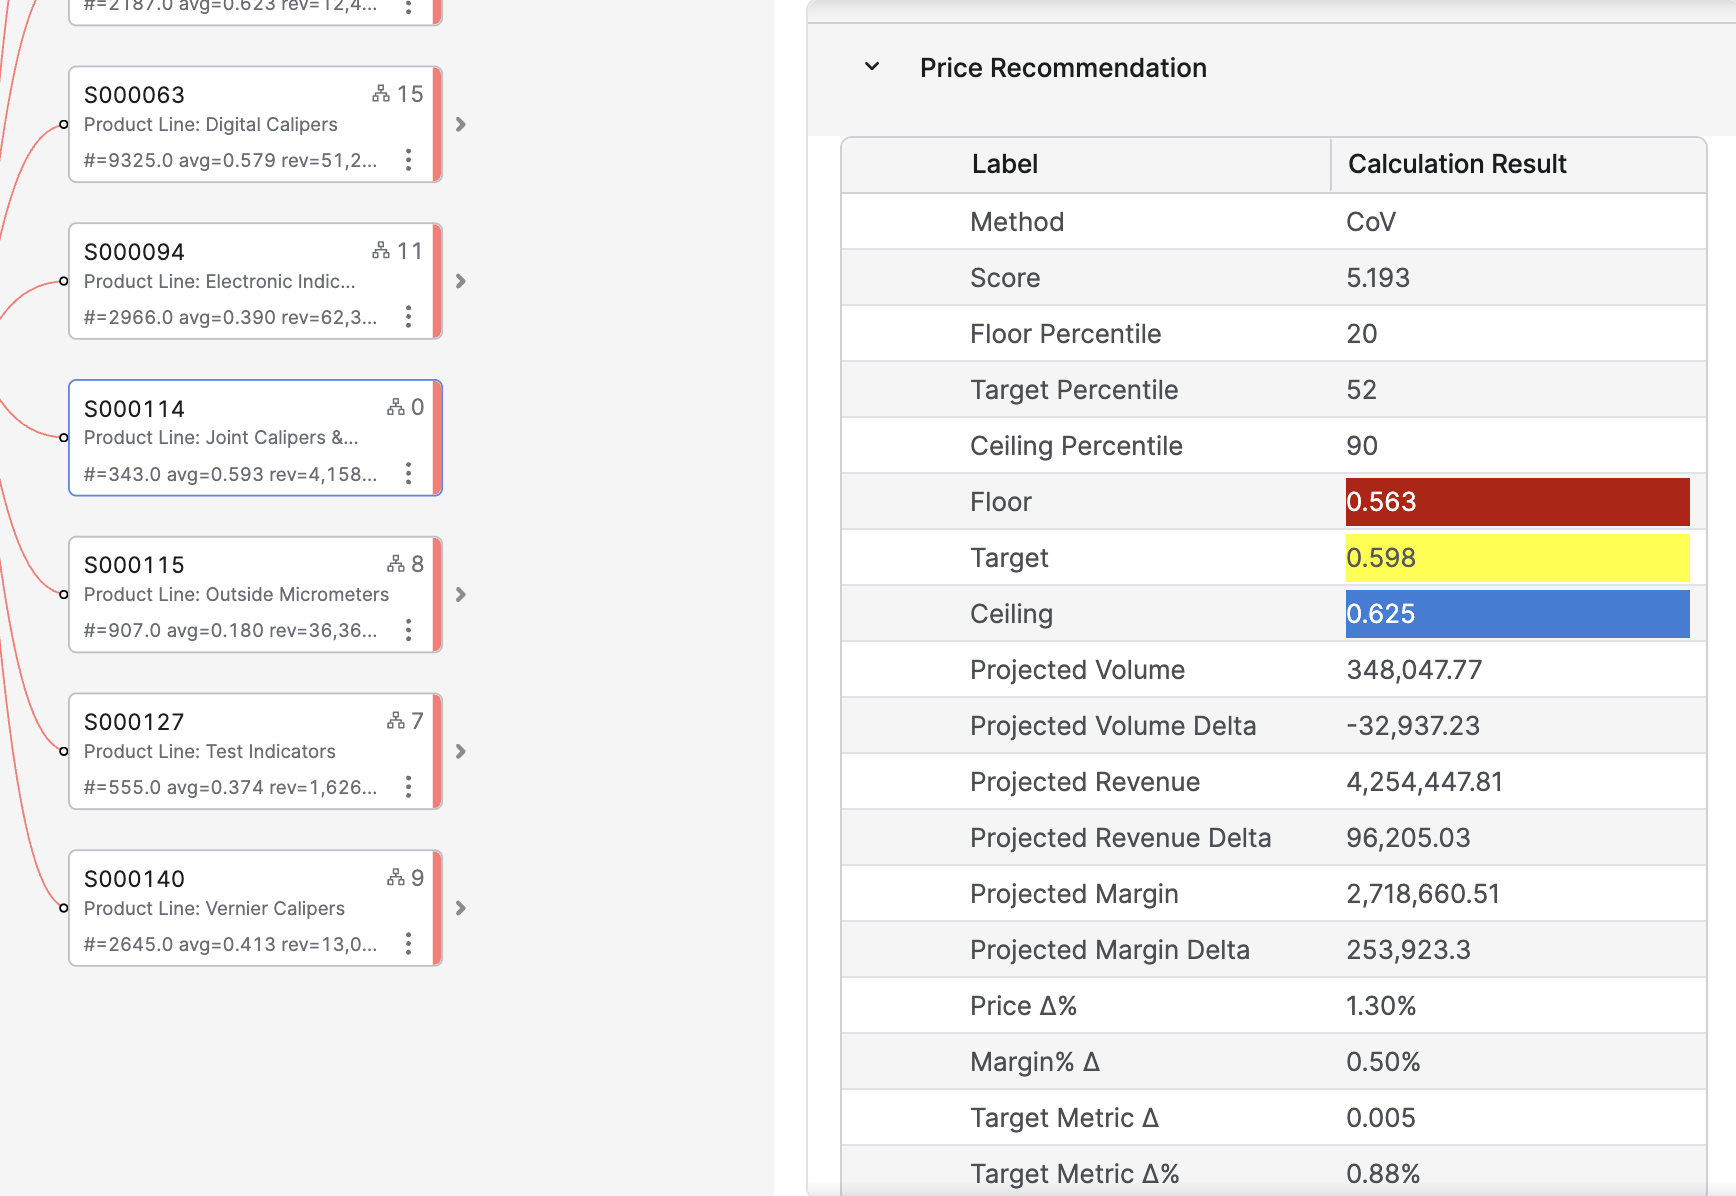
Note: Floor, target and ceiling displayed here use the alignment if any is defined.
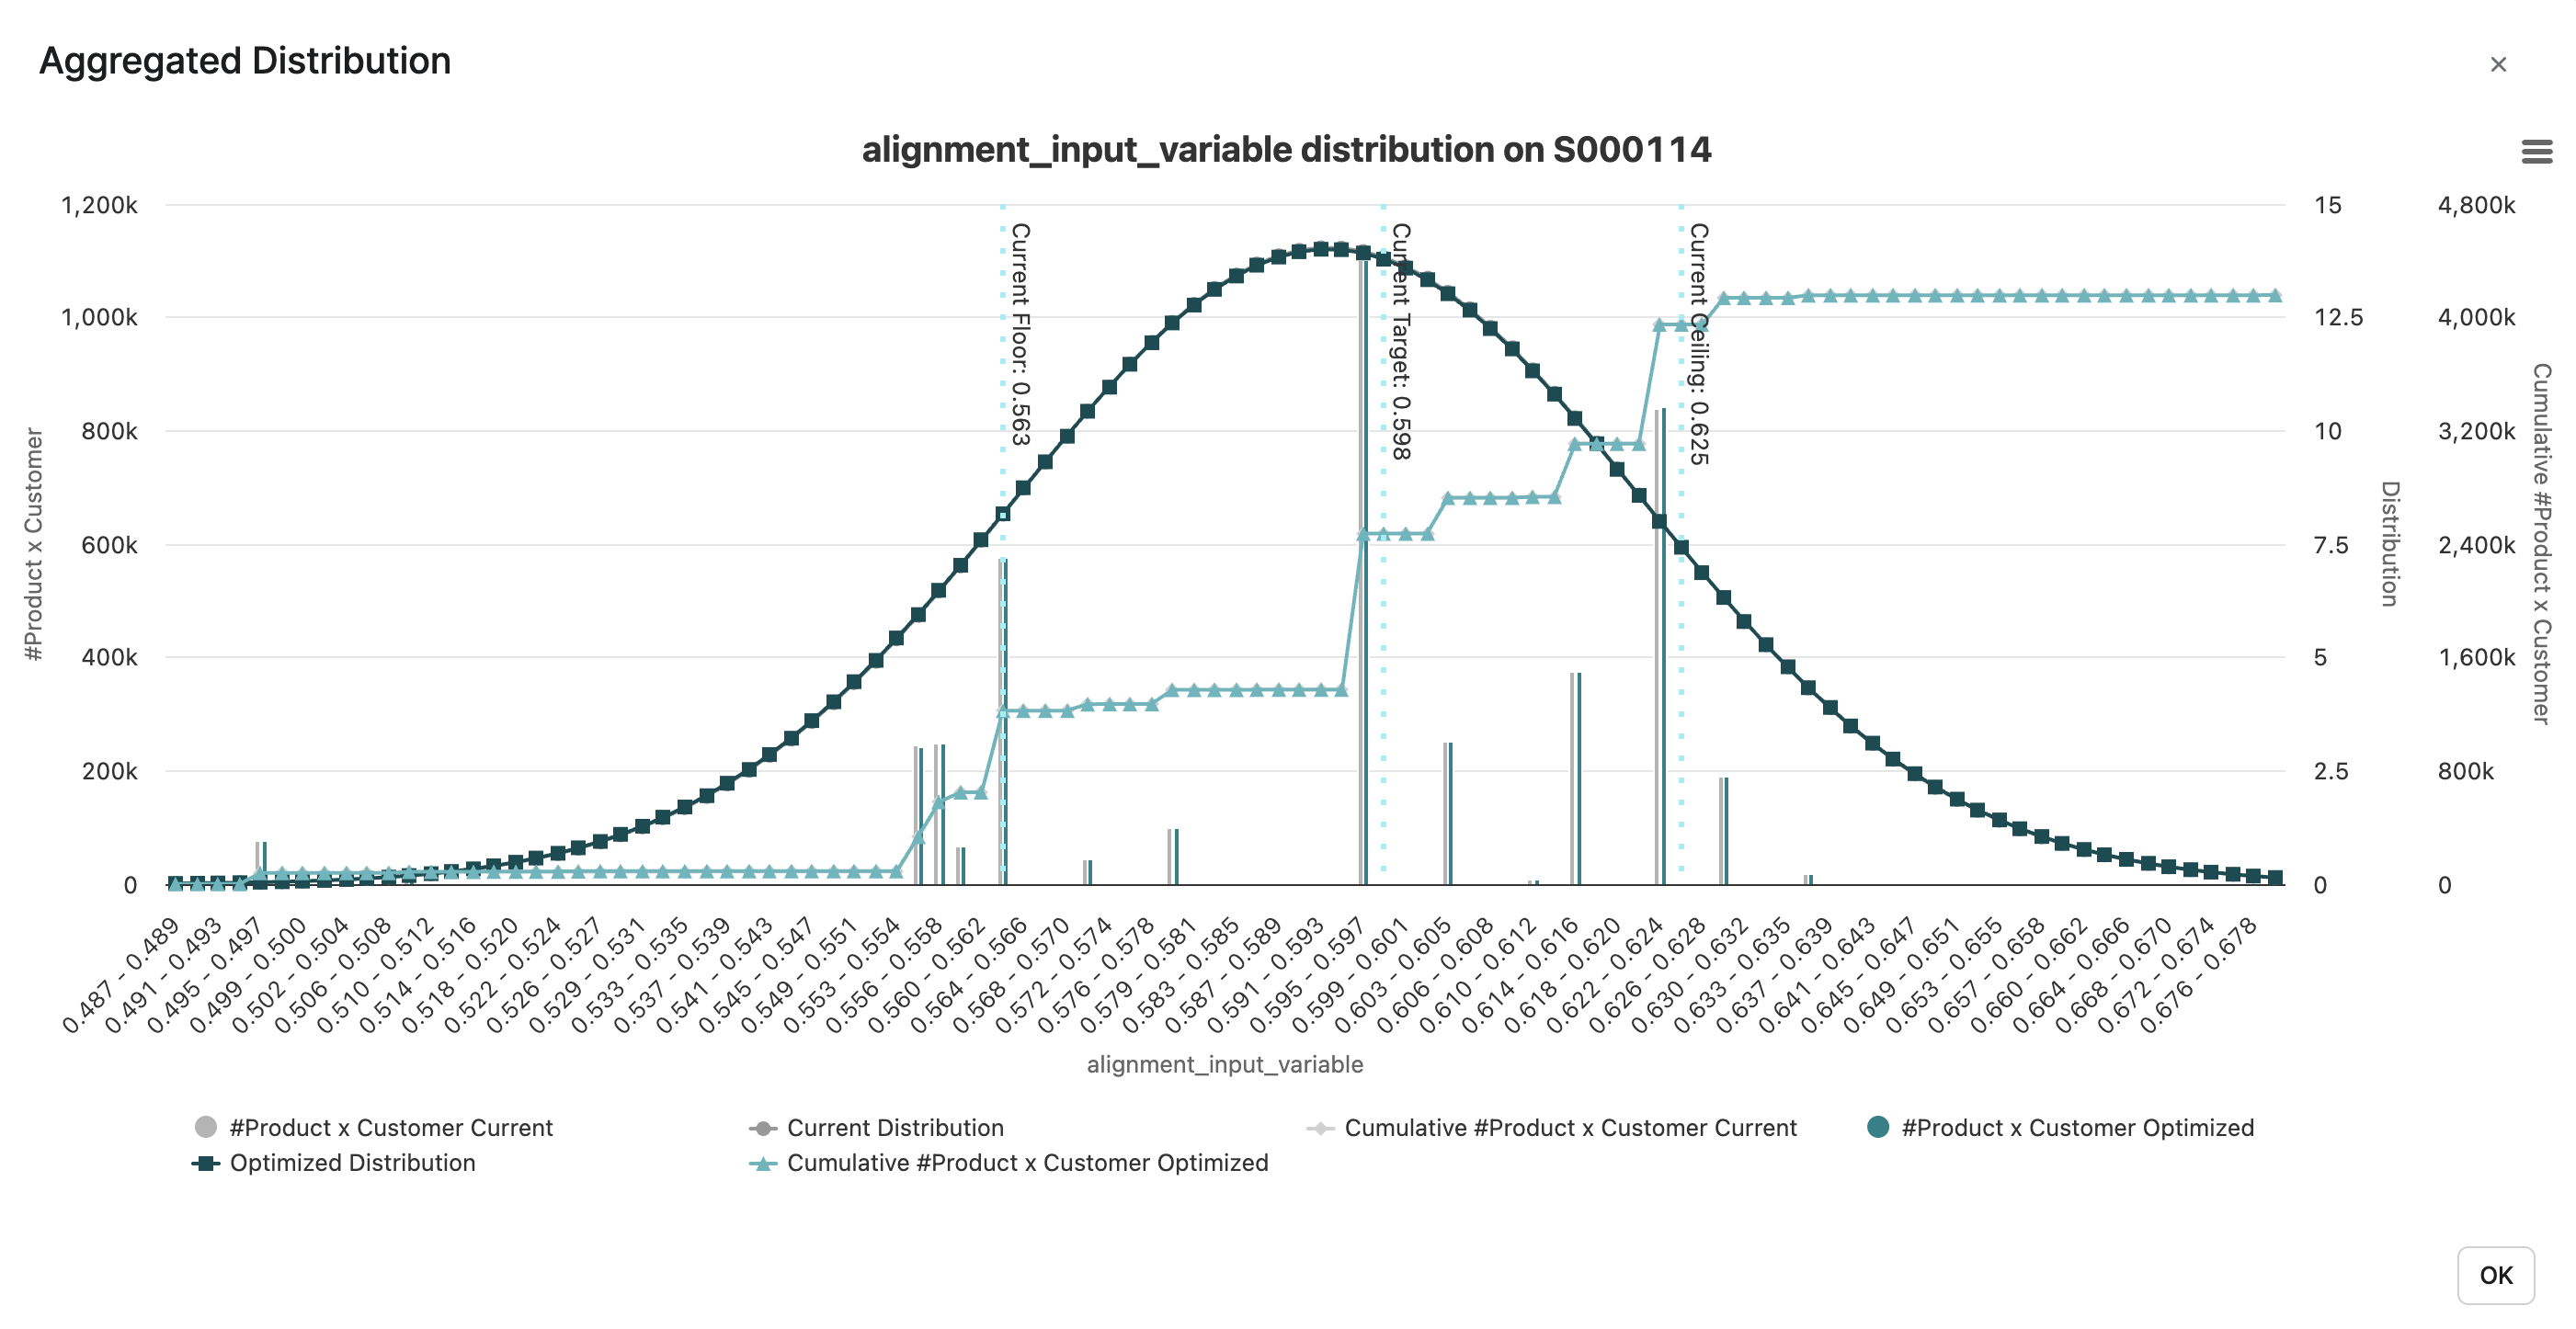
There is also a new chart, to compare the historical values and the optimized ones: Aggregated Distribution:
Recommendations Tab
Recommendations and Metrics per Segment
This portlet provides the segments table with all the optimized values for each segment. In particular, the optimization values are provided for the revenue, quantity, and optimization metric.
List of the fields:
|
Field name |
Description |
Alignment impact of the values |
|---|---|---|
|
Name and the levels of segmentation |
Define each segment. |
No impact of the segments definition. |
|
#Transactions, #Products, #Customers |
Number of distinct transactions, products, and customers inside the segment. |
No impact |
|
SSE |
Sum of squared errors in the segment, based on a hypothesis of a constant value of the optimization metric. |
It is calculated before the alignments. Alignments should not impact it. |
|
Divergence to normal distribution |
Measures the difference between a perfectly normal distribution and the actual distribution of the target metric in the segment. The smaller the value, the more the segment distribution is close to a normal distribution. |
It is calculated before the alignments. Alignments should not impact it. |
|
CoV or Weighted CoV |
Coefficient of variation of the optimization metric, depending on the use or not of a Weight field, i.e. the standard deviation divided by the average. |
It is calculated before the alignments. Alignments should not impact it. |
|
Target std or Weighted Target std |
The standard deviation of the target metric. |
It is calculated before the alignments. Alignments should not impact it. |
|
Initial Target avg or Weighted Target avg |
The average of the target metric. |
It is calculated before the alignments. |
|
Target avg |
The average of the target metric after the alignements. |
It is calculated after the alignments. |
|
Revenue |
Sum of the transactions revenues in the segment. |
It is calculated before the alignments. |
|
List price |
Sum of the extended list prices in the segment (provided if the optimization target is set to Discount% only). |
It is a fixed value during the alignments, same value before and after. |
|
Margin |
Sum of the transaction margins in the segment. |
It is calculated before the alignments. |
|
Margin Rate |
Division of Revenue by Margin. |
It is calculated before the alignments. |
|
Quantity |
Sum of the quantities revenues in the segment. |
It is a fixed value during the alignments, same value before and after. |
|
Parenting Level |
Number of levels from the segment to the leaves of the segmentation tree. |
No impact |
|
Scoring Method and Score |
Explained in Segmentation Step (Optimization - Negotiation Guidance) | Score Calculation. |
No impact. The score is either fixed, depending on two parameters, or depending on the CoV. |
|
Floor Percentile, Target Percentile, Ceiling Percentile |
Explained in Segmentation Step (Optimization - Negotiation Guidance) | How the Percentile Values Are Used?. |
No impact. They are either fixed or depending on the score value. |
|
Initial Floor, Inital Target, Initial Ceiling |
Values of the optimization metric before alignments |
They are calculated before the alignments. |
|
Floor, Target, Ceiling |
Values of the optimization metric for each of the defined percentiles. |
They are calculated after the alignments. |
|
Price Δ%, Margin% Δ, Target Metric Δ, Target Metric Δ% |
Deltas between the actual values and the ones that you would have if you used the optimizations rules to the floor/target percentiles. |
Based on the optimization rules and percentiles before the alignments. Those deltas do not take the alignments into account. |
|
Elasticity Parameters |
Parameters of the elasticity curve fitted on the segment, in a JSON format, to make it usable by another piece of code outside of the model. |
Fitted before the alignments. |
|
Optimal Target Metric, Optimal Target Metric For Revenue, and Optimal Target Metric For Profit |
Values that maximize the profit or revenue curves built using the elasticity formula. The global optimal target value is a pondered average of the profit optimum (2/3) and the revenue one (1/3). |
These values are based on the elasticity parameters, so before the alignments. |
|
Then many metrics are projected, based on these optimal target metrics, and the deltas between the actual values and the optimized ones are also presented: quantity, margin, revenue. |
These values are based on the optimal target metrics, so before the alignments. |
|
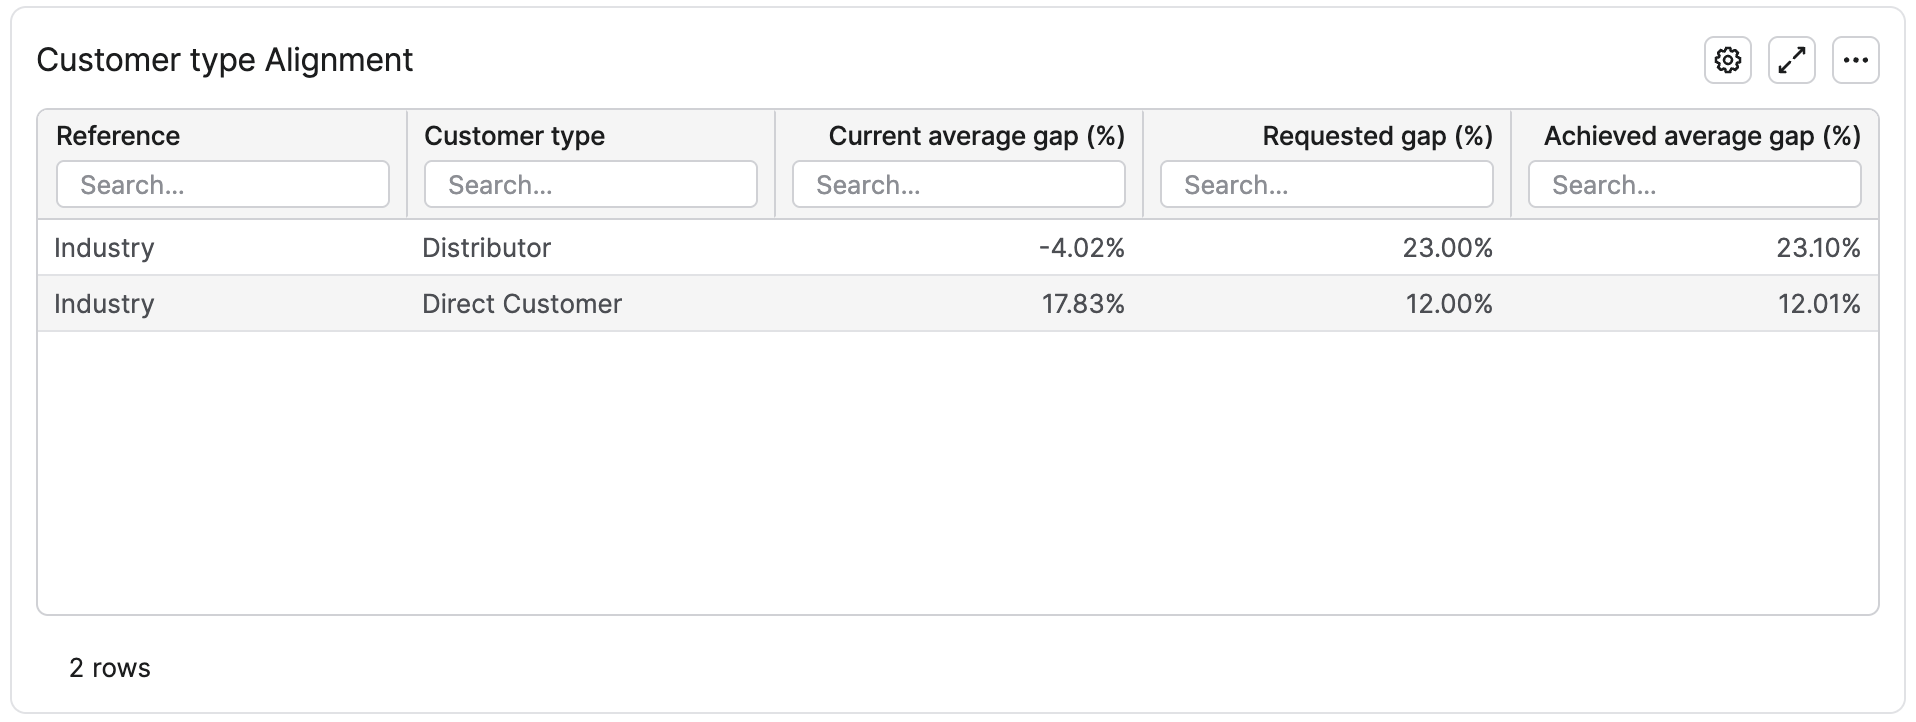
Dimension Alignment Portlets
For each dimension alignment set in the calculation, a corresponding portlet is displayed. They are tables where a row is an alignment rule. The current, requested, and achieved gaps are provided. It is a global view to check if the requested gaps were reached, or how far the optimized results are for the requests.
Evaluation Tab
This tab simulates a call of the minimal_mapping evaluation of the model, which can be called from any other part of the partition (such as price lists or quotes). The goal is mainly for an advanced user to test the logics, or to see what are the inputs and the outputs of the evaluation.
The minimal_mapping evaluation checks the segmentation levels, the product, and the customer fields, plus their hierarchies to define what are the minimal inputs to get to be able to define a segment. Those are the inputs of the evaluation. The outputs are: the segment, the segmentation level values defining the segment, and the main metrics of the segment.
It is better to have the Product field and the Customer field in the list of the Price Drivers. This way, if all the segmentation levels are product-related or customer-related, the evaluation takes the product and the customer to define the corresponding segment.
Alignment Review tab
In this dashboard, a boxplot chart is displayed for each alignment set in the optimization.
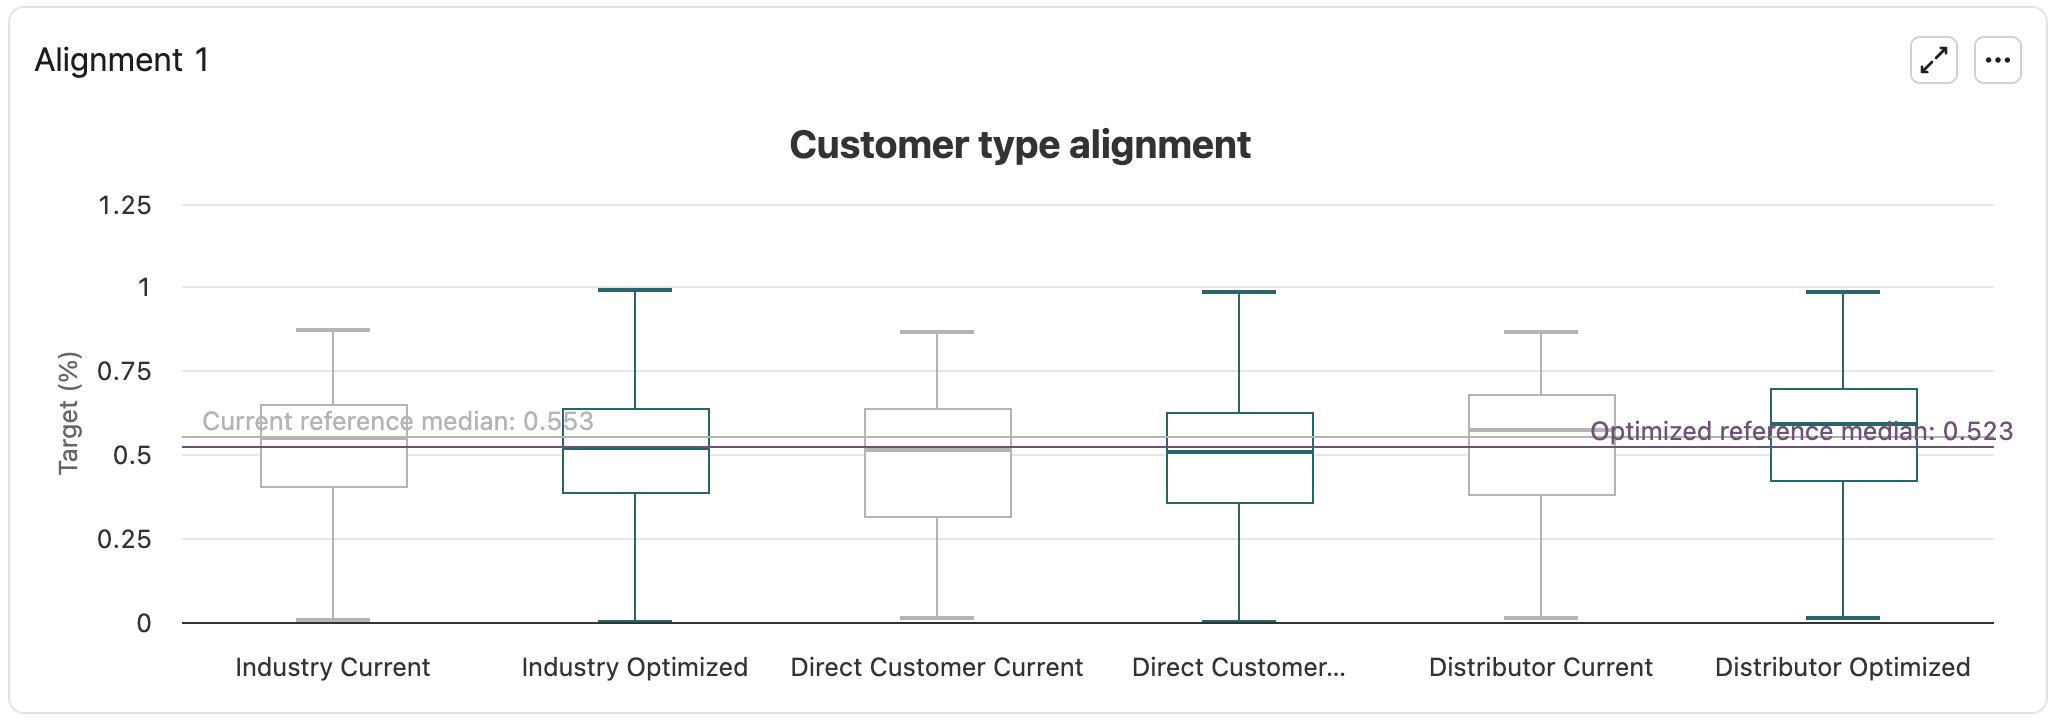
Each value of the dimension displays two boxes: one for the current values (before alignment, in light grey) and one for the optimized ones (after alignment). Each box represents a summary of the optimization target values corresponding to the given dimension value. On the chart above, for instance: the summary of all the discount rates in the scope of the model, where the Customer Type value is, for instance, Distributor. We can see in this example that to reach the requested alignments, the Distributor discounts globally increased and the Industry discounts globally decreased.
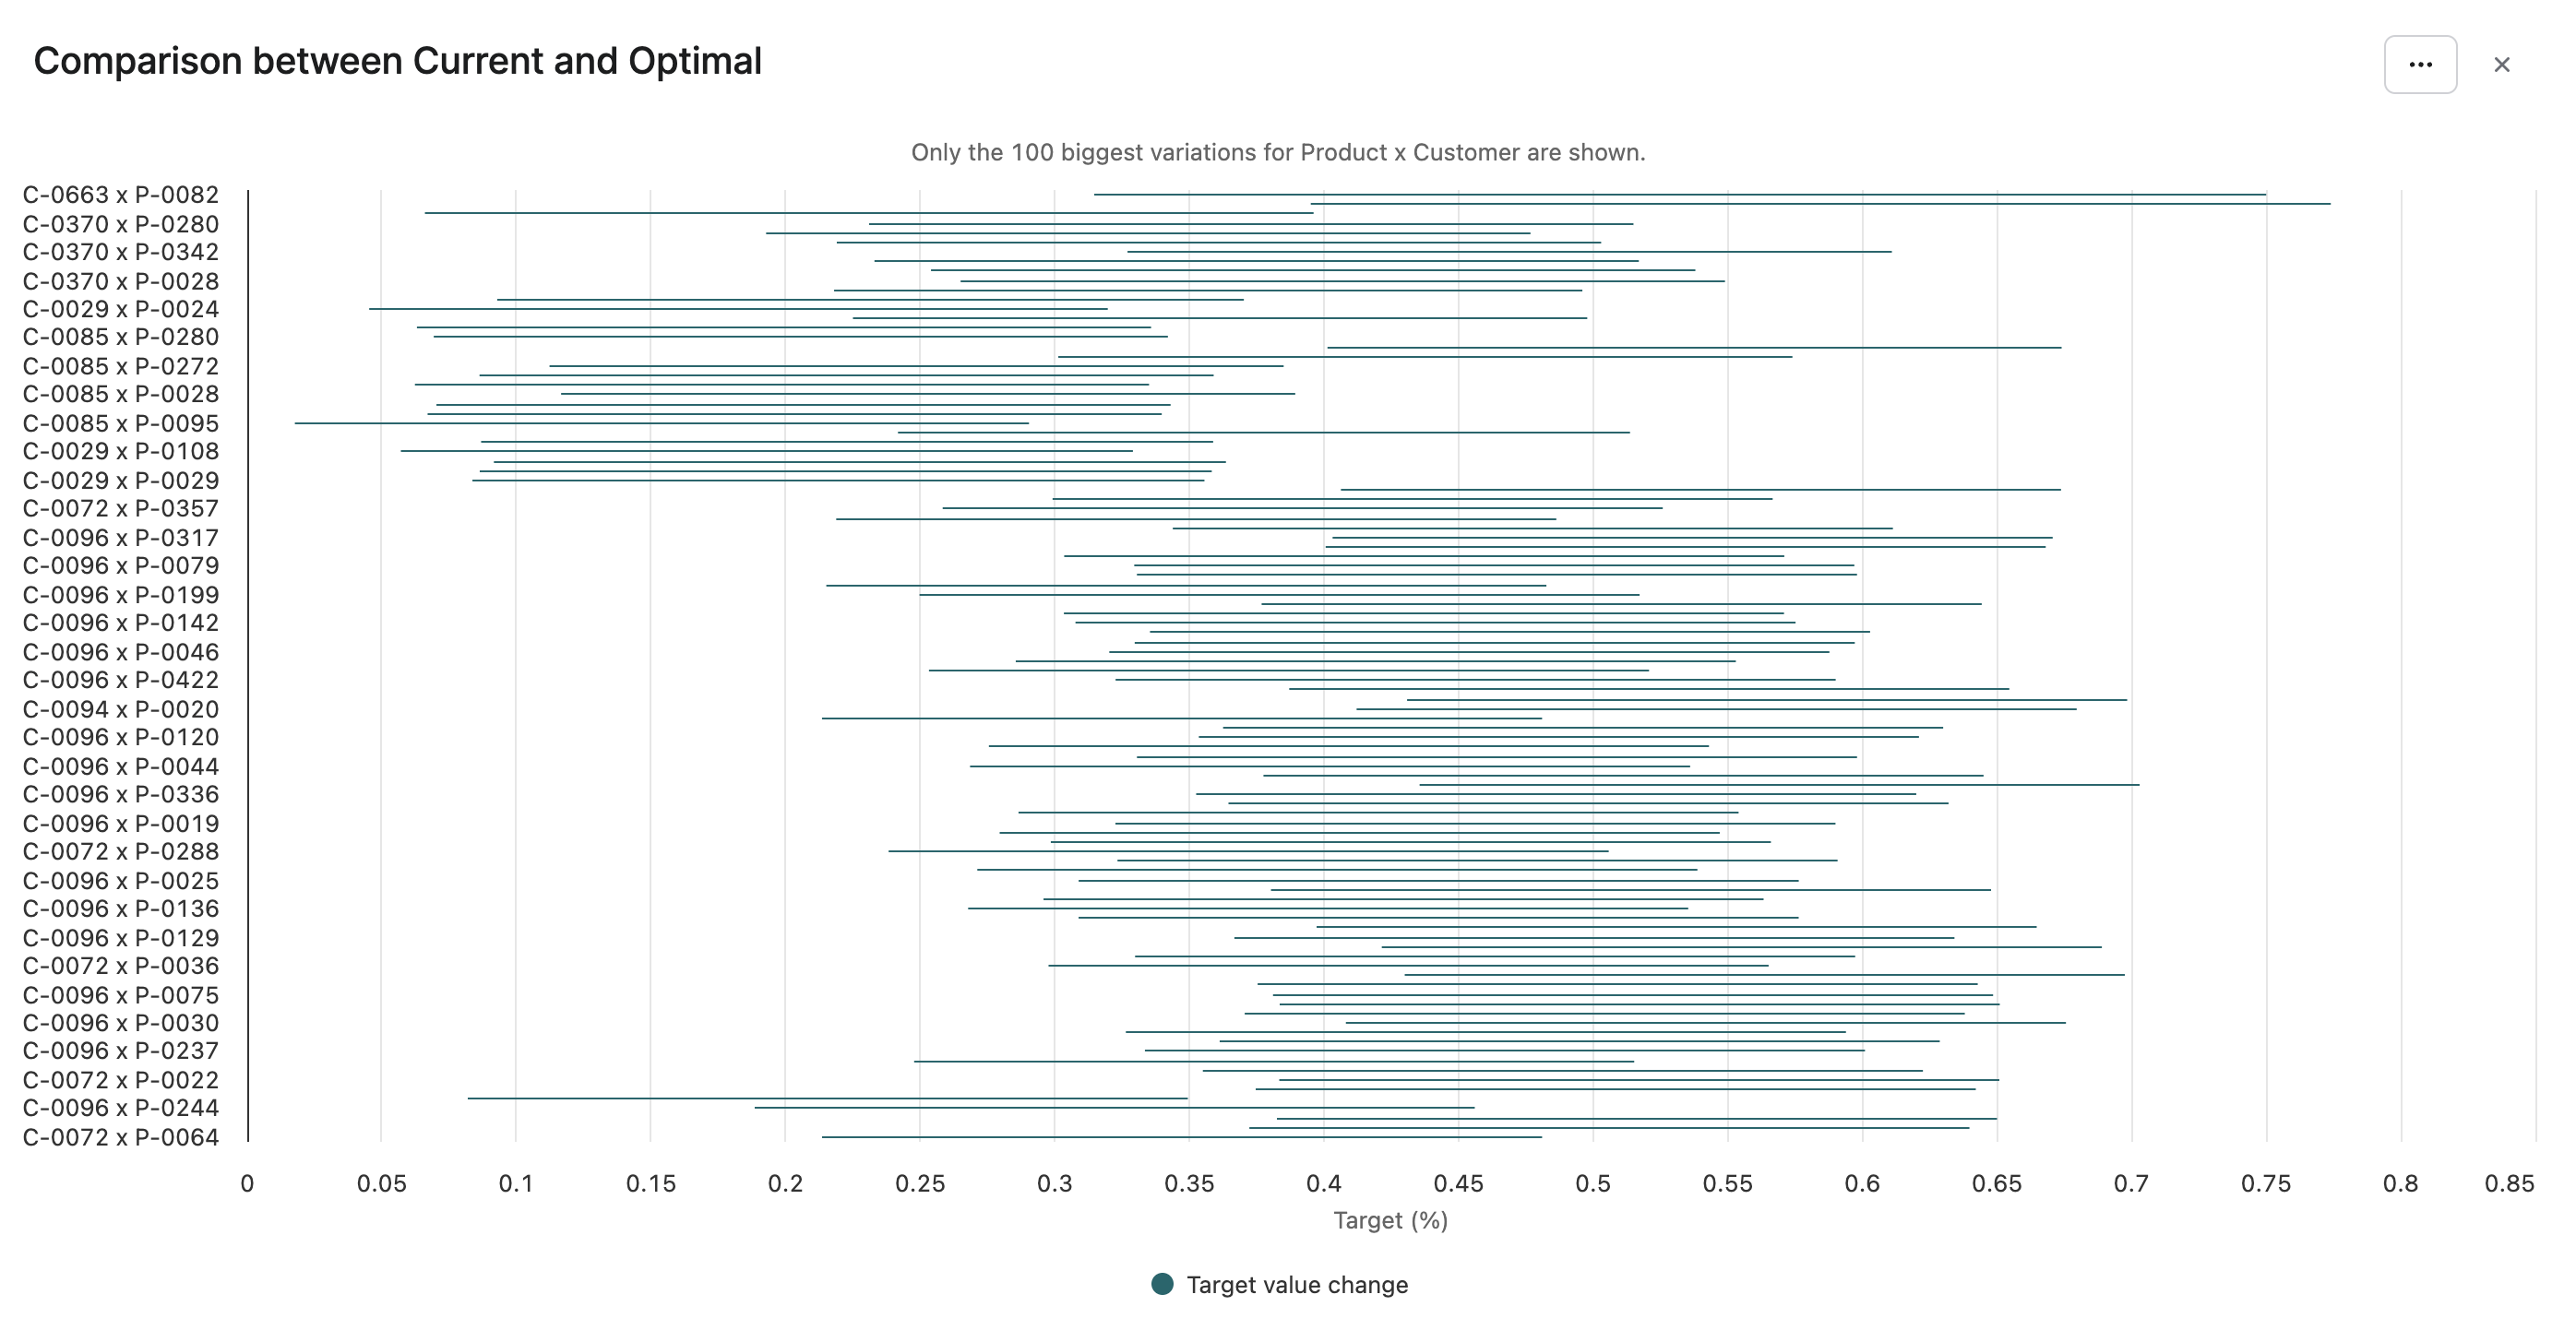
The last chart, Comparison between Current and Optimal, displays a sample of product-customer pairs and their optimization target variation due to the alignment work. It is the only portlet of the dashboard affected by the set of left panel user entries. At most 100 product-customer pairs are displayed: the most impacted ones. The horizontal bars show the range of the change.
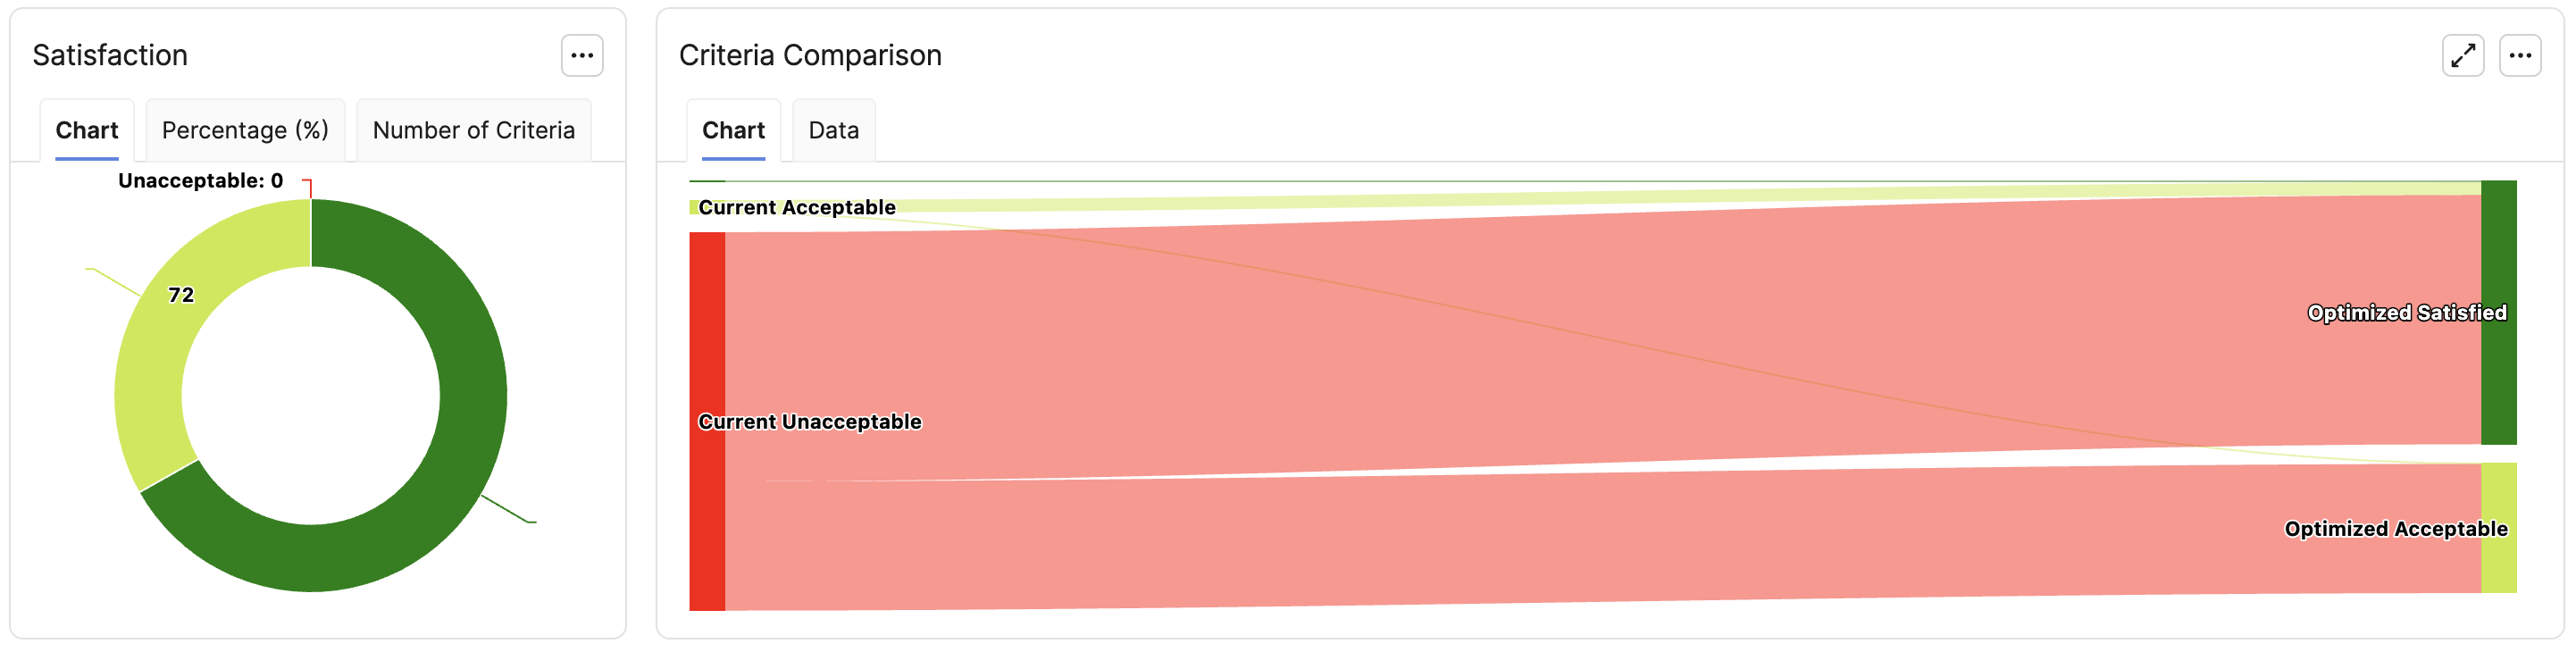
Glassbox Tab
This tab is a set of advanced charts to understand how the optimization engine works. It is for mostly for advanced users. Refer to Glassbox Dashboards for more details.
Still, it is interesting to check quickly how good the alignments are satisfied, from current situation to the recommendations. In this example, all alignments are satisfied or at least acceptable (meaning getting close to the alignment that has been defined)
Model Evaluation from Another Part of the Solution
If you need to call the model evaluation from any Pricefx module, three different evaluations are available: query_segment, minimal_mapping, and batch_query. The general way to query a model is explained in Query Optimization Engine Results | Using the Evaluator.
Query Segment
The user provides the segmentation levels and gets all the outputs corresponding to this specific segment. It is useful and quick to get the optimization values for one specific set of data. The command is:
def model = api.model("TheModelUniqueName")
def results = model.evaluate(
  “query_segment”,
  [
    segmentationLevel1: "someValue", // keys depend on the segmentation
    //...
  ])
def target = results['Target'] // or any other output
Minimal Mapping
Minimal Mapping is a more user-friendly way to query a segment. The user is asked only the minimum segmentation level values, ideally only the product and the customer. Knowing them, the evaluation finds all the corresponding segmentation level values, and define which is the most precise segment with this set of segmentation level values. Then, the outputs are similar as the ones of the Query Segment: the segment name, the corresponding segmentation level values, and the main metrics of the segment, including the floor, target, and ceiling values. The evaluation also returns the currency in which all monetary metrics are expressed, as defined in the Currency input of the Definition step.
If the inputs don’t correspond to the minimal mapping fields, the evaluation outputs also the list of the missing inputs and the list of the redundant inputs.
This evaluation is mocked in the tab Evaluation of the step Results, refer to Results Step (Optimization - Negotiation Guidance).
Batch Evaluation
It is a way to get a large bunch of optimization results in one command. The user provides an input query and a fields mapping and the evaluation returns a SQL query. It is an advanced feature, that provides a quick result for a large bunch of data in one command. The usage is:
def dmCtx = api.getDatamartContext()
DatamartContext.Query myQuery = dmCtx.newQuery(dmCtx.getFieldCollection("DM.myDM"))
        .selectAll(true)
        .where(Filter.equal("Country", "France"))
DatamartContext.SqlQuery batchSqlQuery = api.model("myNegotionGuidanceModel").evaluate(
       "batch_query",
        [
                sourceQuery: myQuery,
                mapping: [
                        quantity: 'myQuantityField',
                        optimization_target: 'marginPct',
                        segmentationLevels: ['productFamily', 'channel', 'country'],
                        otherFields: ['product', 'customer_id'],
                ]
        ]
)['AsBatchQuery']
api.getDatamartContext().executeSqlQuery(batchSqlQuery)
This model evaluation can be called from any place of Pricefx, based on an existing model that has run. The inputs are:
-
Query that fetches data to evaluate from a Negotiation Guidance point of view. If this input is not defined, the source query is a query on all the source data (defined in the Definition step), no filter applying on it.
-
Some mapping information to detect which fields are the quantity, the elasticity based-on variable, the segmentation levels, and the fields to output. The order of the segmentation levels is important. If not provided, the default values are the fields as mapped in the Definition step (quantity, optimization target, segmentation levels). The default value for the other fields is an empty list.
The output is an SQL query that can be executed to get, for each row of the executed input query:
-
All the fields defined in the mapping argument.
-
name– The name of the associated segment. -
Some NG results relative to the segment, corresponding to the elasticity and the optimization thresholds:
ElasticityParameters,elasticity,normalization_coefficient,target_avg,weighted_target_avg,target_std,weighted_target_std,floor_value,target_value,ceiling_value(if the names have not been changed in NG_Lib.ParametersLib). -
currencyin which all monetary metrics are expressed, as defined in the Currency input of the Definition step.
Note: this batch evaluation requires a datamart (or data source or a model table) as an input, this is mandatory how the way this function works, in doubts, you should use the datamart that is defined in the first step of this Negotiation Guidance model.