Technical User Reference (Optimization - Negotiation Guidance)
This section details the ModelClass and the logics that the Negotiation Guidance Accelerator deploys. For each step, its aim, outputs, and the main reasons to modify the logics are explained.
In this section:
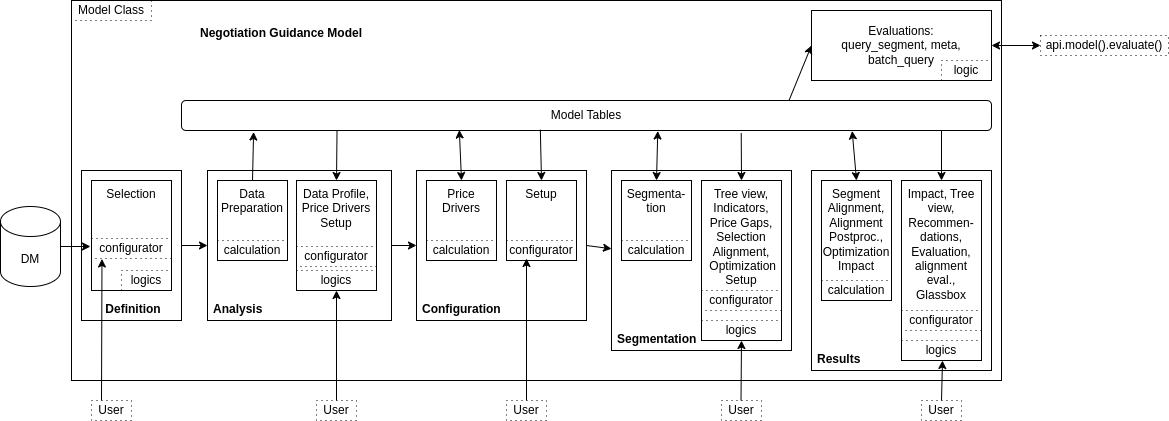
Negotiation Guidance Model Class
The Negotiation Guidance V2 (NG2) ModelClass organizes a list of logics to create the model architecture. It is a JSON file that refers to some logics and it is transformed into an optimized UI in the Pricefx platform. See Model Classes for more information.
The general architecture of the Negotiation Guidance Model Class is:
It defines five steps:
Definition – Sets the scope of the transactions.
Analysis – Analyzes the data in the scope and set the price drivers parameters.
Configuration – Sets the parameters for the segmentation.
Segmentation – Checks the segmentation and sets the parameters for the optimization.
Results – Looks at the outputs of the negotiation guidance in a user-friendly way.
There are two types of logics: calculation, which writes tables in the model, and evaluation, whose purpose is only to display some results. The standard Model Class definition is documented in Model Class (MC).
All the logics of the NG2 Accelerator follow a standard naming convention: first NG2_ prefix, then the order and the first letters of the step name, then Calc or Eval, depending on the formula nature, then the name of the tab. An evaluation logic may also need a corresponding configurator to take user inputs; it is defined in a logic of the same name, suffixed with Configurator. The logic to render a node from a segmentation tree is slightly different from the others, it is named NG2_NodeEval_TreeView. In the end, there is a library logic named NG2_Lib.
Library
The logic is NG2_Lib.
Aim of the logic
NG2_Lib is used in nearly all the other logics deployed by the Accelerator and defines a set of functions needed specifically for this Accelerator, but also some constants used to easily change the user interface wording. There are the following elements:
LabelsUtils, TablesUtils, and ParametersUtils – Lists of the labels, names of the tables, and names of the parameters used in all the places in the code.
DefinitionUtils, AnalysisUtils, ConfigurationUtils, and SegmentationUtils – Sets of tools dedicated to each step of the negotiation guidance.
AlignmentUtils - Set of tools dedicated to the segment alignments
OptimizationEngineUtils - Set of tools to describe automatically the optimization engine problem to optimize the alignments.
TreeViewUtils - Tools to display nicely the different charts in the tree view
CalculationsUtils – Groups the tools to deal with the percentiles and all the main formulas that could be useful to move between costs, margins, prices, and discounts.
ElasticityUtils – Groups the methods to deal with different elasticity functions and evaluations.
BeneficMetricsUtils – Set of functions to evaluate the projected values for a given change of the optimization target.
CustomUtils – Defines the formulas to get the most important pricing values changes if the optimization target is of a given type.
ImpactUtils – Set of functions used by the Impact tab of the Results step.
ColorUtils – Groups the tools to generate colors to be used in charts.
SettingsUtils − Function to get fields mapping set during the accelerator deployment.
ChartUtils - Tools to create and display charts in different parts of the model.
RecommendationUtils - Tools to generate automatically the recommendation portlets.
BatchQueryUtils - Tools to build the complex SQL query that can navigate in an optimized way in the segmentation tree.
MathUtils - Simple math functions that are not yet in the shared library.
It is accessed via the calls on libs.NG2_Lib.XXX in the code.
Common reasons to modify the logic
Changes of almost any wording in the user interface are done in LabelsLib.
Changes of the names of the Model Table or adding a new one are done in TablesLib.
You might want to define another optimization target (for instance: markup in place of margin). In this case, the functions to define the revenue depending on the optimization target will change (element CustomLib). The CustomLib must also be changed if the way to calculate a metric depending on the other ones change, for instance: we cannot consider that the cost is proportional to the quantity because there are some fixed costs.
You might want to define a new elasticity curve, and then the ElasticityLib would be modified.
Definition Step
There is no calculation logic in this step, and there is one tab with related evaluation logics: NG2_1_Def_Eval_Selection and NG2_1_Def_Eval_Selection_Configurator.
Aim of the logics
This logic provides the user inputs to define the source data and map it.
Outputs of the evaluation
A dashboard shows the transactions in the scope and the filtered-out transactions. It is an evaluation logic, so nothing is written in the model, but the user inputs defining the data mapping are available in the next steps.
Common reasons to modify the logics
Some other mappings are needed or some would be retrieved.
Define pre-set filters.
Add a chart to better understand the data. (Caution: it could take long, as the data are not yet stored in the model.)
Analysis Step
The calculation logic is NG2_2_Ana_Calc_DataPrep and there are two tabs with related evaluation logics: Data Profile and Price Drivers Setup. In this step, the data are materialized inside the model, an analysis is displayed, and the user is able to select the price drivers to calculate.
Calculation: DataPrep
The logic is NG2_2_Ana_Calc_DataPrep.
Aim of the logic
This calculation mainly materializes the data in the scope of the negotiation guidance. It also creates a summary table that is used to display some analysis in theData Profile dashboard.
Outputs of the calculation
Data in the scope: Transactions Model Table
Summary data: Profile Model Table
An even more global summary is stored and accessible through model.outputs('analysis', 'dataPrep')['Metrics']
Common reasons to modify the logic
If there is something else to output when the materialization of data is done.
Data Profile Tab
The logic is NG2_2_Ana_Eval_Profile.
Aim of the logic
This is mainly a dashboard tab to summarize the data of the scope in a visual way.
Outputs of the evaluation
The outputs of the logic are the portlets: a bar chart for the scope summary, a view of the Profile DMT, and the distinct values of the selected field, if there is one.
Common reasons to modify the logic
You can add or remove some summary portlets that would make sense, for instance, if there is a specific field that you need to visualize in a certain way.
Price Drivers Setup Tab
The logic is NG2_2_Ana_Eval_Price_Drivers_Setup_Configurator.
Aim of the logic
This logic is a pure configurator. Its aim is to choose the features that will participate in the price drivers' evaluation.
Outputs of the evaluation
The configurator defines an input matrix user entry.
Common reasons to modify the logic
Some price drivers are pre-selected, you can change the rule to pre-select these ones. You could also provide another field in the input matrix, or sort the attributes in a different way.
Configuration Step
The calculation logic is NG2_3_Con_Calc_PriceDrivers and there is one tab with related evaluation logic.
Calculation: PriceDrivers
The logic is NG2_3_Con_Calc_PriceDrivers.
Aim of the logic
This logic calculates the price drivers, i.e. the importance of each attribute when a boosted tree is built on top of them, using the optimization target as the variable to predict. It also computes the interactions among features, the hierarchies, and the segmentation dimensions recommendations.
Outputs of the calculation
The logic writes the tables:
PriceDriversCorrelations, a table containing the interaction data. It is used in the Feature Interaction Data and Feature Interaction portlets.
PriceDriversHierarchies and PriceDriversHierarchiesEdges; two tables containing the information to rebuild the hierarchy graph contained in the Hierarchy portlet.
PriceDrivers: The table contains the information required for the Price Drivers - Feature Importance portlet, Price Drivers - Relative Importance portlet, Price Driver Recommendations portlet, and the Select segmentation dimensions section of the configurator
PriceDriverRecommendations: A slightly more complete table containing information useful for debugging PriceDrivers.
Common reasons to modify the logic
The parameters to define the classification and boosting tree can be changed. It is also possible to change the way to calculate the attributes' importance. The correlation computation can also be changed. Finally, the segmentation dimension recommendation could be adjusted to other constraints of the domain.
Setup Tab
The logic are NG2_3_Con_Eval_Setup and NG2_3_Con_Eval_Setup_Configurator.
Aim of the logic
This tab is a configurator to define all the parameters of the segmentation itself: segmentation levels, parameters of the tree nodes, and elasticity parameters, and a dashboard to analyse the price drivers.
Outputs of the evaluation
All the user inputs of this configurator are available in the next steps, using the library element ConfigurationLib.
Common reasons to modify the logic
There could be different parameters to build the segmentation tree or to run the elasticity in the dedicated nodes.
Some charts would be removed, or modified.
Segmentation Step
The calculation logics are NG2_4_Seg_Calc_Segmentation and NG2_4_Seg_Calc_PriceGaps, and there are five tabs with related evaluation logics: Tree View, Indicators, Price Gaps, Selection Alignments, and Optimization Setup.
Calculation: Segmentation
The logic is NG2_4_Seg_Calc_Segmentation.
Aim of the logic
This calculation is a parallel calculation. That means that the first elements, of nature calculation-init, are global calculations. Then there are some elements of nature calculation-item that are run in parallel for each node of the segmentation tree: they calculate the metrics of the segment and its elasticity curve. Finally, some elements are of type calculation-summary. They update the tables of the model.
Outputs of the calculation
The list of segments with their detailed attributes: Segments Model Table. This table contains in particular the elasticity curve parameters and the optimal optimization metric value to maximize the revenue or the profit, based on the elasticity fit. If the user had selected the option to calculate the metrics based on the elasticity, there are also the projected quantity, revenue, and profit based on these optimal values.
The list of all segments from transactions, including those under minimum thresholds: SegmentsFull table. This table is primarily used to compute precise price gaps for Selection Alignments.
The list of segments with their editable parameters: Segments Parameters Table.
The decomposition of the optimization metric by percentile inside each segment: Percentiles Model Table.
The evaluation of the fit to a normal distribution for each segment: Fit Model Table. This table stores, for every segment, the result of a goodness‑of‑fit test comparing the empirical distribution of the optimization metric and the fitted normal distributionwith the same mean and standard deviation. The comparison is using a Kolmogorov-Smirnov test computed on binned, weighted data. The resulting divergence value is 0 for a perfect normal distributionand increases as the empirical distribution deviates from normality.
The aggregation of several dimensions by segmentation level: SegmentationOverview Model Table.
The Segments segmentation tree.
Common reasons to modify the logic
The segments' attributes could be added or modified. It could also be interesting to define other ways to evaluate if some segments are well-defined or not. For more details on parallel calculations see Build and Use Parallel Calculation.
It is the place where the elasticity curve is calculated, but the elasticity calculation refers to the library. If you want to change the elasticity function, you would have to update the code in the element ElasticityLib of the library NG2_Lib.
The benefit metrics are also calculated here. If there is a change in the way to calculate them, you would have to update the code in the element BenefitMetricsLib of the library NG2_Lib.
The Fit element calculates how much the segment distribution fits with a normal distribution. One could calculate another fit or another segment's goodness in general. In this case, the main formulas to change are in NG2_Lib, element CustomLib.
If there is a need to change the Parameters Table, i.e. the table that can be edited by the end-user to define specific parameters for some segments, then it is important to check also the element SegmentationLib of the library NG2_Lib, where some functions have been created to deal with this Parameters Table.
Calculation: Price Gaps
The logic is NG2_4_Seg_Calc_PriceGaps.
Aim of the logic
In the next step, the segments are aligned with each other. In order to be able to make the choice, the gaps between the different segments are calculated before the alignment setting.
The logic calculates, for each segment, its price gap with its parent segment. Then, these values are aggregated by the level of segmentation and the values of each level of segmentation (refer Segmentation Step (Optimization - Negotiation Guidance) | Price Gaps for more details)
Outputs of the calculation
A table called DimensionValuesMetrics, with one row per segmentation level value.
Common reasons to modify the logic
If there is another segment metric that is interesting to aggregate at each segmentation level.
Tree View Tab
The logic is NG2_NodeEval_TreeView.
Aim of the logic
This tab is of a special kind, it displays a tree. This tree is a comfortable way to navigate into the segments and get more information about any of them.
Outputs of the evaluation
Like any evaluation logic, there is no real output, except the fact that it displays information in the browser.
Common reasons to modify the logic
To display such a tree, you must define the tab type as filtertree. The model class defines the tree to fetch from the backend. This tree is called Segments and is created by the logic NG2_4_Seg_Calc_Segmentation.
The main reason to change this logic is to add or remove an output for the segments.
Indicators Tab
The logic is NG2_4_Seg_Eval_Indicators.
Aim of the logic
This dashboard displays most of the data written by the logic NG2_4_Seg_Calc_Segmentation.
Outputs of the evaluation
Like any evaluation logic, there is no real output, it displays a dashboard.
Common reasons to modify the logic
You may want to display the main information about all the segments with different charts or data.
Price Gaps tab
The logics are NG2_4_Seg_Eval_Price_Gaps_Review and NG2_4_Seg_Eval_Price_Gaps_Review_Configurator.
Aim of the logics
The dashboard filters one segmentation level and displays this level’s segments metrics.
Outputs of the evaluation
Like any evaluation logic, there is no real output, it displays a dashboard.
Common reasons to modify the logic
You may want to display other segments metrics.
Selection Alignments tab
The logic is NG2_4_Seg_Eval_Selection_Alignments_Configurator.
Aim of the logic
This configurator sets all the parameters to describe the structure of the optimization problem. It is a complex set of logics: sections are visible depending on previous checks, and when these features are unselected, the user inputs are kept in the model through hidden user input.
Outputs of the evaluation
The selected alignment dimensions and the gaps corresponding to the aligned values.
The logic is NG2_4_Seg_Eval_Optimization_Setup_Configurator.
Aim of the logic
This configurator aims to define the user parameters for the optimization process inside each segment. Only the global parameters have input here, the ones specific to some segments are changed directly in the Parameters Table called Segments.
Outputs of the evaluation
The user inputs are available in the next steps.
Common reasons to modify the logic
If there are some other parameters to define for the optimization inside each segment.
Results Step
The calculation is the sequence composed of the Segment Alignment, the Alignment Postprocessing, the Optimization, and the Optimization Postprocessing calculations logic, and there are seven tabs with related evaluation logics: Impact, Review, Tree View, Recommendations, Evaluation, Alignment Review and Glassbox.
Calculation: Segment Alignment
The logic is NG2_5_Res_Calc_Alignment.
Aim of the logic
The goal of this calculation is to create a simulation and an optimization run and retrieve their results. To do so, we need to create a Problem Description that details the structure of the problem to be solved by the Optimization Engine and gives endpoints for the OE to get the data of the problem. The inputs coming from the Selection Alignment tab will change the problem by altering its scope and changing the objectives, and the data will be fed directly to the OE thanks to the model tables.
This step consists of:
Data manipulation to prepare the last tables needed by the OE. These logics are prefixed by Store_ and create the model tables prefixed by Problem_ that act as an endpoint for the OE. Be careful, their names follow a strict format: These endpoints must be named according to the Problem_nameOfTheSpace_nameOfTheScope present in the ProblemDescription.groovy and return the corresponding data. The behavior of the OE and its way of reading data from endpoints highlight the need for a well-thought-out Scope step. Creating tables of the needed data, already computed and aggregated, implies being well aware of “where is the data I need” and “how do I need to transform it”. Due to computations depending on user inputs from business rules and objectives, some tables have to be created in later steps, explaining why even the RunOptimization calculation can have some store logics. That is why it is normal to refactor and improve scope logics and the other store logics during the development of ProblemDescription.groovy.
ProblemDescription.groovy element – Returns the problem description in a map. The content of the problem description is detailed in Problem Description.
GlassboxConfig.groovy element – Parses the problem description to automate the post-processing.
Run.groovy element – Contains the code that handles the problem description. It takes the description of the problem and the advanced parameters user inputs, and triggers the two optimization jobs thanks to model.startJobTriggerCalculation. Each run will return prefixed tables of similar structures. The jobs will run in parallel. The first one is the optimization itself and its outputs are prefixed by “Optimized”. The second one is a simulation: it simulates the first state of the optimization and will be a reference to compare before/after values in the results dashboards. Its outputs are prefixed by “Current”. The job type (optimization vs. simulation) is indicated by the input parameters of the model.startJobTriggerCalculation function.
Once the problem description is created, it is sent via a Kafka message to trigger the instantiation of a job running an OE configured by this file. The OE has to have access to the correct endpoints to get the data and to know where to write back the results when the computation is finished.
Outputs of the calculation
The Groovy code does some preparation work. It creates Problem_nameOfTheSpace_nameOfTheScope tables -- data manipulation to prepare the last tables needed by the OE. These logics are prefixed by "Store_" and create the model tables that act as an endpoint for the OE. Be careful, their names follow a strict format.
A Groovy element also reads the problem description to retrieve a list of parameters used during the postprocessing step to reformat the Glassbox data.
At the end of its run, the OE will write a set of model tables containing its results and the Glassbox information needed to understand why this solution was used. This writing is done directly by the OE and is not related to a Groovy logic. This job is done by the two OE jobs, the simulation one and the optimization one.
The Glassbox table provides optimization indicators for each pair of instantiated value finder – criterion. The simulation job does not create any Glassbox table.
The tables prefixed by Results_ present the state of the objectives and constraints at the end of the optimization.
The tables prefixed by Solution_ present the raw values that the system was meant to find (declared as Value_Finder in the Problem Description). The simulation job does not create any Solution table.
The tables prefixed by Simulation_ present the value of computed variables marked as exposed in the description, typically including values of interest such as forecasted quantities.
Common reasons to modify the logic
Any modification of the problem modeling and type of constraints to apply or objectives to reach implies a modification of the Problem Description, thus ProblemDescription.groovy should change accordingly.
⚠ If the problem description changes, do not forget to check if it is necessary to change or create some Problem tables, in the elements prefixed with Store_.
In some cases, it could be useful to change the OE image and/or the OE tag that the job trigger refers to. Their values are in the element Run.groovy.
Calculation: Alignment Postprocessing
The logic is NG2_Res_Calc_Alignment_Postprocessing.
Aim of the logic
The logics that triggers an Optimization Engine ends with this trigger. The postprocessing work must take place in the next logic. The postprocessing logic is in the same sequence and starts when the Segment Alignment one finishes.
This calculation retrieves the outputs of the RunOptimization logic and reformats them to provide tables that can be used to show user-friendly optimization results. Each element stores one model table or some similar tables.
Store_Glassbox_ logics calculate aggregated metrics on the optimization agents' criteria and value finders.
CreateAggregatedAndSolutionTable loads a table of the pairs of product, customer in the scope, with the value of the optimization target before and after the alignment. It does not aim to be read by a human, it is used later to display the outputs of the optimization.
Store_SegmentAlignmentImpact loads a table to help an advanced user to understand what as been done during the alignment process, or to debug in case of change. All the segmentation dimension values are aggregated, at all the levels of segmentation. When there is a corresponding segment, it is provided. When an alignment applies on the set of segmentation levels values, the requested alignment is provided. Finally, the values of the optimization target, before and after the alignment run, are provided.
Store_RecommendationTable manipulates the data in order to prepare the display of the Recommendation portlets in the step Results.
Outputs of the calculation
This calculation writes a collection of tables:
GlassboxVF_FinestGranularity_OptimizationTargetType table – It stores the overall values of each value finder.
GlassboxProbe_FinestGranularity_OptimizationTargetType table – It stores the initial movement of each value finder.
GlassboxCriteria_ tables – Their names are built as GlassboxCriteria_NameOfTheSpace_NameOfTheCriterion, there is one table by alignment. These tables store the overall values of each criterion. The spaces are called “PairsForNameOfTheDimensionAlignment” and correspond to the pairs of attributes where alignment criteria are set.
Glassbox_AggregatedMetrics table – Summarizes the global interaction indicators between each value finder key and each criterion key (alignment).
Glassbox_VFs_by_Key table – Summarizes the global overall indicators of each value finder key.
Glassbox_Criteria_by_Key table – Summarizes the global overall indicators of each criterion key.
Glassbox_Spaces table – Summarizes the total number of criteria and value finders in each space.
SegmentAlignmentImpact table - Summarizes the values before and after the optimization for each pair of product and customer.
SegmentAlignmentImpact table - Summarizes the values by set of segmentation levels’ values.
Recommendation table - Summarizes the alignment values by single segmentation level’s values.
Common reasons to modify the logic
The most common reason to change the logic is to reformat some data to ease the work of providing charts in the Result step tabs.
Calculation: Optimization
The logic is NG2_5_Seg_Calc_Optimization.
Aim of the logic
In this calculation, the parameters are used to calculate for each segment: a score, a target percentile (if not provided by the user). Then the alignment results (if done, otherwise the source data values) are used to define the floor, target, and ceiling thresholds of each segment (more details in Usage (Optimization - Negotiation Guidance)).
Outputs of the calculation
The Segments Model Table and the Segments Parameters Table are updated with new columns corresponding to the optimization strategy.
The logic is NG2_5_Res_Calc_Optimization_Postprocessing.
Aim of the logic
This calculation runs as the final step of the Results job. Its aim is to process the optimization outputs so that the Impact and Review dashboards can load quickly.
It computes the Impact metrics and pre‑calculates the Review dashboard metrics that would otherwise be expensive to recompute on demand, and it also enriches the transactions table with guardrail information.
Outputs of the calculation
Impact model table
An aggregation of the historical transactions in the scope using a combination of all the segmentation levels, with the historical and the projected values using the optimization strategy.
This table is used by the Impact tab dashboard.
The logic uses the model evaluation batch_evaluation to get the strategy coefficient to use for any transaction.
Review_TxnByGuardrailThresholds model table
Stores pre-calculated data for the Share of Transactions relative to Floor, Target and Ceiling chart on the Review tab.
Review_TxnByFloorCeilingSpread model table
Stores pre-calculated data for the Number of segments by spread between Floor and Ceiling chart on the Review tab.
Enriched Transactions table
Extends the Transactions model table with:
corresponding Floor and Ceiling values
review threshold group that classifies the transaction (for example: below_floor, between_floor_and_target…).
Common reasons to modify the logic
Add new aggregated tables to support additional portlets.
Change the definition of review threshold groups (for example, introduce different bucketing rules).
Adjust which fields are materialized in the enriched transactions table if new dashboards or external consumers need additional columns.
Different optimization calculations used for impact calculation.
Impact Tab
The logics are NG2_5_Res_Eval_Impact and NG2_5_Res_Eval_Impact_Configurator.
Aim of the logics
This dashboard provides the results of the optimization based on the thresholds in some meaningful portlets. The user inputs allow one to choose the level of aggregation and the realization rate. It uses the Model Table created by the previous calculation, called Impact.
Outputs of the evaluation
Like any evaluation logic, there is no real output, it displays a dashboard.
Common reasons to modify the logics
To display other charts or to provide meaningful information in a different way.
Review Tab
The logics are NG2_5_Res_Eval_Review and NG2_5_Res_Eval_Review_Configurator.
Aim of the logics
This dashboard compares optimized guardrails (Floor / Target / Ceiling) with the historical optimization metric. It uses pre‑calculated review tables produced in the final optimizationPostprocessing step (Review_TxnByGuardrailThresholds, Review_TxnByFloorCeilingSpread) and aggregates them according to the configurator (Segmentation level to explore, Specific value to detail). Its goal is to help users validate how well guidance bands fit past transactions (share of transactions below / within / above the band and spread between Floor and Ceiling) and quickly identify segments where recommendations may be too tight, too wide, or misaligned with observed behavior.
Outputs of the evaluation
Like any evaluation logic, there is no real output, it displays a dashboard.
Common reasons to modify the logics
To display other charts or to provide meaningful information in a different way.
Tree View Tab
The logic is NG2_NodeEval_TreeView. It is exactly the one used in Technical User Reference (Optimization - Negotiation Guidance), please refer to this section. It uses the same data but also some new fields, calculated by the NG2_5_Seg_Calc_Optimization calculation.
Recommendations Tab
The logic is NG2_5_Res_Eval_Recommendations.
Aim of the logic
This dashboard returns exactly the Model Table Segments, with all the optimized metrics.
Like any evaluation logic, there is no real output, it displays a dashboard.
Common reasons to modify the logic
It is possible to choose not to display some of the fields of the Model Table, or to add some fields with values calculated from the existing ones. It is also possible to display another table in this dashboard, like the Impact one, which contains the optimized values based on the thresholds policy, while the Segments one contains the optimized values based on the elasticity curve fit.
Evaluation Tab
The logic is NG2_5_Res_Eval_QuerySegment.
Aim of the logic
This tab simulates the query_segment evaluation of the model from any place in the Pricefx partition. It is of the type simple. It takes the parameters of the evaluation function as user inputs and displays all the outputs of it in a table.
Outputs of the evaluation
The displayed table represents the output map of the evaluation function. This function can be called from anywhere in the partition, using the command:
Groovy
def model = api.model("TheModelUniqueName")
def results = model.evaluate(
  “query_segment”,
  [
    segmentationLevel1: "someValue", // keys depend on the segmentation
    //...
  ]).results
def target = results['Target'] // or any other output
A model evaluation is the main link between any place in the partition and the model. So any output that should be provided to another module must be in this logic.
Alignment Review tab
The logics are NG2_5_Res_Eval_Alignment and NG2_5_Res_Eval_Alignment_Configurator.
Aim of the logic
The dashboard displays as many boxplots as requested alignments, plus a chart whose scope is parametrized by the user entries selected through the embedded configurator.
Outputs of the evaluation
Like any evaluation logic, there is no real output, it displays a dashboard.
Common reasons to modify the logic
It is possible to change the kind of charts that are displayed.
Glassbox Tab
The logic is NG2_5_Res_Eval_Alg_Glassbox.
Aim of the logic
This tab exposes the technical state of the OE execution at the end of the process. It is a development tool to help tune the model. It uses standard tools provided by the Optimization Common Libraries.
Outputs of the evaluation
This logic displays charts that show the satisfaction, influences, impacts of the value finders and the criteria, initial movements of the value finders, and evolution of the criticality during the process of optimization. For details see Glassbox Dashboards.
Common reasons to modify the logic
In general, there is no reason to change this dashboard.
It allows the user to provide minimal mapping values and retrieve all outputs corresponding to the specific segment associated with those values.
Usage and outputs
The usage is:
Groovy
def model = api.model("TheModelUniqueName")
def results = model.evaluate(
  "minimal_mapping",
  [
    minimalMappingField1: "someValue", // keys depend on the minimal mapping fields
    //...
  ]).results
def target = results['Target']
The output is similar to the output of Query Segment evaluation.
If there are any redundant or missing fields in the input keys, they will be indicated in the evaluation output.
Batch Evaluation
The logic is NG2_5_Res_Eval_Batch.
Aim of the logic
It is a way to get a large amount of optimization results in one command. This model evaluation can be called from any place in Pricefx, based on an existing model that has run.
Usage of the evaluation
The inputs are:
Query that fetches data to evaluate from a Negotiation Guidance point of view.
Some mapping information to detect which fields are the quantity, the elasticity based-on variable, the segmentation levels, and the fields to output. The order of the segmentation levels is important. The required keys of the mapping map are quantity, optimization_target, otherFields.
The output is an SQL query that can be executed to get, for each row of the executed input query:
All the fields defined in the mapping argument.
name – The name of the associated segment.
Some NG results relative to the segment, corresponding to the elasticity and the optimization thresholds: ElasticityParameters, elasticity, normalization_coefficient, target_avg, weighted_target_avg, target_std, weighted_target_std, floor_value, target_value, ceiling_value (if the names have not been changed in NG2_Lib.ParametersLib).
A model evaluation is the main link between any place in the partition and the model. So any output that should be provided to another module must be in this logic.
This logic provides a complex SQL query that fetches a lot of information by navigating into the segmentation tree. Some preprocessing or post-processing could be added in the query, depending on specific needs.
The logic is based on some library tools accessible from NG2_Lib/BatchQueryUtils. These tools are useful to fetch the segmented data in other parts of the model, inside the model itself.