
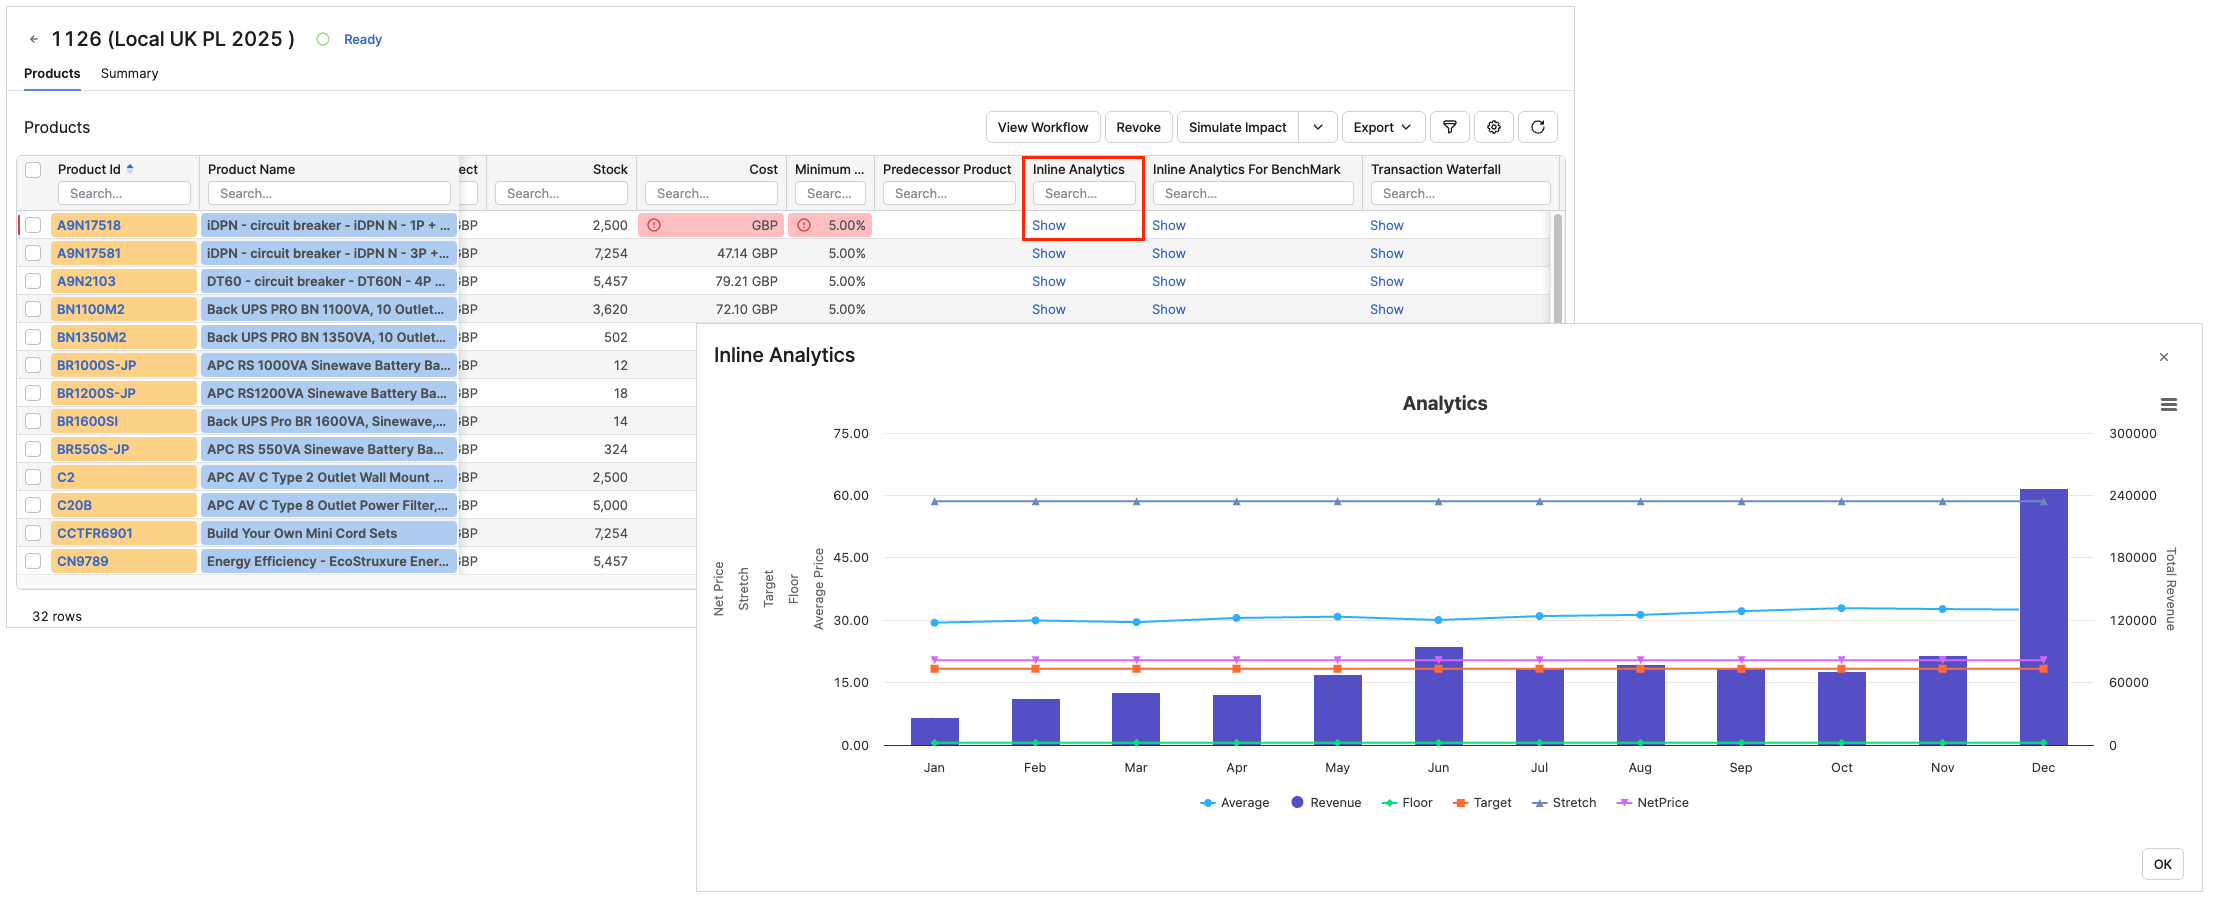
This article explains how to embed a real interactive chart directly into a Price List or Live Price Grid line item cell. The chart is calculated per row (typically per SKU) and opens from a button in the grid cell.
Concept
Price Lists and Live Price Grids support charts in three distinct places. They are configured differently and solve different problems.
|
Mechanism |
Rendering |
Scope |
How It Is Built |
|---|---|---|---|
|
Header Chart |
A dashboard-like strip above the line item grid |
One chart summarizing the whole Price List/ Live Price Grid. |
A |
|
Product Query Chart Definition |
A portlet in the Product Master / Price List / Live Price Grid detail view. |
One product (SKU) at a time, auto-filtered by the SKU currently open. |
Configured declaratively in the UI (Analytics-style query), no line item logic involved. |
|
Line-item Cell Chart (this article) |
A button inside a grid cell, opening an overlay panel. |
One chart per row, calculated as part of the line item logic. |
|
If you need a single summary chart for the whole document, use the header chart. If you need an Analytics-style chart scoped to whichever SKU the user has opened in the detail view, use Product Query Chart Definition. This article is specifically about a chart value inside a line item row of the grid itself.
How Does It Work
A Price List / Live Price Grid line item calculation logic is made of elements, each of which returns a value that can become a column. An element can also return a complex result such as ResultMatrix (table) or a ResultHighchart (chart). The grid renders that column as a button that opens an overlay panel.
def definition = [
    chart : [ type: "column" ],
    series: [[ data: [29.9, 71.5, 106.4, 129.2, 144.0] ]]
]
return api.buildHighchart(definition)
Recommended Logic Structure
Separate data gathering from the result.
|
Block |
Element |
Display Mode |
Purpose |
|---|---|---|---|
|
Data gathering |
|
None |
|
|
Result |
|
Everywhere or Price List/Price Grids |
|
Element Configuration
-
Set Display Mode.
-
Set on the result element so it is exposed to the Price List / Live Price Grid UI (Everywhere or Price Lists / Price Grids).
-
The data-gathering element stays at None.
-
-
Set Output Columns Selection.
-
Go to Price Setting > Price Setting Types.
-
Select the Price Lists or Live Price Grids.
-
Select the Price List or Live Price Grid you want to edit.
-
Go to Output Columns step.
-
Tick the checkbox for your chart element.
-
Click Save.
Example
ChartData_PriceHistory.groovy (Data Gathering)
In order to use the following example you need to adapt to your partition's Datamart definitions.
//======================================================
//In order to use the following example you need to adapt to your partition`s Datamart definitions.
def DM_NAME    = 'datamart_transaction'
def SKU_FIELD  = 'ProductID'
def PRICE_FIELD = 'InvoicePrice'
def YEAR_FIELD  = 'InvoiceDateYear'
//======================================================

def sku = api.product("sku")
if (!sku) { return null }

def ctx = api.getDatamartContext()
def dm  = ctx.getDatamart(DM_NAME)
def query = ctx.newQuery(dm, true)
    .select(YEAR_FIELD, 'Year')
    .select('AVG(' + PRICE_FIELD + ')', 'AvgPrice')
    .where(Filter.equal(SKU_FIELD, sku))
    .orderBy(YEAR_FIELD)

def queryResult = ctx.executeQuery(query)
def categories = []
def prices = []
queryResult?.getData()?.each { row ->
    categories << row.get('Year')?.toString()
    prices << row.get('AvgPrice')
}
return [categories: categories, prices: prices]
PriceHistoryChart.groovy (Result)
def chartData = out.ChartData_PriceHistory
if (!chartData || !chartData.prices) { return null }

def definition = [
    chart: [ type: 'column' ],
    title: [ text: 'Price History' ],
    xAxis: [ categories: chartData.categories ],
    yAxis: [ title: [ text: 'Avg. Invoice Price' ] ],
    legend: [ enabled: false ],
    credits: [ enabled: false ],
    series: [[
        name: 'Avg. Price',
        data: chartData.prices,
        dataLabels: [ enabled: true, format: '{point.y:.2f}' ]
    ]]
]
return api.buildHighchart(definition)
Result
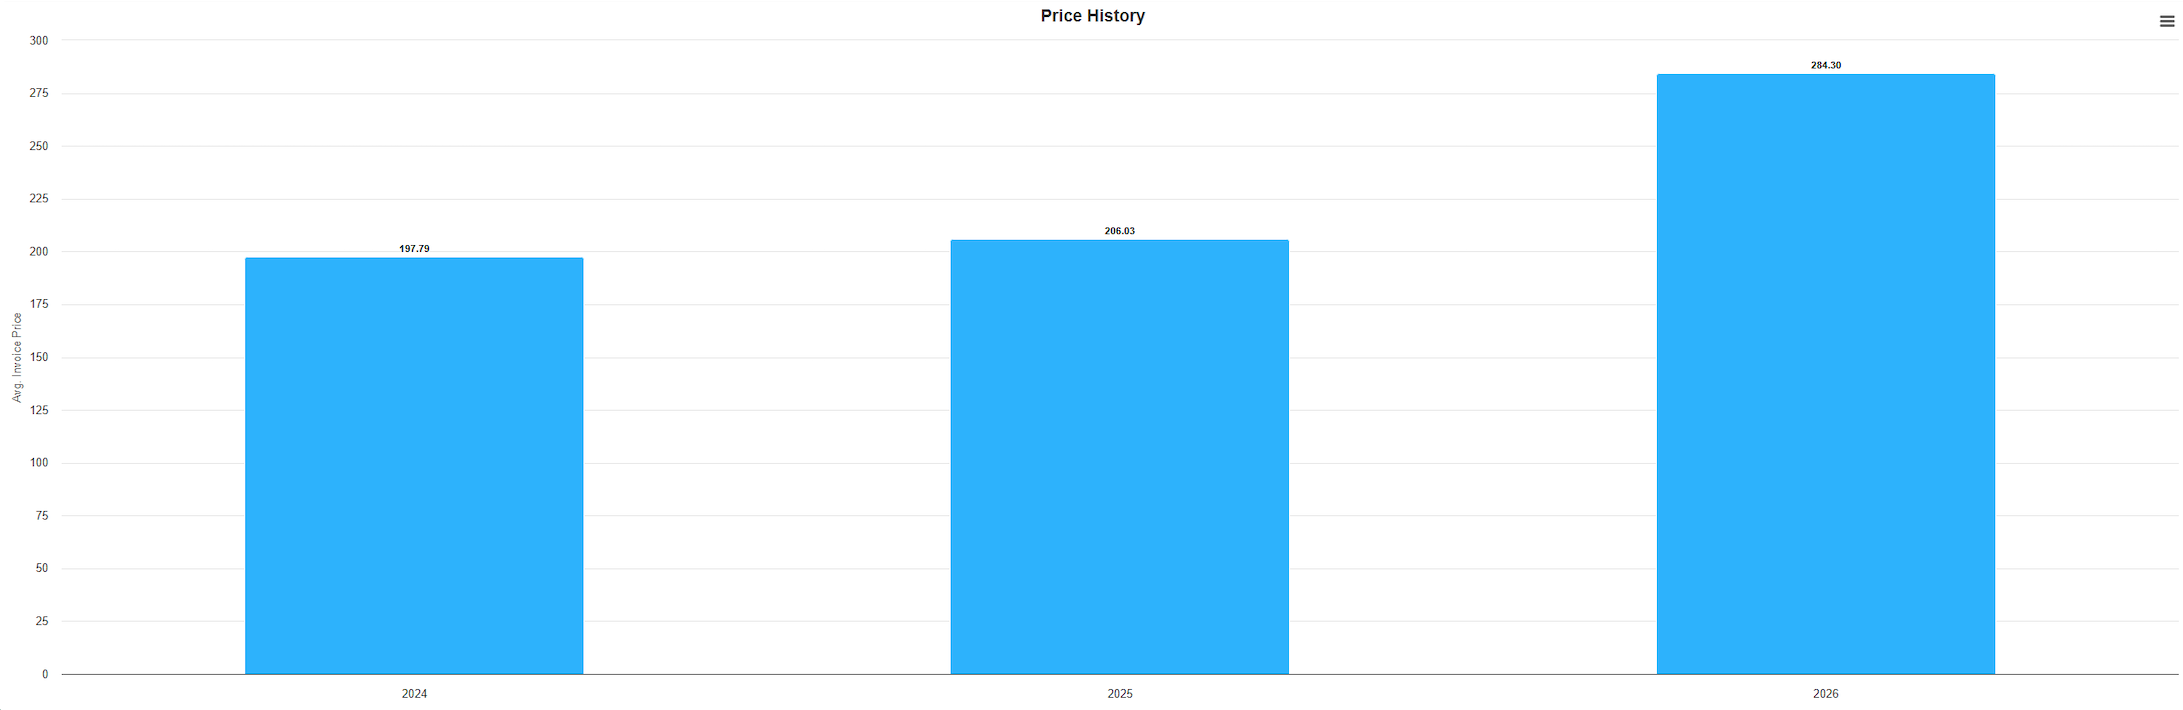
Example QueryAPI
The following example implemented with api.queryApi() instead of api.getDatamartContext() query.
ChartData_PriceHistory.groovy (Data Gathering)
In order to use the following example you need to adapt to your partition's Datamart definitions.
import net.pricefx.formulaengine.scripting.queryapi.Exprs
import net.pricefx.formulaengine.scripting.queryapi.PipelineStage
import net.pricefx.formulaengine.scripting.queryapi.QueryApi
import net.pricefx.formulaengine.scripting.queryapi.Tables

//======================================================
//In order to use the following example you need to adapt to your partition`s Datamart definitions.
adapt to your partition's Datamart definition
String DM_NAME     = 'Standard_Sales_Data'
String SKU_FIELD   = 'ProductId'
String PRICE_FIELD = 'InvoicePrice'
String YEAR_FIELD  = 'PricingDateYear'
//======================================================

String sku = api.product("sku")
if (!sku) {
    return null
}

QueryApi queryApi = api.queryApi()
Exprs exprs = queryApi.exprs()
Tables.Table dm = queryApi.tables().datamart(DM_NAME)

List<Map> rows = queryApi.source(dm, [dm.getAt(SKU_FIELD), dm.getAt(YEAR_FIELD), dm.getAt(PRICE_FIELD)])
        .filter { cols -> cols.getAt(SKU_FIELD).equal(sku) }
        .aggregateBy({ Tables.Columns prevColumns ->
            [prevColumns.getAt(YEAR_FIELD)]
        }) { Tables.Columns prevColumns ->
            [prevColumns.getAt(YEAR_FIELD).as(YEAR_FIELD),
             exprs.avg(prevColumns.getAt(PRICE_FIELD)).as('AvgPrice')]
        }
        .sortBy { cols -> [queryApi.orders().ascNullsLast(cols.getAt(YEAR_FIELD))] }
        .stream { PipelineStage.ResultStream resultStream ->
            resultStream.collect { it as Map }
        }

List<String> categories = []
List<BigDecimal> prices = []
rows?.each { Map row ->
    categories << row.getAt(YEAR_FIELD)?.toString()
    prices << row.getAt('AvgPrice')
}

if (!prices) {
    return null
}

return [categories: categories, prices: prices]
PriceHistoryChart.groovy (Result)
Map chartData = out.ChartData_PriceHistory
if (!chartData) {
    return null
}

Map definition = [
        chart  : [type: 'column'],
        title  : [text: 'Price History'],
        xAxis  : [categories: chartData.categories],
        yAxis  : [title: [text: 'Avg. Invoice Price']],
        legend : [enabled: false],
        credits: [enabled: false],
        series : [[
                name      : 'Avg. Price',
                data      : chartData.prices,
                dataLabels: [enabled: true, format: '{point.y:.2f}']
        ]]
]

return api.buildHighchart(definition)
Additional Information
|
Bad Practice |
Best Practice |
|---|---|
|
The |
Use string format patterns, e.g. |
|
The FlexCharts are deprecated (api.buildFlexChart()). |
Use HighCharts api.buildHighchart(). |
|
The api.currentItem() is |
Prefer api.product("sku") for SKU access (works every pass). Guard |
Charts
Some chart types need an explicit module. Highcharts ships several chart types as opt-in modules. Some of the charts are loaded by default some need addModule() addition before returning.
Charts Loaded by Default
-
boost -
drilldown -
exporting -
export-data -
heatmap -
no-data-to-display -
treemap
Charts with Addition
-
variwide -
funnel -
annotations
Example of Addition
def chart = api.buildHighchart(definition)
chart.addModule('variwide')
return chart