This implementation is DEPRECATED, please refer now to Negotiation Guidance Accelerator.
Take the following steps to configure a model:
1. Define Model Type
The model type defines the logics used for each step of an optimization model.
Go to Optimization > Model Types and click Add Model Type or select an existing model type and copy it if you want to provide only a few changes.
The standard Segmentation model type definition is:
{
  "logic": "Segmentation", "libLogic": "Segmentation_Lib", "analysisLogic": "Segmentation_Analysis", "evalLogic": "Segmentation_Eval", "recordLogic": "Segmentation_Policy",
  "generatesData": true, "generatesTables": false,  "generatesRecords": true, "generatesTrees": true,
  "calcSteps": [
    {"name": "DataPrep", "label": "DataPrep", "category": "analysis", "logic": "Segmentation_DataPrep", "distributed": false},
    {"name": "DataProfile", "label": "DataProfile", "category": "analysis", "logic": "Segmentation_DataProfile", "distributed": false},
    {"name": "PriceDrivers", "label": "PriceDrivers", "category": "analysis", "logic": "Segmentation_PriceDrivers", "distributed": false},
    {"name": "Segmentation", "label": "Segmentation", "category": "calculation", "logic": "Segmentation_Segmentation", "distributed": false},
    {"name": "Scoring", "label": "Scoring", "category": "calculation", "logic": "Segmentation_Scoring", "distributed": true},
    {"name": "Pricing", "label": "Pricing", "category": "calculation", "logic": "Segmentation_Pricing", "distributed": true}
  ]
}
Some steps may be changed, added or removed in Optimization models. But Segmentation is based on theses logics and the following documentation is based on such a segmentation model type.
Here, the main logic is Segmentation; the record logic, which writes each policy record is Segmentation_Policy and there are 6 calculation logics, in two categories:
-
Analysis category:
-
DataPrep (
Segmentation_DataPreplogic) -
DataProfile (
Segmentation_DataProfilelogic) -
PriceDrivers (
Segmentation_PriceDriverslogic)
-
-
Calculation category:
-
Segmentation (
Segmentation_Segmentationlogic) -
Scoring (
Segmentation_Scoringlogic) -
Pricing (
Segmentation_Pricinglogic)
-
2. Create Model Based on Chosen Model Type
Go to Optimization > Models in the main application menu.
Then you can either create a new model, with the Add Model button, or copy an existing one if you want to provide few changes and keep the previous one.
Added Model
You have to define a name, a label, and a model type. The model type can be used by many models. It defines the calculation steps and the logics used. By default, choose “Segmentation”.
Use informative names for your models, providing information on your dataset, your calculation case.
⚠ For a model name, there is a limit of 50 characters. (This limit is valid for all FC uniqueName values in Pricefx and it originates from the limit of 63 characters in the underlying Postgres database.)
Copied Model
Once you have copied a model, you can change its name by double-clicking the blank side of its name/label. Don’t forget to do it before running the model. You can’t change a model name once it has been computed.
3. Prepare Transaction Source
The segmentation model will run on a transaction source. It may be a Data Source or a Datamart. Some important points about it:
-
It must contain required fields – create them if needed:
-
Customer field – ID of each customer. Be careful: it can’t be a source key. If it is, duplicate the field to be able to access to it.
-
Product field – ID of each product/article/SKU. Be careful: it can’t be a source key. If it is, duplicate the field to be able to access to it.
-
Quantity field – Number of products in each transaction.
-
Revenue field – Total price of the transaction.
-
Margin field – Revenue minus cost.
-
Weight field (optional) – Transaction weight.
-
Target field – Generally, it is a margin rate (margin / revenue) or a margin percentage (margin / revenue * 100).
-
-
The segmentation levels must be defined as dimensions in the transaction source. Moreover, they can’t be a source key; if necessary, duplicate the key column to create a dimension.
-
Avoid null values in segmentation dimensions. If necessary, create a new field by using an expression which replace empty values by a text like “Not provided”.
4. Define Model (Definition Step)
In the Definition step, you define the model parameters.
-
Transaction source is the dataset used to calculate the segments. Once provided, some fields based on it appear:
-
Transaction Filter allows you to filter the data. We recommend to use at least these filters:
-
Positive cost, revenue and quantity
-
Margin percentage (or other optimization target) in a realistic range, for example between -10% and 100%
-
-
Customer Field is the customer ID field. It is used to aggregate data by customers.
-
Product Field is the product ID/SKU field. It is used to aggregate data by products.
-
Volume Measure is the field which indicates the quantity in a transaction.
-
Revenue Measure is the field which provides the transaction price which will be the basis of the analysis. It may be a net price, a gross price… depending on the policy you want to simulate.
-
Margin Measure is also the field providing the total margin of the transaction.
-
Weight Measure is the field which indicates the weight of a transaction. It is optional. If not set, all transactions are weighted equally.
-
Optimization Target is usually the margin percentage field, but it can be another field, depending on the policy to simulate.
-
If needed, create some calculated fields in the transaction Datamart: revenue, margin, if you only have a unit price, a cost; margin rate (i.e., margin / revenue).
The other parameters are general calculation ones. They are above the dataset ones in the interface.
-
Max Cardinality is the largest count of distinct values that a dimension is allowed to have, to be taken into account for price drivers.
-
Min #Transaction in Segment is the smallest size a segment can have. If a segment is too small, it won’t be created and the model will use the above level in the segments tree.
-
Floor Percentile is the percentile of Optimization Target in the segment which will be used to propose a floor optimization target. It is defined for all segments, but after the Segmentation step, it will be possible to change the Floor Percentile segment by a segment in the Company Parameter table called Segments <model_name>.
-
Target Percentile will be used to propose an optimization target value for items whose target is between floor and target before calculation. It is optional; if not provided by the user, the value will be calculated based on each segment score (see the Scoring step below). It is defined for all segments, but after the Segmentation step, it will be possible to change the Target Percentile segment by a segment in the Company Parameter table called Segments <model_name>.
-
Stretch Percentile value will provide a stretch optimization target value in each segment. It is defined for all segments, but after the Segmentation step, it will be possible to change the Stretch Percentile segment by a segment in the Company Parameter table called Segments <model_name>.
-
Policy Start Date and Policy End Date will provide time bounds when using the policy records.
Don’t forget to save the model before continuing. The button is at the top right corner.
If you use a copied model, you also need to save it in the Definition step before continuing.
5. Perform Analyses Before Main Computation (Analysis Step)
In this step, all settings are optional but it is advisable to do at least the DataPrep as it has an impact on the calculation speed in the Segmentation step.
DataPrep Tab
The aim of this step is to materialize the data with all the filters applied. It substantially reduces the processing time of the next steps. Just click the Calculate button at the top right corner.
The resulting table appears on the right of your Definition tab. You can check some values, and the total number of rows.
DataProfile Tab
The aim of this step is to provide to the user a summary of the filtered transactions dataset.
Just click the Calculate button at the top right corner. For each dimension, it calculates Min, Max, # (count), #nulls, #distinct and a sample. It is an optional step. The result table is shown on the DataProfile tab.
By running this step, you will automatically remove from possible segmentation levels those fields which have a too large cardinality (see above, in Define the Model).
PriceDrivers Tab
The aim of this step is to calculate the significance of each attribute (dimension) when used for segmentation. A decision tree is used with the Optimization Target setup in Definition (see above).
To provide a working example out of the box, Pricefx uses a simple CART (regression tree) approach, using Gini in the decision criterion, and the attribute significance follows from that. CART is only used to identify the possible 'price drivers', i.e. for feature selection. At each decision node, the CART algorithm finds the best variable (and value) to use to explain as much variance as possible. Each decision adds to the relevance of an attribute.
The resulting feature ranking is presented to end users who can still select whatever they want as the so called 'segmentation levels'. The segmentation levels then define the segmentation tree, i.e. a node is created for each value of the attribute selected for a given level.
There are two modes of regression:
-
Per Individual Product and Customer – The significance of each dimension is calculated first per customer, then per product. The results allow calculation of average and standard deviation of significance. The base line here is to expect selling the same product to different customers at the same price. And if this is not the case, this mode finds the attributes that explain most of that variance (to the base line).
-
On full Transaction data set – One decision tree is built resulting in one significance value per dimension.
Some important points concerning the dimensions selection:
-
The attributes' (dimensions) correlation is taken into account, so if two attributes are correlated, only one will appear, the other one will be shadowed out by it.
-
If some attributes are not eligible for segmentation (time variables, too high cardinality), they are excluded.
-
Eligible dimensions can be selected in the list, non-eligible aren’t proposed.
Click the top right corner Calculate button after selection of the dimensions you want to take into account. After computation, the interface will show a histogram where the 10 most important dimensions ranked by importance.
By running this step, the Segmentation step will automatically sort all the dimensions from the most important to the least important one and preselect the significative ones.
6. Segmentation Computation (Calculation Step)
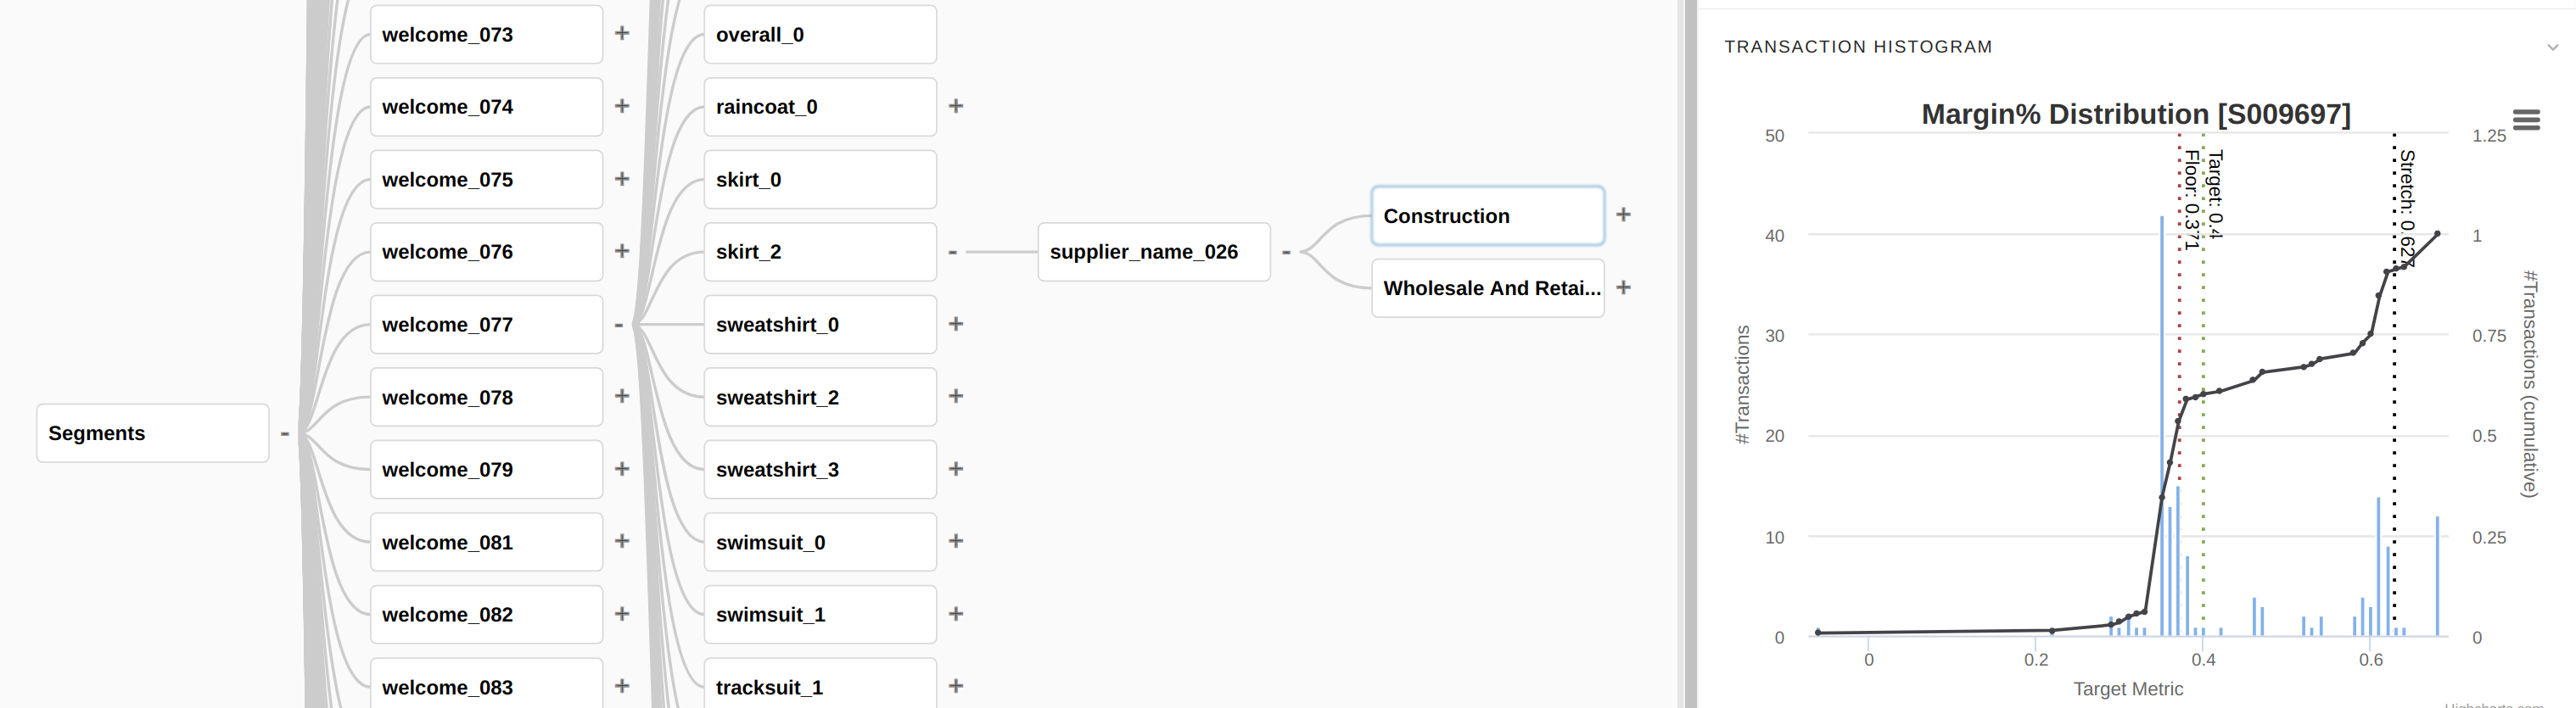
Segmentation Tab
This calculation step defines the segments, based on levels and provides some summary data.
The interface provides a list of all eligible dimensions, based on the DataProfile result, or by default. If the PriceDrivers step has run, they are ordered by their score and the significant ones are preselected. You can change the selection and reorder the attributes by drag-and-drop.
Datamart data are eligible for segmentation based on these rules:
-
Should be categorical data (not money, not integer, not number, not Boolean).
-
Should be a dimension in the Datamart.
-
Should be something that can be found for new transactions, e.g. "date" does not validate, as for new transactions it is not possible to find the date value used for segmentation of historical data.
-
Should not be something the customer would consider inappropriate (e.g. ID of the sales person).
-
Most important are the product attributes.
This step creates all the segments, using the Min #Transaction in Segment parameter (see the Definition step above). This value is a minimal number of transactions allowed in a segment. If a segment contains a lower number of transactions, it assumes the distribution and price recommendations of its nearest parent having enough transactions – the segment with the lower level dimensions is not fixed and does not assume any values.
Company Parameter tables are updated or created:
-
Segments <model_name> is created, only segment names and definitions until now.
-
Model CalcItems <model_name> is updated with 2 rows for each segment: one for Scoring and the other for Pricing. No more data in until now.
-
Restrictions <model_name> is created. For each set of segmentation levels, it will allow the user to provide some restrictions.
The interface shows an Explained Variance table where you can read for each segmentation level:
-
R2 – Indicates how well segmentation reduced the variance of the Optimization Target. The value is always between 0 and 1. A too low value signifies that the segmentations levels don’t reduce the variance enough. A too high value signifies that each segment is totally homogeneous.
-
Other columns (#Transactions, #Customers, #Products, Revenue, Volume, Margin) show the percentage of those values present in segments at each segmentation level.
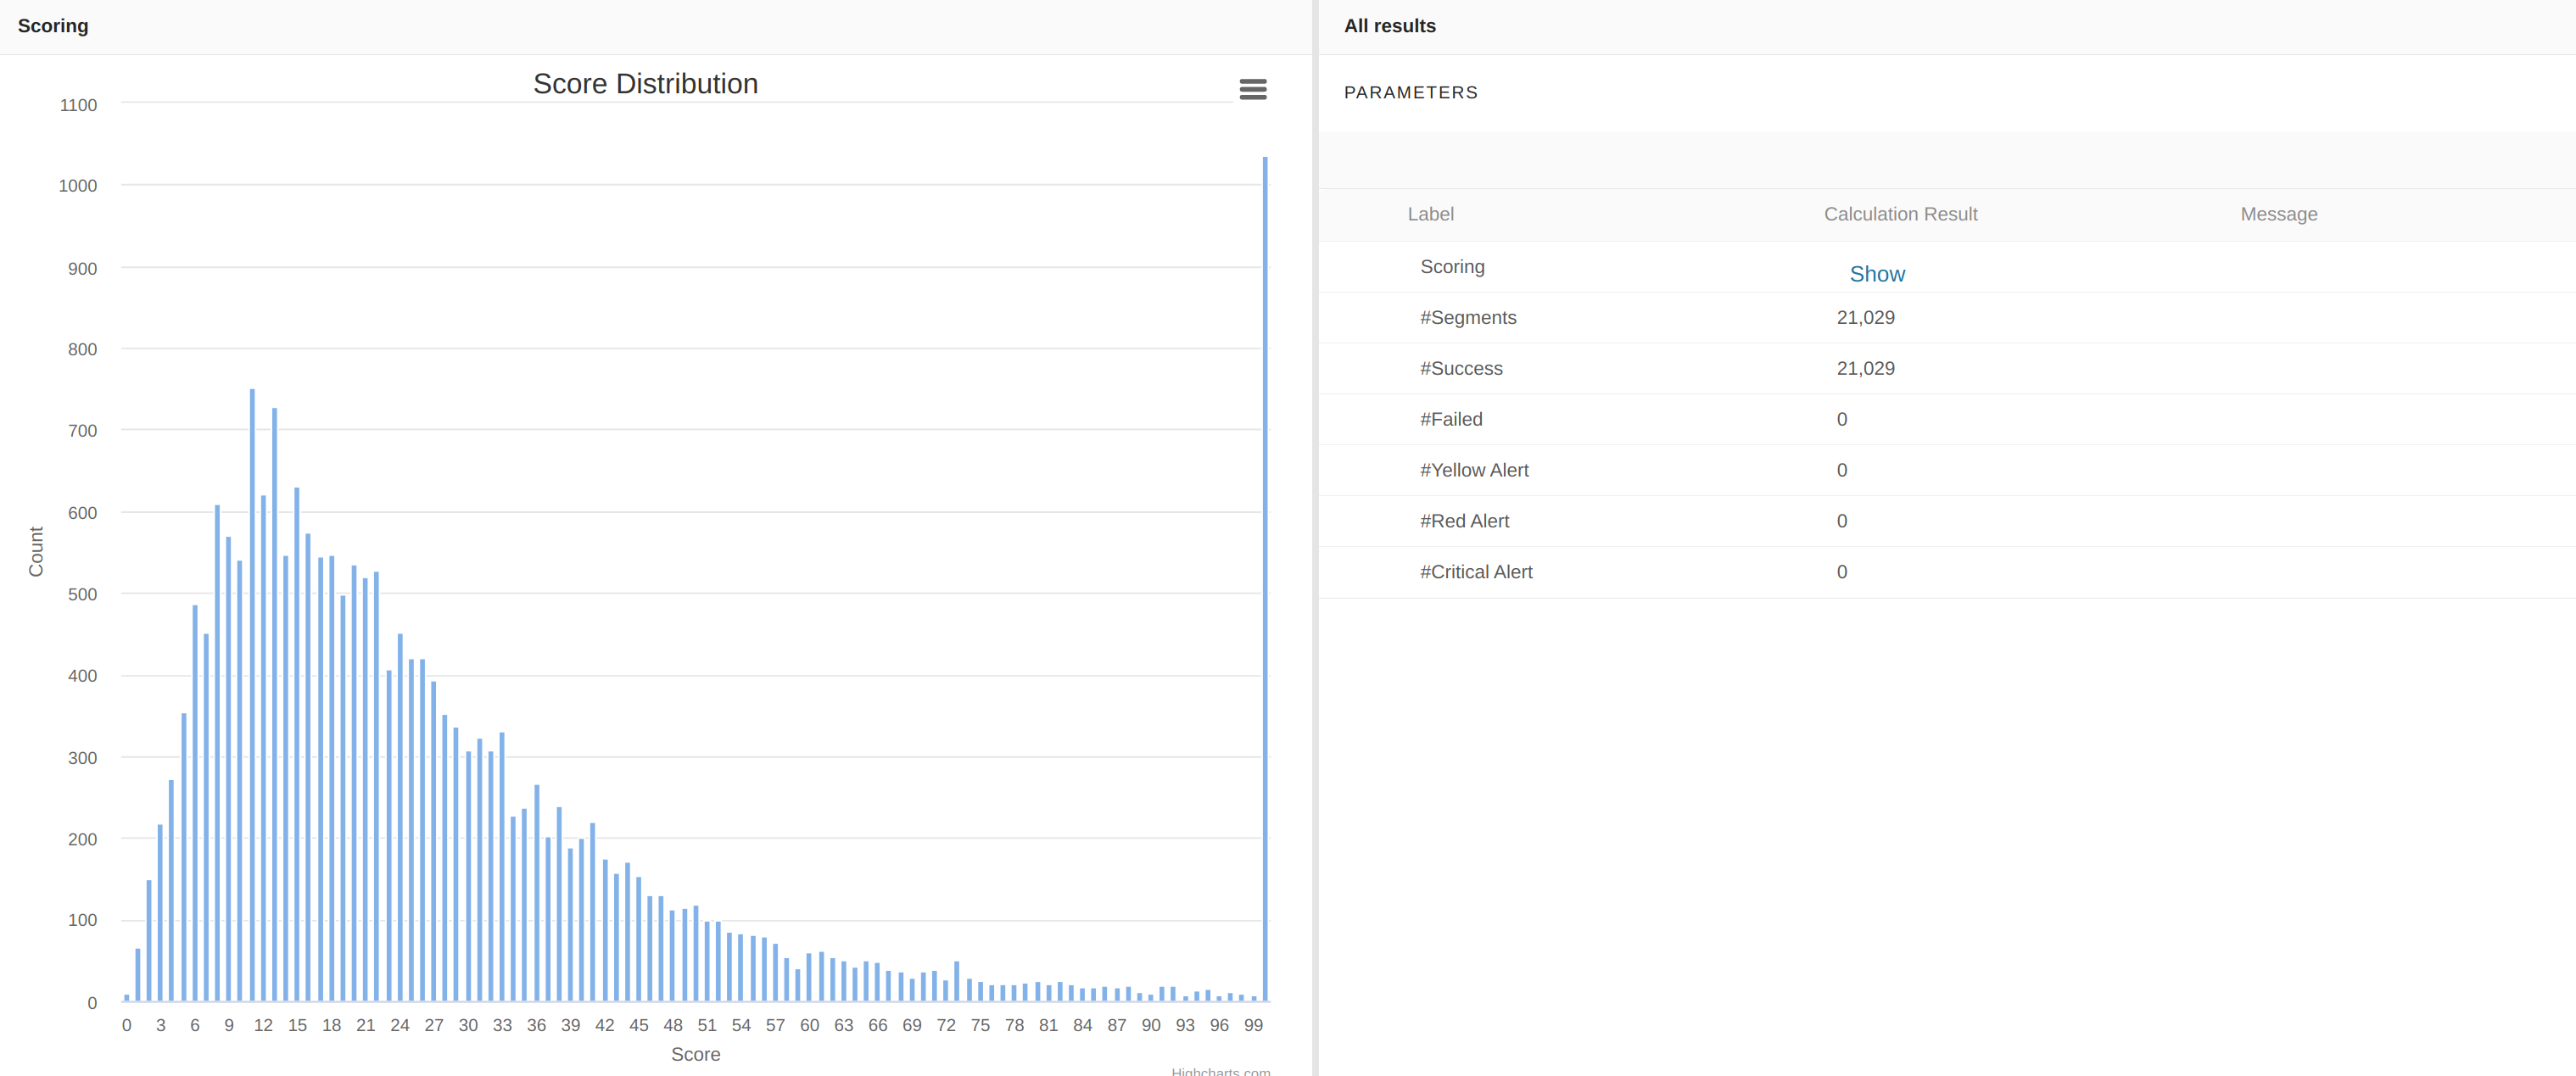
Scoring Tab
This calculation step calculates a score for each segment. The score is used to define a target percentile, if not provided in the Definition step. If you define a target percentile, the score won’t be computed.
There are two possibilities to compute the score.
-
If you have defined a Product Performance or/and a Competitive Intensity for this segment, in the Segment <model_name> Company Parameter table:
-
These values must be in a [1, 5] range.
-
If only one is defined, the other one will be set to 3.
-
The score will be the average value of Product Performance and Competitive Intensity, scaled to provide a score in a [0, 100] range.
-
-
If nothing has been defined before, the score is based on CoV, Coefficient Of Variation of Optimization Target within the segment.
-
Score = k * CoV. The coefficient k is calibrated to mark out the score between 0 and 100.
-
If using Weighted model, CoV is replaced by wCoV (Weighted Coefficient of Variation) above.
-
In each segment, the score is linearly transformed to the target price percentile. For Margin target type, the score = 0 corresponds to the max(floor, 50) percentile and the score = 100 to the Stretch.
In case of Discount target type, the score = 0 corresponds to the min(stretch, 50) percentile and the score = 100 to the floor.
A score distribution is displayed:
Company Parameter tables are updated:
-
Model CalcItems <model_name> provides information on the Scoring calculation step. For example, if a segment scoring calculation step fails, it indicates why.
-
Segments <model_name> provides the score and its calculation method for each segment + floor, target and stretch percentiles.
-
Restrictions <model_name> provides default values for Max Price Increase, Max Revenue Drop, Max Volume Increase and Decrease for the Break-Even analysis.
Pricing Tab
This calculation step calculates the target price percentile for each segment.
It displays the Policy Records table that provides a list of segments together with their definitions and price recommendations. Select a segment row in the table and click “View/edit detail” above the button to display the optimization target distribution inside the segment. A Break-Even Price Curve is also calculated and displayed.
It also displays global price delta distribution along the segments due to optimization. The price delta is calculated for each segment by comparing the segment: (1) reference revenue at current margin and (2) new expected revenue at new margin which is the target margin. By comparing 1 and 2 we get a revenue change which can be interpreted as a weighted-average price change. Note that negative values get ignored.
Policy Records are now filled and you can access them directly in Optimization > Policy Records in the top menu.
Company Parameter tables are updated:
-
Model CalcItems <model_name> provides information on the Pricing calculation step. For example, if a segment pricing calculation step fails, it indicates why.
-
Segments <model_name> provides the floor, target and stretch values.
Caution: If you run an Optimization model in the partition for the first time and get an error on the Pricing step, it may be that the maxPriceOptimizationUsers variable is set to 0 by default. Request an update through Pricefx HelpDesk.
7. View the Results (Results Step)
Go to the Results step. In this panel, you can navigate the segmentation tree.
The information is similar to the Pricing step view and the Policy Records table. Navigation through the segments is intuitive.