Pricefx Agents are intelligent pricing monitors that continuously track conditions, identify outliers, and recommend strategic actions to optimize pricing outcomes tailored to a customer’s business. Each Agent is customizable: choose the data, define dimensions and measures, apply business logic and thresholds, schedule detections, and deliver actions and impact calculations assigned to owners.
Pricefx Agents Explained
Pricefx Agents are intelligent pricing monitors designed to:
-
Track pricing conditions continuously.
-
Identify outliers and anomalies.
-
Recommend strategic actions to optimize outcomes.
Each Agent can be customized to align with unique business logic, customer requirements, and pricing priorities. Agents help detect margin leaks, uncover pricing opportunities, and provide actionable insights in real time.
How to Think About Agents
Agents are most effective when built iteratively:
-
Start fast, refine often. Use initial out-of-the-box Agents as rapid prototypes and improve them iteratively.
-
Define the right dimensions. Enrich comparisons with attributes such as brand, quality, lifecycle.
-
Balance problem detection and opportunity discovery. Create Agents that find margin leakage and those that uncover harmonization or price-increase opportunities without volume loss.
-
Tailor to the channel. Don’t mix fundamentally different channels or segments (e.g., B2B vs. B2C) in a single Agent—create separate variants.
The goal is to create a system that not only alerts you to issues but also points to areas for improvement.
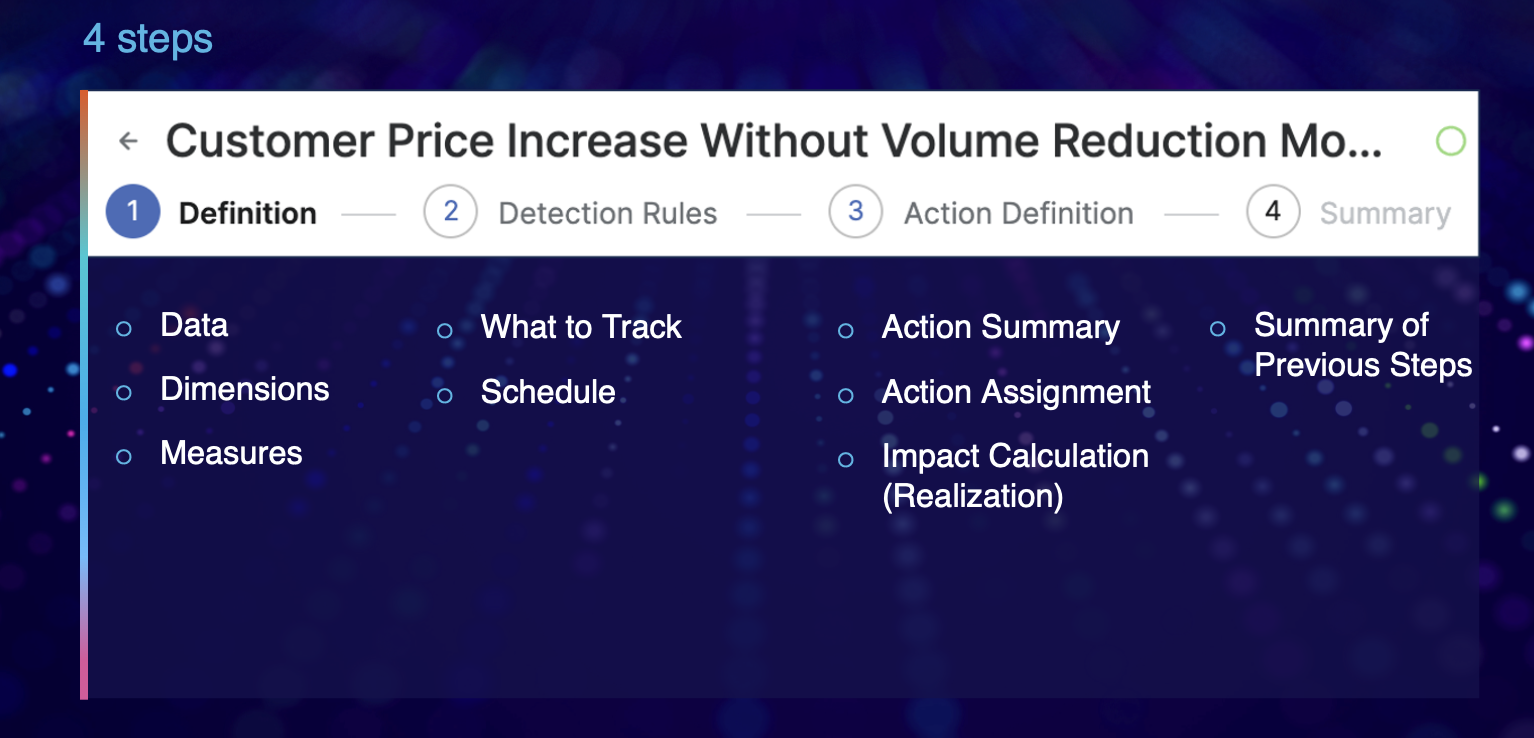
Agent Design (Core Components)
Agents are composed of these key elements (used to design, run and action findings):
-
Data — Transactional and master data sources required.
-
Dimensions — Grouping or segmentation fields (product, customer key, region, brand subcategory, etc.).
-
Measures — Metrics to calculate/trend (margin, revenue, quantity, price deltas).
-
What to Track — The condition/rule/threshold to detect (e.g., margin below group average).
-
Schedule — Frequency of detection (daily, weekly, monthly, quarterly).
-
Action Summary — What the Agent recommends and why.
-
Action Assignment — Who is responsible for follow-up.
-
Impact Calculation (Realization) — Estimated monetary/percentage impact if action is executed.
-
Summary of Previous Steps — Recap context and prior results for continuity.
Pricefx Copilot
Copilot is a conversational interface built into Pricefx’s Sales and Customer Insights dashboards.
It allows you to interact with the platform naturally, using plain language, to navigate workflows, request analyses, and create Agents.
See also: Pricefx Copilot, Pricefx Agents
Think of Copilot as your in-app guide for seamless business flow completion. Create Agents from the Copilot UI or from SI/CI dashboards to accelerate Agent setup and reduce friction.
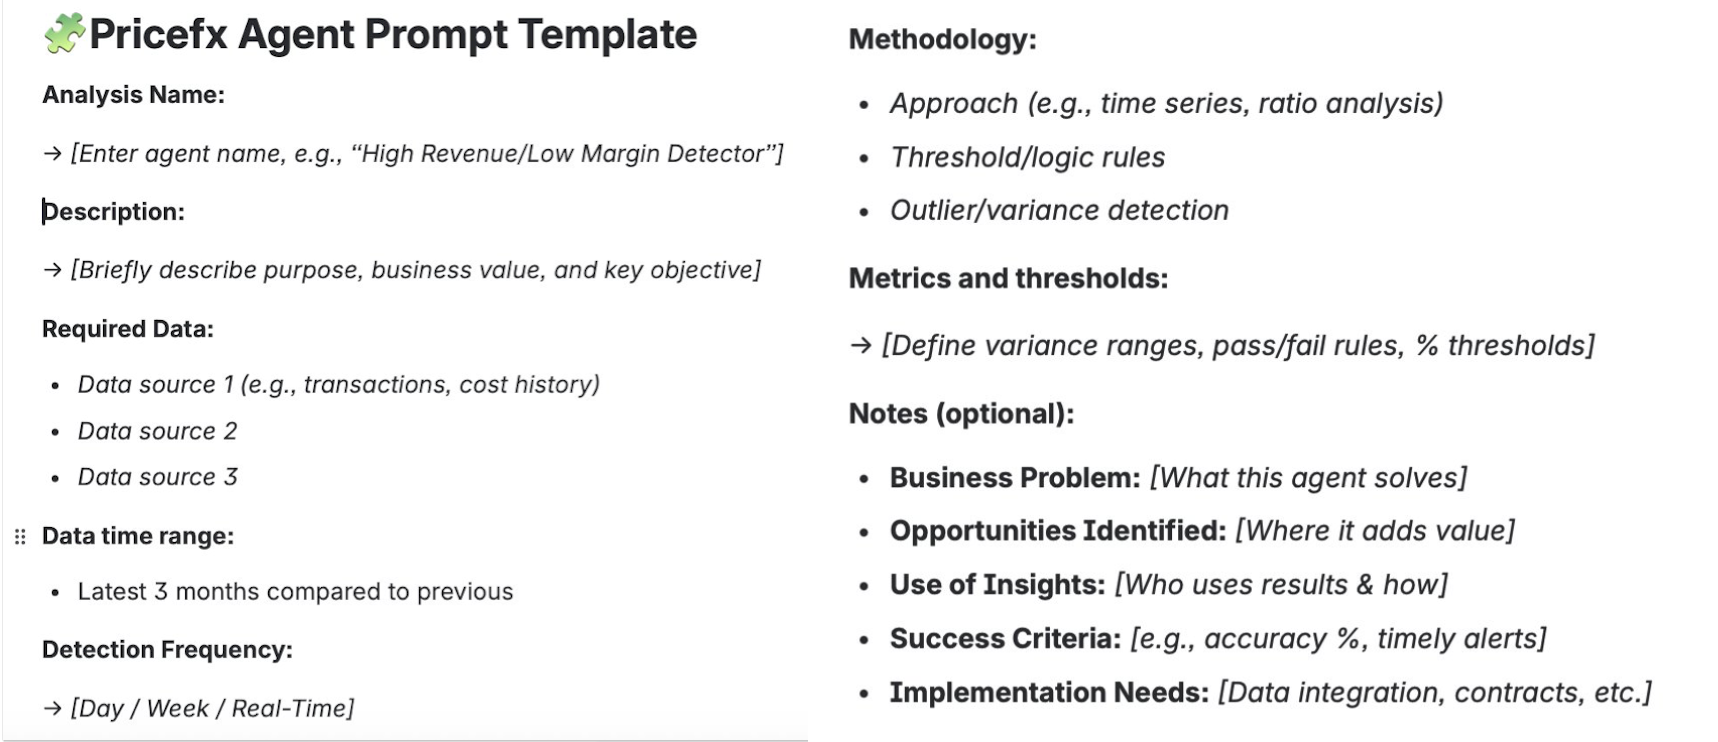
Best Practices for Effective Prompts
Use natural language and be precise about data, segmentation, and measurement logic. Below are explicit recommendations and structural rules to follow for prompts.
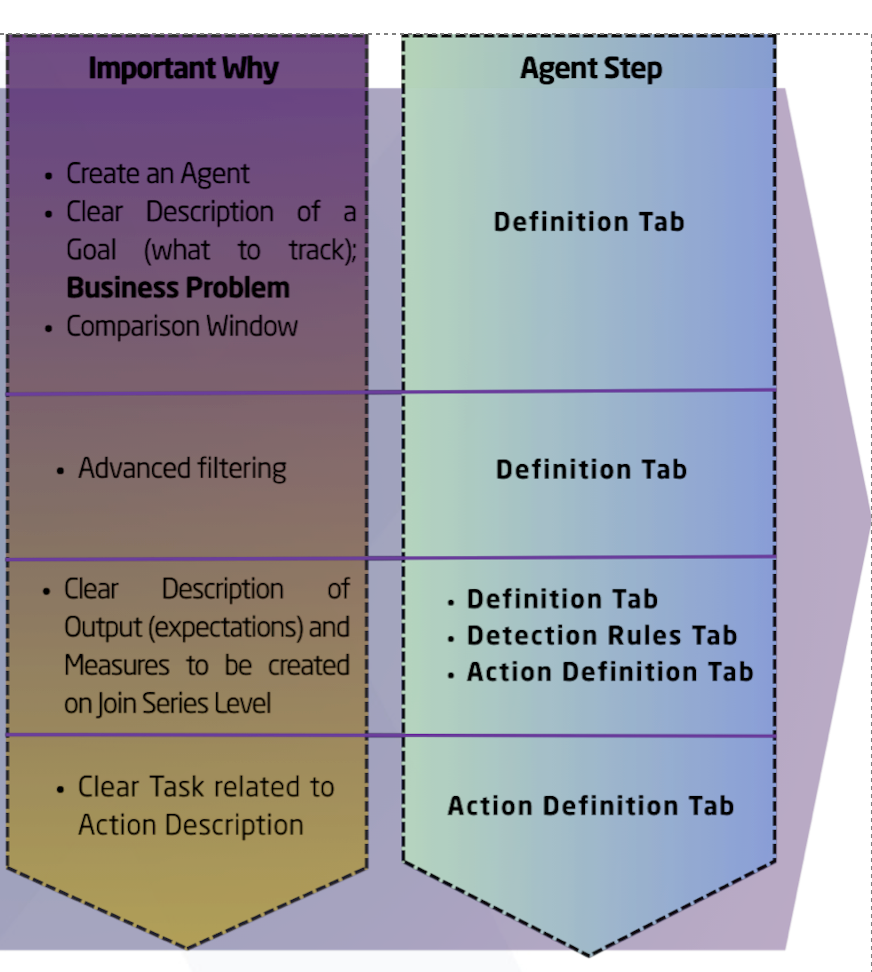
Always include:
-
Begin prompts with Create an Agent.
-
Description - Clear statement of what the Agent should do.
-
Comparison window - (weekly, monthly, quarterly).
-
Filtering / criteria - e.g., exclude low-volume products ( >100 units sold).
-
Desired output format - list, table columns, action integrated.
-
Outcome - Every Agent’s outputs should feed into an Action description.
Tips
-
Use natural language.
-
Know your data labels in Datamart and measure formulas.
-
Know your segmentations and how aggregation should behave.
-
Refer to the Agents List and clearly articulate the Agent’s goal so the created Agent can be assessed for completeness.
-
Do not use special characters inside prompts.
Example: Margin Optimization Agent (Natural Language)
Create an agent that finds individual products whose average margin is lower than the average margin of their product group on a quarterly basis. The agent should quantify how much the margin could improve for each product if it matched the group average, helping to prioritize which products have the most margin uplift potential within your portfolio. Exclude products with < 100 units sold.
Output a list of underperforming products with possible margin gain. Also generate a summary table with columns: Product Group, Product Average Margin, Group Average Margin, Potential Margin Gain, Margin Gap. All outputs should be integrated into the action definition.
Agent Elements Breakdown and Examples
Example 1
Analysis Name: Margin Inconsistency Agent
Description: Detects and quantifies margin inconsistencies across products, customer keys, regions, or product brand subcategories; identifies statistically significant deviations vs. expectations, historical trends, or peer benchmarks. Highlights outliers linked to execution issues, pricing policy breakdowns or data quality gaps.
Required Data: Transaction-level margin data; customer key/product/region/product brand subcategory master and segmentation data; comparison bands/targets; historical margin averages/trends.
Methodology:
-
Distribution & variance analysis (IQR, standard deviation).
-
Peer group benchmarking, time-series trend comparison, deviation scoring.
-
Threshold-based outlier detection and attribution.
-
Outlier Box Plot detection to flag instances more than 2% below average/target (focus on negative deviations).
Detection Frequency: Quarterly.
Output Type: Action (prioritized list).
Output Content: Prioritized list of margin inconsistency outliers by product, customer key, region, and product brand subcategory, with financial impact quantification, root cause indicators, and recommended harmonization/correction actions.
Prompt Body
Margin Inconsistency Agent (Natural Language)
Create an agent that identifies products, customers, regions, and product brand subcategories where the realized margin in the most recent quarter fell more than 2 percentage points below their benchmark (policy target, peer cohort median or historical average). Estimate potential margin recovery for each entity if restored to benchmark, expressed in percentage points and monetary value, and rank cases by financial exposure and speed of change.
Example 2
Analysis Name: Cost Pass Through Agent
Description: Analyzes input cost changes over time and identifies products/customers/segments where price increases did not sufficiently reflect cost increases (pass-through gaps).
Required Data: Invoice/transaction data (product, date, price, quantity, customer); COGS history by product/SKU; product/customer hierarchies; pricing agreements/contracts; cost change effective dates and magnitudes.
Methodology:
-
Time-series analysis of cost vs. price deltas by product/segment.
-
Margin band analysis pre/post cost change.
-
Compare realized price increases vs. underlying cost changes using threshold logic (e.g., price change < 80% of cost increase over set period).
Output Content: Lists/tables of products/customers with insufficient cost recovery, quantitative gap analysis by product/customer/segment, and visualizations (cost vs. price line graphs, margin band shifts).
Business Problem Addressed: Ensures timely recovery of input cost increases, particularly in inflationary environments.
Opportunities Identified: Products/customers where cost increases are not reflected in selling prices and risk areas for sustained margin erosion.
Success Criteria: Pinpoint at least 95% of transactions where price increases lag cost changes by >10% within 30–60 days of the cost move.
Thresholds: Standard pass-through threshold typically 80–90% of cost move within 30 days; gaps below threshold trigger review.
Implementation Notes: Requires robust, timely cost and price data integration; alignment on cost basis (standard vs. actual); segmentation for contract/agreement types.
Prompt Body
Cost Pass Through Agent (Natural Language)
Create an Agent that identifies products, customers, or segments where input cost increases have not been fully reflected in selling prices. Compare cost and price changes over time using transaction, cost, and contract data. Flag cases where price increases are less than 80% of cost increases within 30 days.
Provide a table showing the recovery percentage, shortfall amount, and financial impact by product, customer, and segment, along with simple visualizations of cost vs. price trends.
The goal is to highlight cost pass-through gaps and margin erosion risks so pricing teams can take corrective action quickly.
Inside Your Agent — Practical Best Practices
Data & Series
-
Use consistent Data Series (e.g., Series 1 & 2 when comparing two periods).
-
Pay attention to segmentation levels, measure labels (Datamart vs Agent labels), and aggregation types.
Filters & Sanity Checks
-
Set a global filter on transaction type—only include “Orders”. Exclude
"Credit memo","Debit memo","Quote","Returns", etc. -
Enforce basic sanity rules: quantity > 0, revenue > 0 (excludes returns/corrections that would produce spurious outliers).
-
If data tables contain lines with NULL results, filter them out at the Detection Rules level.
Segmentation & Comparability
-
Never mix fundamentally different channels (B2B vs B2C, wholesale vs end-user) in one Agent; create separate Agents per channel.
-
When comparing a product to its product group, incorporate quality or other key attributes (e.g., A/B/C quality) so comparisons are like-for-like.
-
Segment on lifecycle/product groupings and other business-defining attributes (e.g., automotive service vs. collision parts) so comparisons and thresholds make sense.
Modeling & Formulae
-
Learn and use the Formula Editor to express custom measures and aggregations when needed.
-
Be explicit about measure formulas and the expected aggregation (sum, average, weighted average, etc.).
Output Types & Action Integration
-
Action outputs are preferred: Agents should generate prioritized action items, not just passive alerts.
-
Integrate outputs into an Action description that includes: recommended correction/harmonization steps, prioritized list by financial exposure, and assignment to responsible owners.
-
Include Impact Calculation (realization) to show the potential benefit (monetary and percentage) of taking action.
Detection Frequency & Scheduling
-
Choose detection frequency according to the business need and volatility: e.g., margin inconsistency - quarterly; cost pass-through - depends on cost-change frequency (could be rolling windows).
-
Use a comparison window matching business cadence (weekly, monthly, quarterly).
Outputs & Visualizations
-
Typical outputs include:
-
Prioritized lists (entities + potential impact).
-
Summary tables with required columns (see Margin Optimization example).
-
Visualizations (cost vs price lines, margin band shifts, box plots for outliers).
-
-
Where applicable, include root cause indicators and recommended corrective measures.
Example Outputs
For the examples provided in this reference, these are the expected outputs.
-
Margin Optimization Agent: list of underperforming products + a summary table (Product Group, Product Average Margin, Group Average Margin, Potential Margin Gain, Margin Gap).
-
Margin Inconsistency Agent: prioritized margin outliers by product/customer/region/subcategory with financial impact and recommended actions.
-
Cost Pass-Through Agent: list of products/customers with insufficient price recovery, gap analysis, and visual trends.
Implementation & Operational Notes
-
Data readiness is critical. Agents require clean, timely transaction and master data (price, quantity, COGS, effective dates, contract details).
See Also: Data Readiness Methodology
-
Contract/Agreement awareness. Include pricing agreements and contract clauses (e.g., cost-plus terms) to avoid false positives.
-
Threshold alignment. Ensure thresholds reflect policy and commercial realities (e.g., pass-through thresholds, margin gap limits).
-
Stakeholder alignment. Assign clear ownership for each action; provide a digestible action summary for sales, pricing, and commercial teams.
Summary do’s and don’ts
-
Start with an out-of-the-box Agent and iterate.
-
Use natural language prompts that start with “Create an Agent”.
-
Integrate outputs into Actions with owners and impact calculations.
-
Filter transaction types and enforce sanity checks.
-
Segment properly and compare like-for-like.
-
Mix channels (B2B with B2C) or incomparable product types in the same Agent.
-
Use special characters in prompts.
-
Forget to remove NULL rows or to apply order-type filters (returns/credits distort results).
-
Omit contract/agreement context when pass-through or contractually constrained pricing is relevant.
Agents Creation Demo Video
Agent Assesment Dashboard Demo