Result Functions

The following API functions are available:

Name and Link to API Doc

Code Example

attributedResult

How to display a traffic light image in the Price List column: 

Groovy
def image = '/images/small_trafficlight_green.png'
return  api.attributedResult('').withRawCSS('background:url("'+image+'"); height:20px; width: 53px;')

buildFlexChart

The FlexChart has been deprecated as of version 3.7.

criticalAlert


newGauge

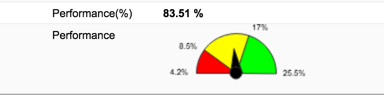
Creates a new gauge object that can be further customized.

If the Gauge is returned as the result of an element, it will be rendered on the screen.

info  See also How to Add a Gauge Chart to Line Detail and Header.

Groovy
def g = api.newGauge()
g.setMin(5)
g.setMax(95)
g.addSector(20, "#FF0000")
g.addSector(50, "#FFFF00")
g.addSector(null, "#00FF00")
g.setValue(37)
image2016-6-30 12:48:21.png

newMatrix

Creates a matrix (data-table) which can be displayed on a Dashboard, Quote, Price List, ...

Given that you have a logic with following logic in element:

Groovy
def resultMatrix = api.newMatrix("Customer Id","Name","Net Margin %")

resultMatrix.addRow([ "Customer Id" : "C1", "Name" : "While Customer",  "Net Margin %" : 10.4  ])
resultMatrix.addRow([ "Customer Id" : "C2", "Name" : "Green Customer",  "Net Margin %" : 4.4  ])
resultMatrix.addRow([ "Customer Id" : "C3", "Name" : "Blue Customer" ,  "Net Margin %" : 1.4  ])

return resultMatrix

When you run the logic in the Price List,

then you will see something like this:

image2016-9-21 19-4-13.png

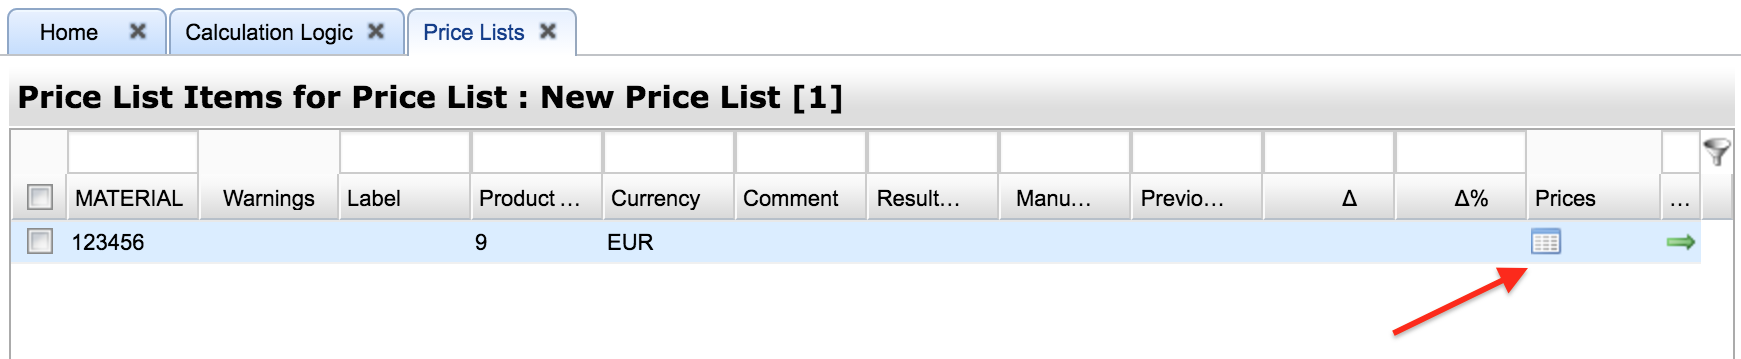
After clicking on the "table" icon you will see this popup window:
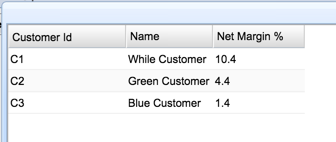
image2016-9-21 17:22:37.png

redAlert


removeManualOverride


yellowAlert