📽️ Check out a video demonstration for this use case, here.
Use Case Situation Description
The chemical industry is constantly evolving, and it is essential to keep up with the pace. To thrive in this dynamic landscape, optimizing rebate performance and ensuring complete financial visibility are a must. This can be easily achieved by leveraging analytics KPIs, which can unlock a multitude of benefits. With enhanced visibility into rebate performance, chemical industry players can identify areas for improvement, maximize profitability, and mitigate revenue leakage. Real-time data-driven insights allow for informed decisions and proactive strategy adjustments to keep you ahead of the competition. While most pricing practices are currently experiencing hurdles in the way of reaching this goal, with Pricefx you can move ahead of the curve.
Prescriptive Design Requirements
As a [Pricing Manager/Sales Rep], I want to have visibility on the progress of sales versus the rebate objective throughout the rebate period agreements, so I can:
-
Incentivize customers to achieve the set targets where needed
-
Understand the likelihood of making the rebate payout at the end of the rebate period
The overall design requirements are summarized in these articles:
User Stories
These are the epics and user stories that make up this use case.
Data Requirements
The following tables can be either manually loaded in Pricefx via Pricefx Excel Client or can be automatically integrated using CSV files in a Pricefx dedicated SFTP folder:
-
Price Waterfall data (typically based in invoice line items)
-
If applicable, forecast data on customer/product level
Out-of-Scope
Out-of-scope business functions and features can be configured, but not included in the Chemical Industry Catalog.
-
Any Reporting and Dashboards, other than the ones explicitly mentioned above
-
Applying changes to or creating any new Rebate Agreements (this is CHEM12)
-
Notifications and alerts
-
API method integration
-
Customer-Facing templates with calculated prices
Solution Design
Portlets
-
The dashboard has portlets that show:
-
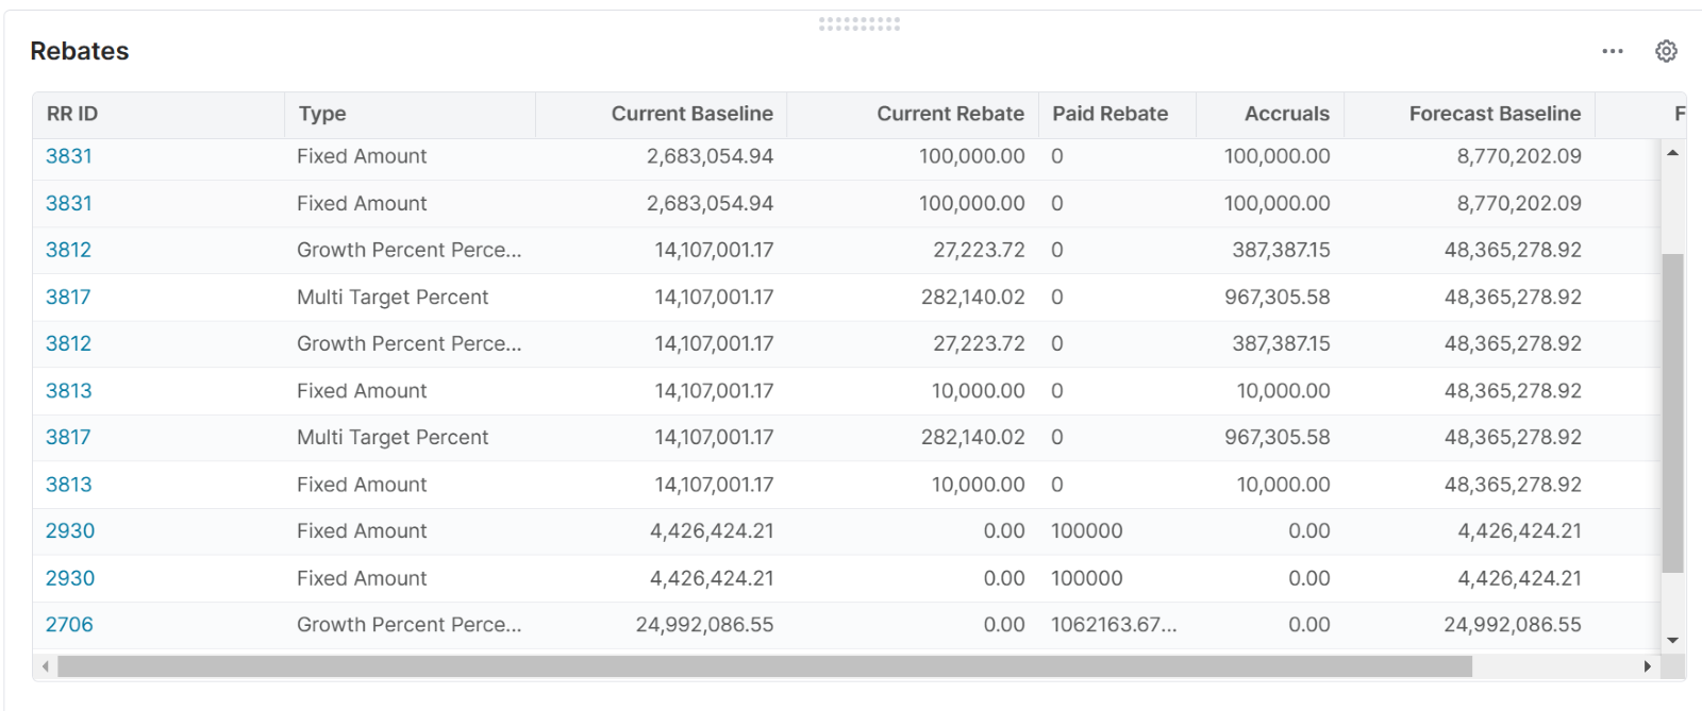
Per Rebate Record the targets, the actuals, the accruals and the payouts
-
The portlet will use data from the Rebate Records and the Price Waterfall Datamart
-
RR ID – ID of the rebate record
-
Type – Rebate Type
-
Current Baseline – Sum of the Base Line of the Rebate Records
-
Current Rebate – Sum of the Rebate from the Rebate Records which are not approved
-
Paid Rebate - Sum of the Rebate from the Rebate Records which are approved
-
Accruals – Sum of Forecast Rebate of Rebate Records - Paid Rebate
-
Forecast Baseline – Sum of Forecast Baseline of the Rebate Records
-
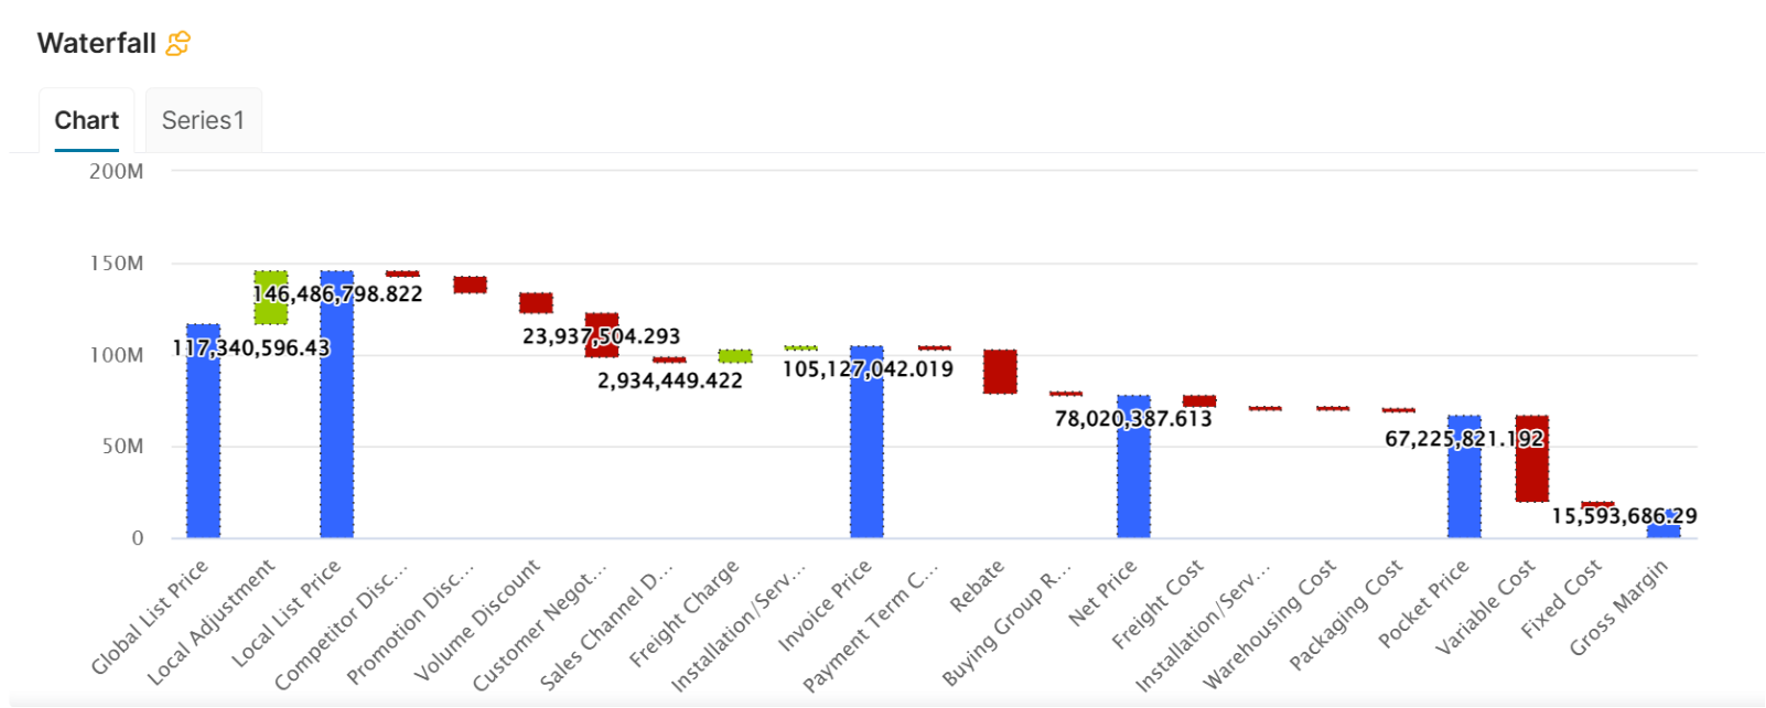
Complete price waterfall
-
The portlet uses the data from the Waterfall Datamart to build the chart
-
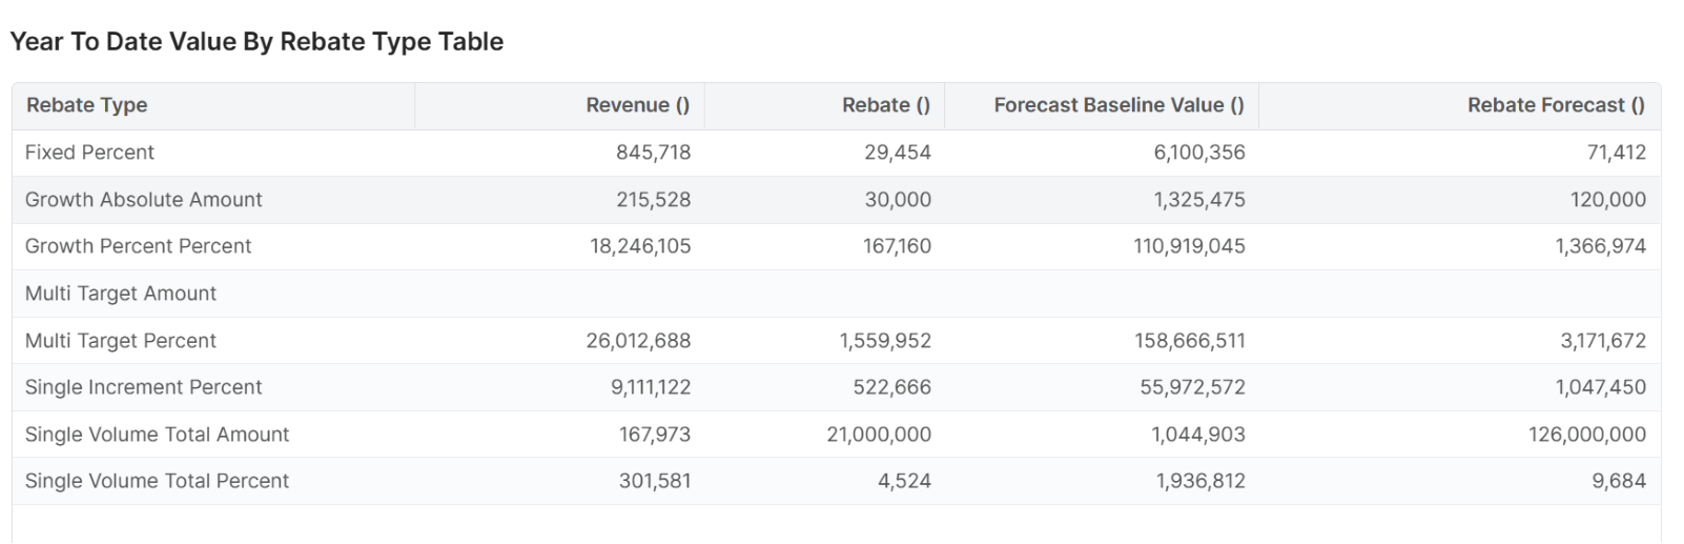
Year to date summary table with the values per rebate type
-
The portlet will use data from the Rebate Records and the Price Waterfall Datamart
-
Rebate Type: Rebate type of the rebates
-
Revenue: YTD revenue of the Rebate type
-
Rebate: YTD Rebate of the rebate type
-
Forecast Baseline Value: YTD Forecast Baseline Value
-
Rebate Forecast: YTD Rebate forecast
-
-
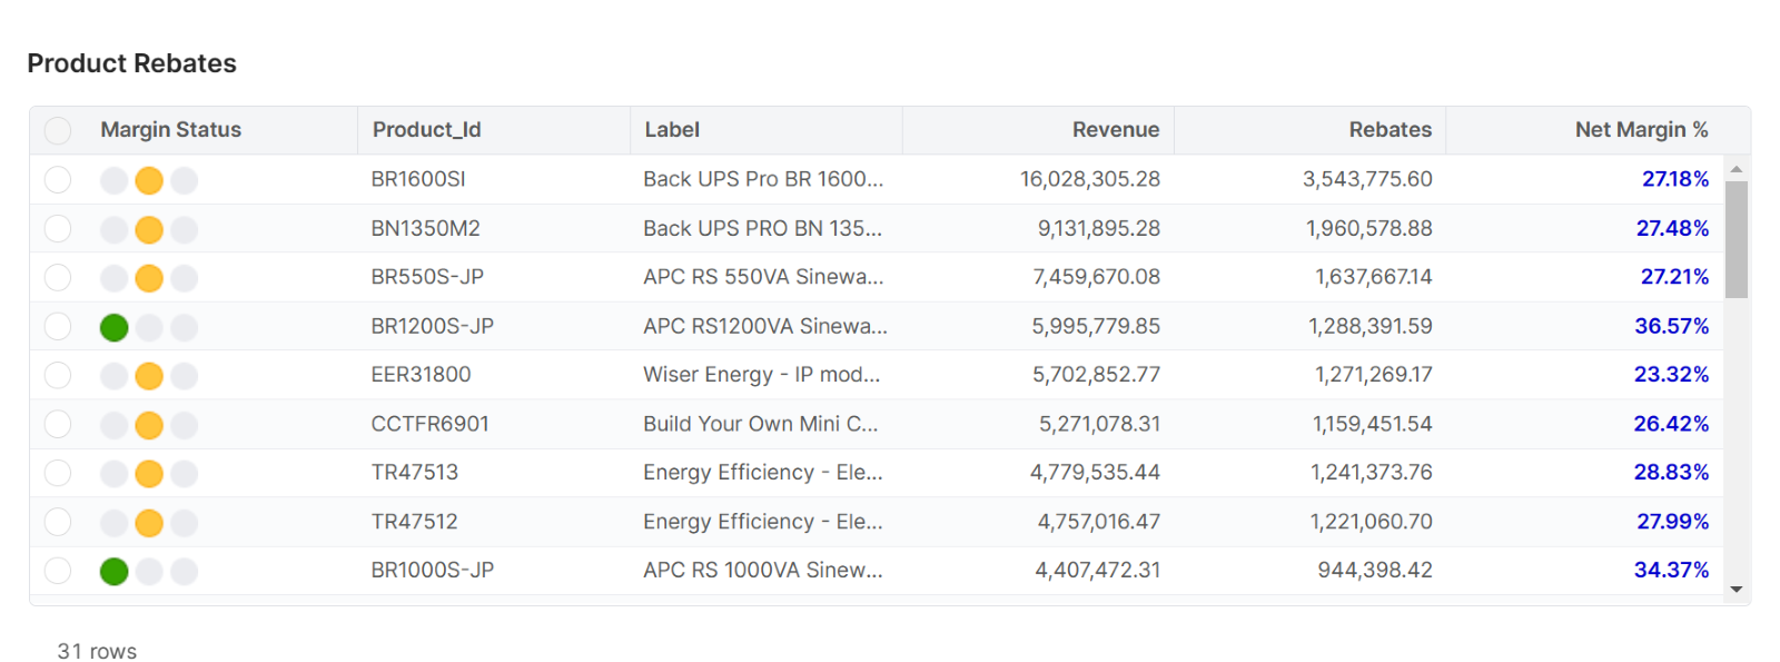
Product rebates
-
Product Rebates portlet that show the revenue, rebates and margin % data summarized by product:
-
The portlet will use data from the Price Waterfall Datamart
-
Margin Status:
-
Red: margin <= 5%
-
Yellow: margin > 5% and margin <= 30%
-
Green: margin > 30%
-
Product_Id: Product Id of the product from the product master
-
Label: Label of the product from the product master
-
Revenue: Sum Revenue of the product
-
Rebates: Sum Rebate of the Product
-
Net Margin %: Sum margin / Sum revenue
-