📽️ Check out a video demonstration for this use case, here.
Use Case Situation Description
In this use case we are looking at how leveraging quoting analytics KPIs improves seller performance and governance in selling products or services. Tracking metrics enhances decision-making, optimizes pricing, forecasts sales accurately, and identifies sales opportunities. In Pricefx you can control risk management, efficient resource allocation, and customer insights. Process efficiency, benchmarking, and data-driven accountability will result in improved customer satisfaction and reduced revenue leakage.
Calculations
-
Win/loss percentage = (Total deals won / Total opportunities) * 100
Prescriptive Design Requirements
As a Sales Manager, I want to provide to my team direct decisions support in the quote and access real-time and robust Sales performance indicators to use as support for the regular checkpoints I have with my team, so I can:
-
Improve sales confidence, efficiency, and goal achievement
-
Improve individual sales management coaching and performance visibility
-
Get higher sales team retention and satisfaction
-
Improve business contribution margin
The overall design requirements are summarized in these articles:
Functional and Non-functional Requirements
For this use case, the functional requirements are:
-
Ability to get Sales contextual decisions support from quotes inline analytics
-
Ability to view time series history of revenue over time compared to guardrails
-
Ability to get benchmark analysis of quotes compared to recent past transactions versus guardrails
-
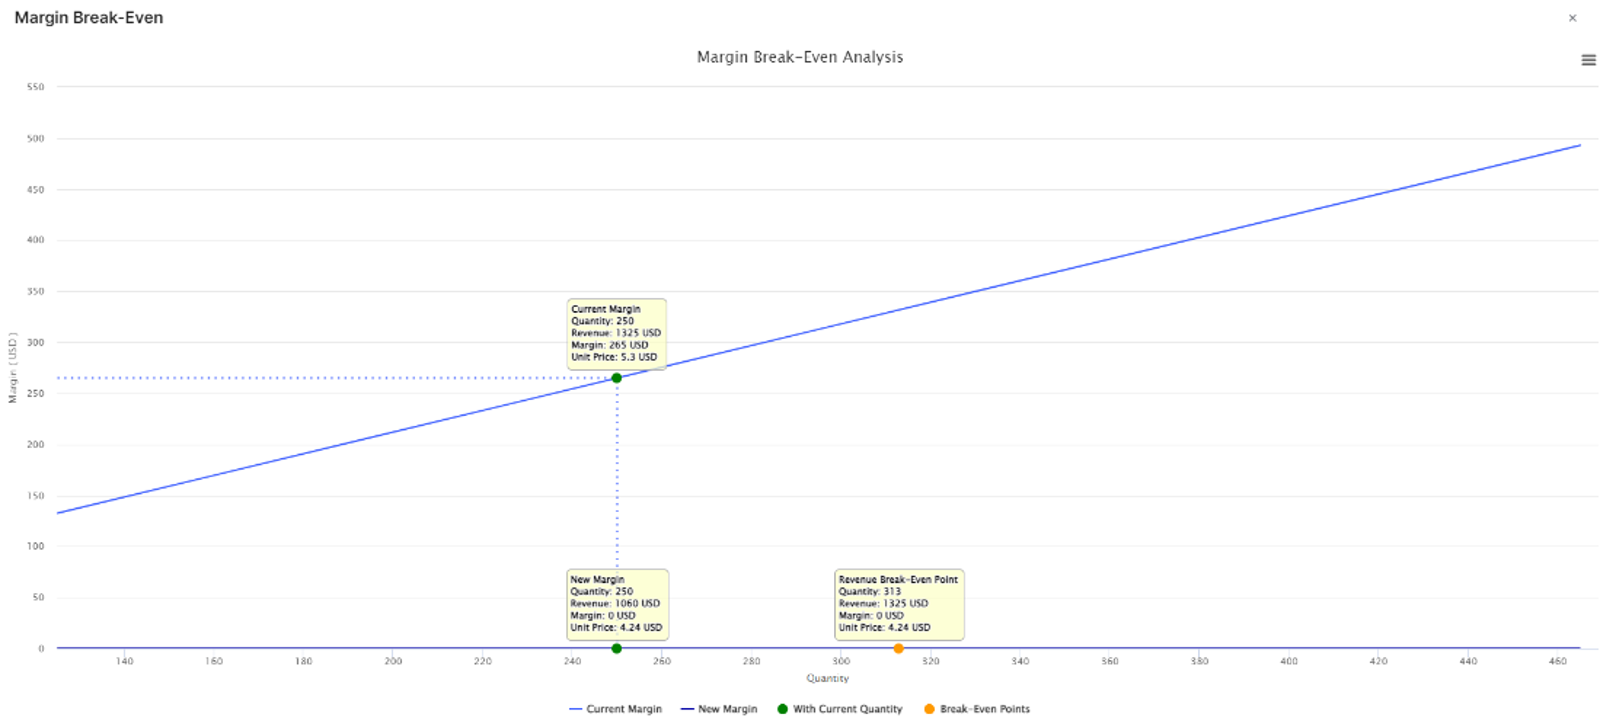
Ability to get revenue and margin break-even analysis
-
Ability to get a dashboard where up-to-date predefined governance and performance management metrics are collected
-
Ability to get context on in and out compliance deals
-
Ability to combine compliance analysis with win/loss data
-
Ability to switch level of granularity of the reporting using filters
-
The dashboard has the following filter options:
-
Ability to get a dashboard where up-to-date Win/loss metrics are collected
-
Ability to access win/loss ratio per multiple dimensions to compare performance per: Products Groups, Regions, or Sales representatives
-
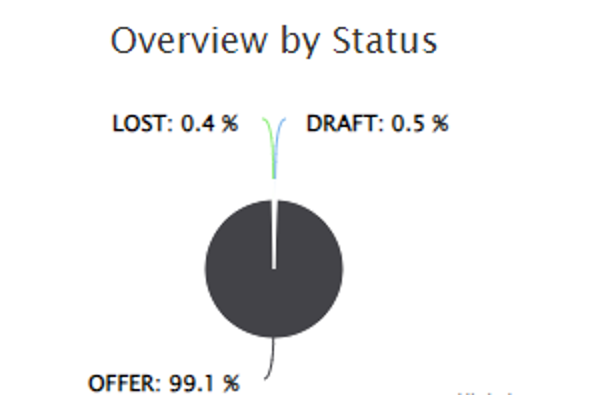
Overview by Status
-
Ability to switch level of granularity of the reporting using filters
-
The dashboard has the following filter options:

-
Ability to get a dashboard where up to date KPIs and benchmarking metrics are collected
-
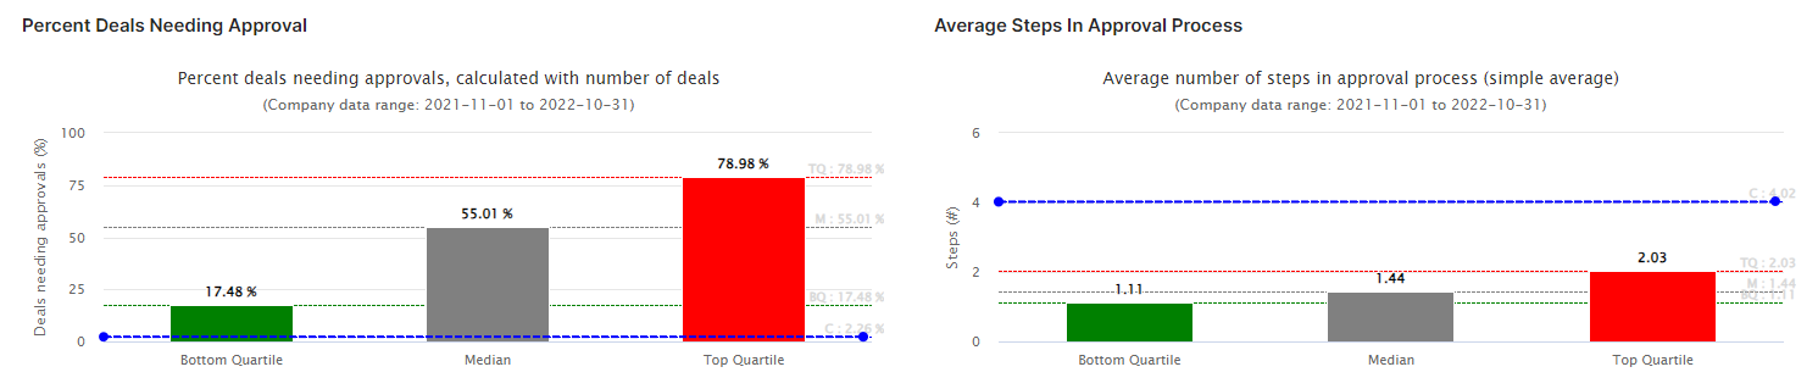
Ability to track percent of deals needing approvals and average number of steps in approval process compared to benchmarking, meaning an external dataset constituted of best-in-class customers
-
Ability to download portlets in various formats (PNG, PDF...)
Non-functional requirements
User Stories
These are the epics and the user stories that make up this use case
Data Requirements
The following tables can be either manually loaded in Pricefx via Pricefx Excel Client or can be automatically integrated using CSV files in a Pricefx dedicated SFTP folder:
-
Basic Master Data (See CHEM00)
-
Quotes Data
-
Transactions Data
Out-of-Scope
Out-of-scope business functions and features can be configured, but they are not included in the Chemical Industry Catalog.
-
Any reporting other than the ones explicitly mentioned above
-
Any customization of reporting in scope
-
Additional reporting filters
-
User entitlement of the dashboard
-
Data Integration
-
Ability to set up Science based guardrails
-
Ability to set Guardrails based on business rules
Solution Design
Win/Loss Data
We need to create a dashboard with a Data filter and 5 portlets.
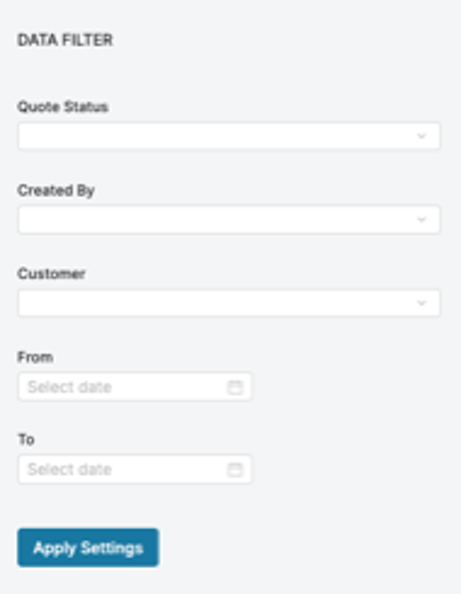
Quote Status: Drop down with Hardcoded values Offer, Deal, Lost, Draft
Created By: Drop down list with Users
Customer: Drop down list with Customers
From: Date picker
To: Date picker
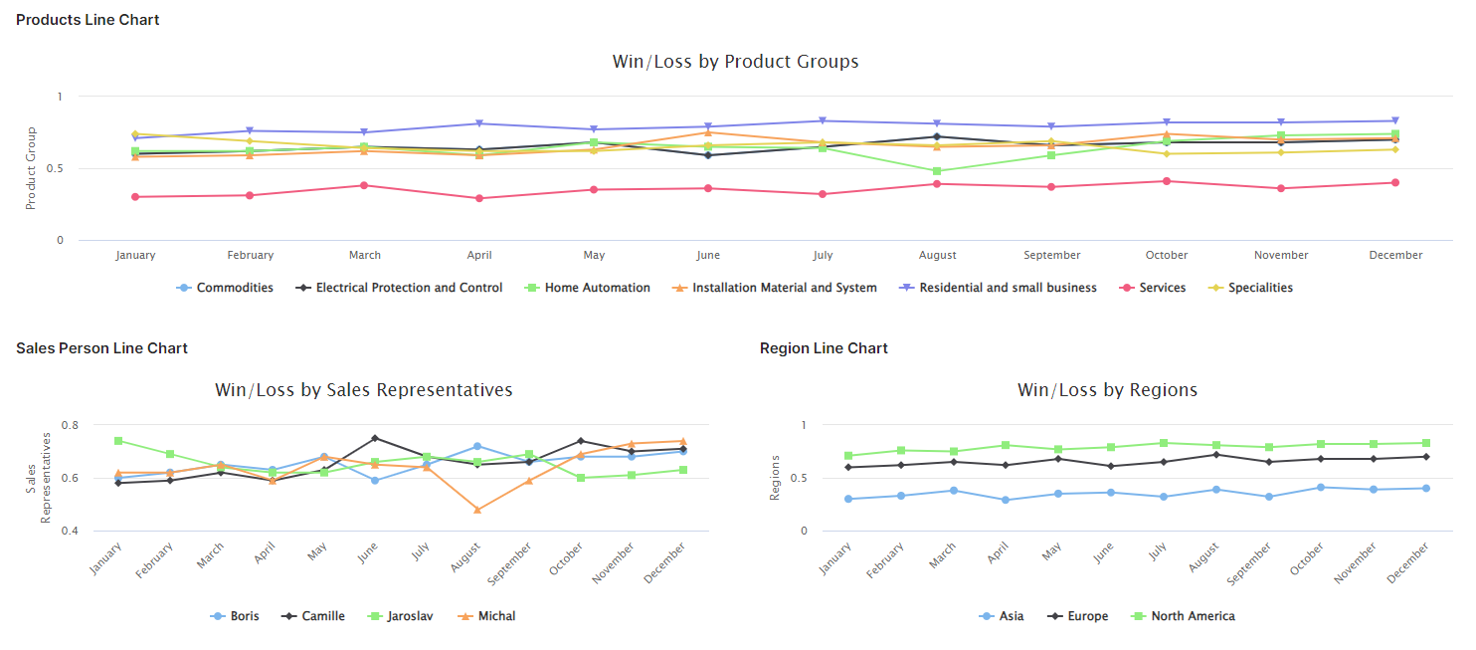
Region Line Chart
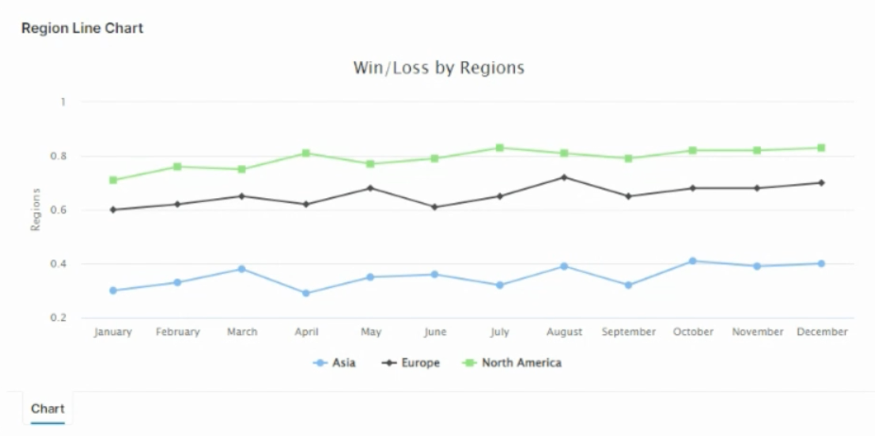
We need to create Header quote input to hold the Region of the Quote and can be stored also as Extra info 3 in the quotes overview table.
The Region input can be pre-populated with the ability to override. For auto filling the field we need to receive region of each customer so based on the customer selection on the quote we can pull the Region.
Then after querying all the existing quotes using the Data filter, we can group them By Region and Month and calculate the win/loss ratio.
Product Line Chart
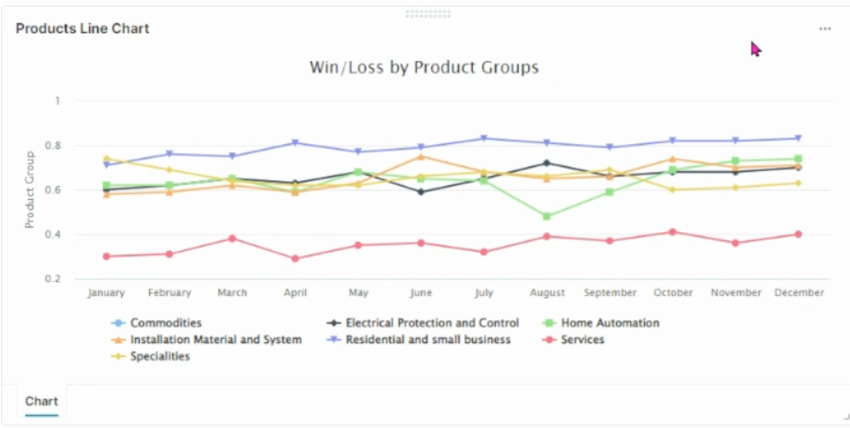
Requirement is that we need to receive product data that contains the product group and use it as output in the quote line-item logic.
Then we need to query all the quote line items based on the Data filter and group them by product group and calculate the win/loss ratio .
Pie Chart Overview
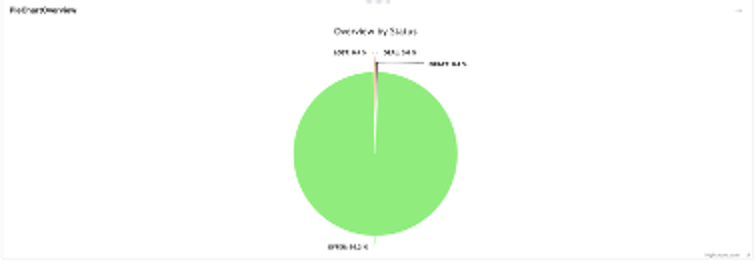
We need to query all the quotes based on the Date filter and group them by the status .
Sales Person Line Chart
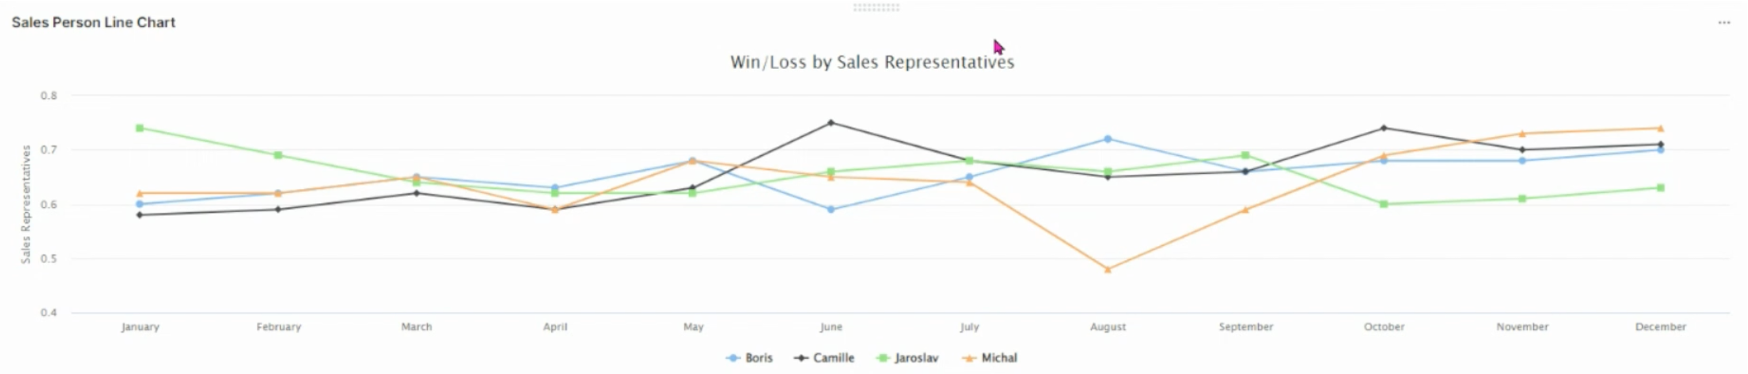
We need to create Header quote input to hold the Salesperson of the Quote and can be stored also as Attribute extension in the quotes overview table.
We can have a customer extension table to assign Salesperson to Customers, then based on the selected customer we can pre-populate the field with the ability to override.
Then after querying all the existing quotes based on the Data filter, we can the group them by Month and User to calculate the win/loss ratio.
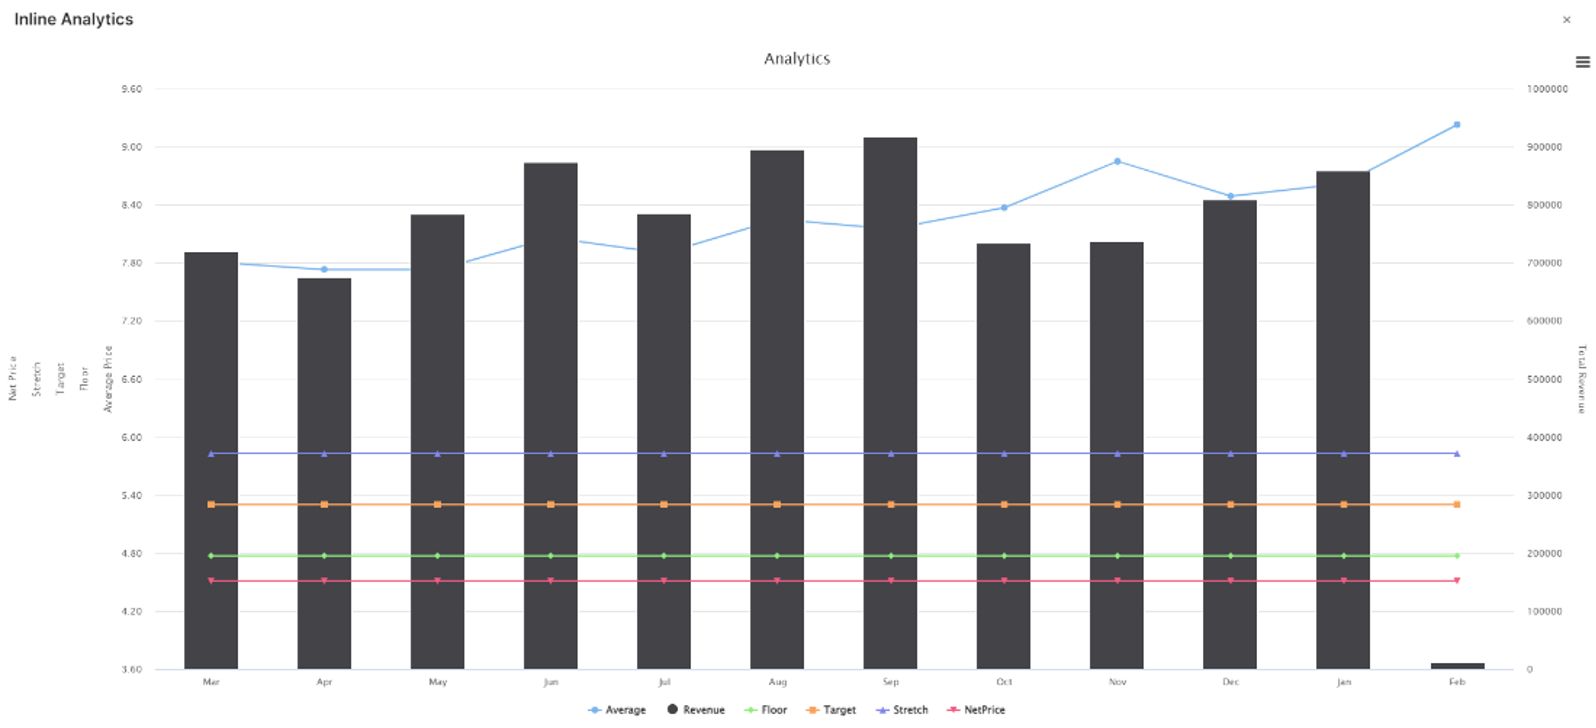
Inline analytics - time series history of revenue
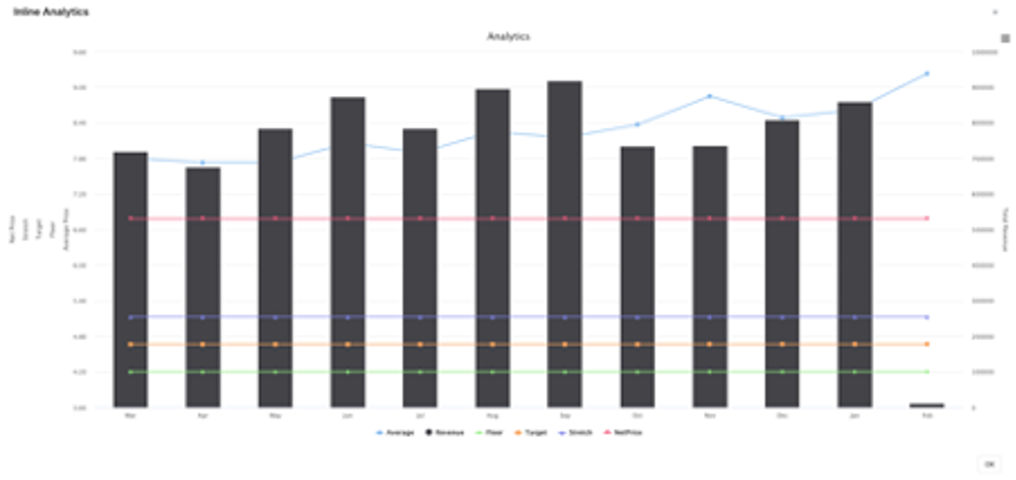
Requirement is that we need to have all the available Data in the Transactions Datamart
We need to query the Transactions Datamart and get the following Data
-
Average: Average Net Price
-
Revenue: Sum of Invoice Price
And group them by month
Then Combine
-
Floor Price
-
Stretch Price
-
Target Price
-
Invoice Price (From quote calculation)
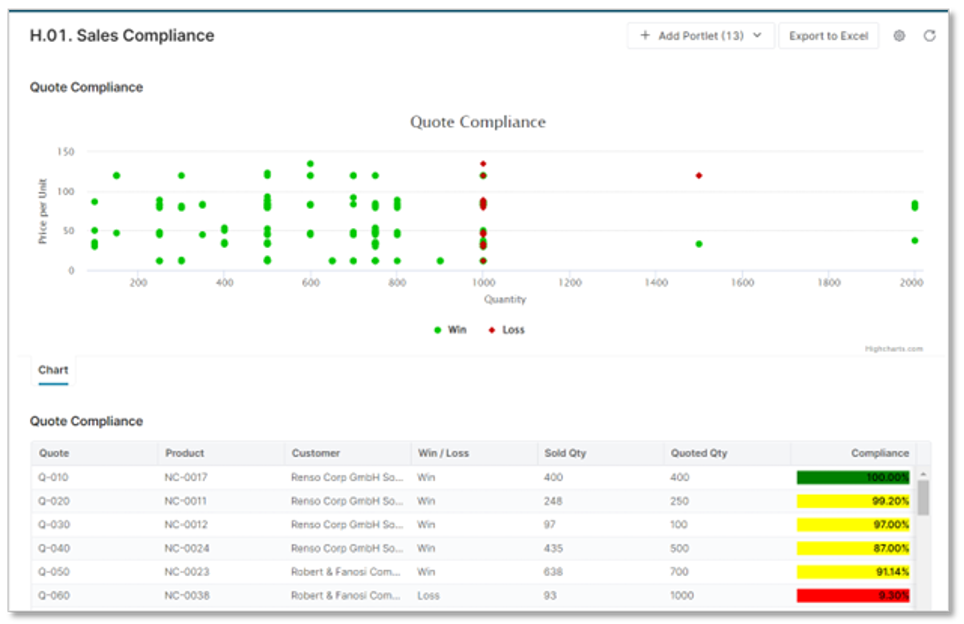
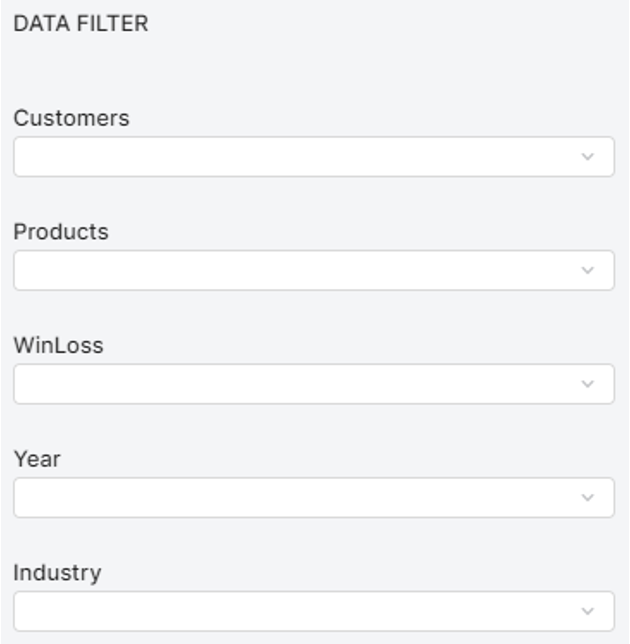
Sales compliance Dashboard
We need to create a dashboard with a Data Filter and 2 portlets.
The requirement is that we need to receive with the transactions data the quote reference ID in case the transactions are connected to a specific quote.
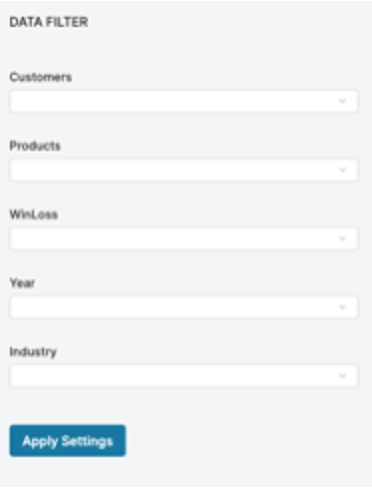
Customers:Customer picker or a Restricted Drop-Down list with customers
Products:Product picker or a Restricted Drop-Down list with products
WinLoss:Drop down with hardcoded values “Win”, “Loss”
Year:Date picker or restricted Drop-Down list
Industry:Drop-Down list
Portlets
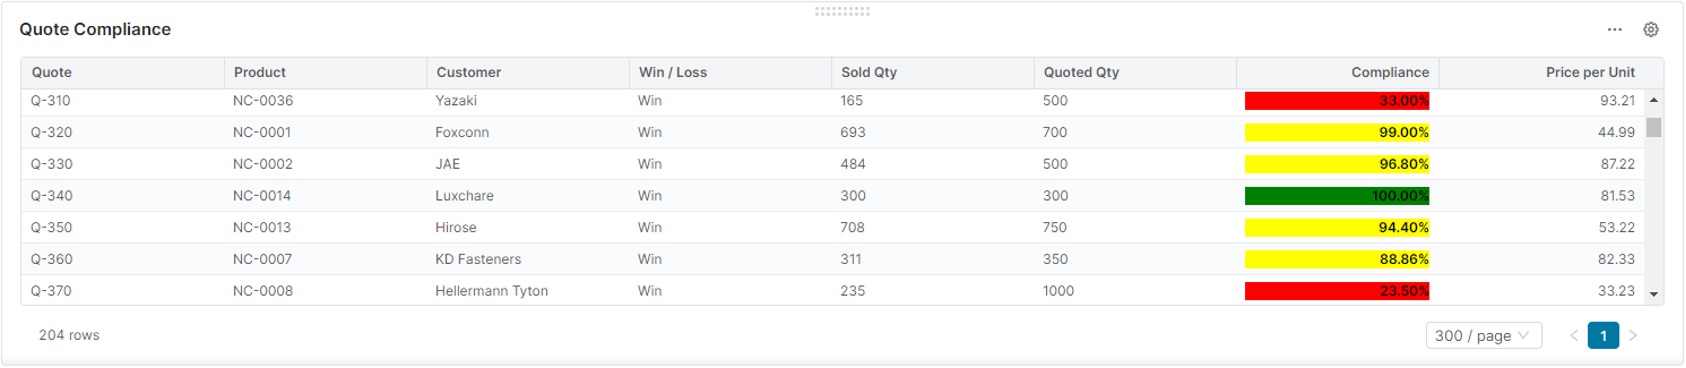
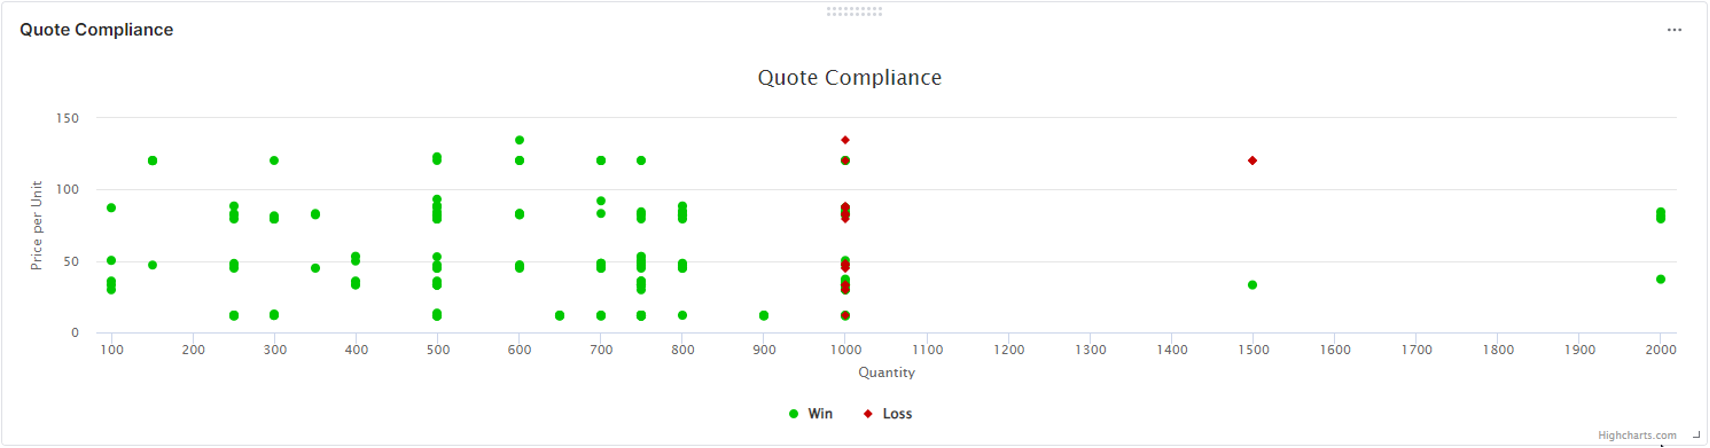
Quote Compliance 1
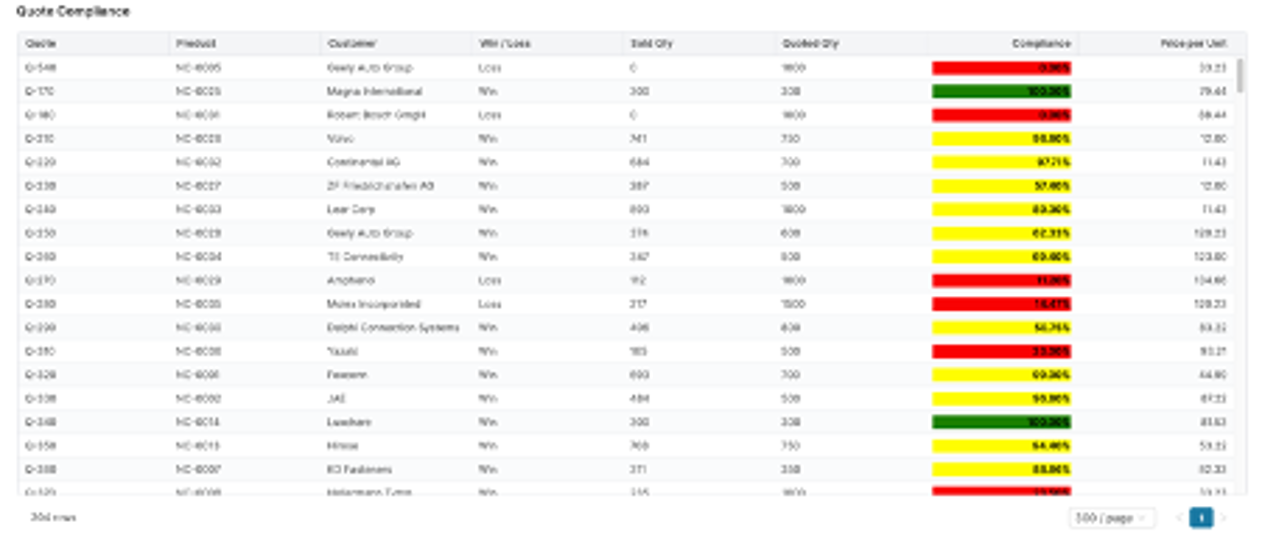
For this portlet we need to query the transactions Datamart based on the provided Data Filter and get the sold quantities for all line that have a Quote Reference ID.
Then we need to query the quote line items and find them inside the quote in order to get the details of the quote.
In the end we need to show the following details:
-
Quote: Quote ID
-
Product: Product
-
Customer: Customer
Win / loss: Display will or loss based on a threshold specified by customer.
Sold Qty: Sold quantity (Based on the transactions)
Quoted Qty: Quoted quantity (based on the quote)
Compliance: The percentage of the quote fulfilment
PricePerUnit: the agreed Unit Price
Quote Compliance 2
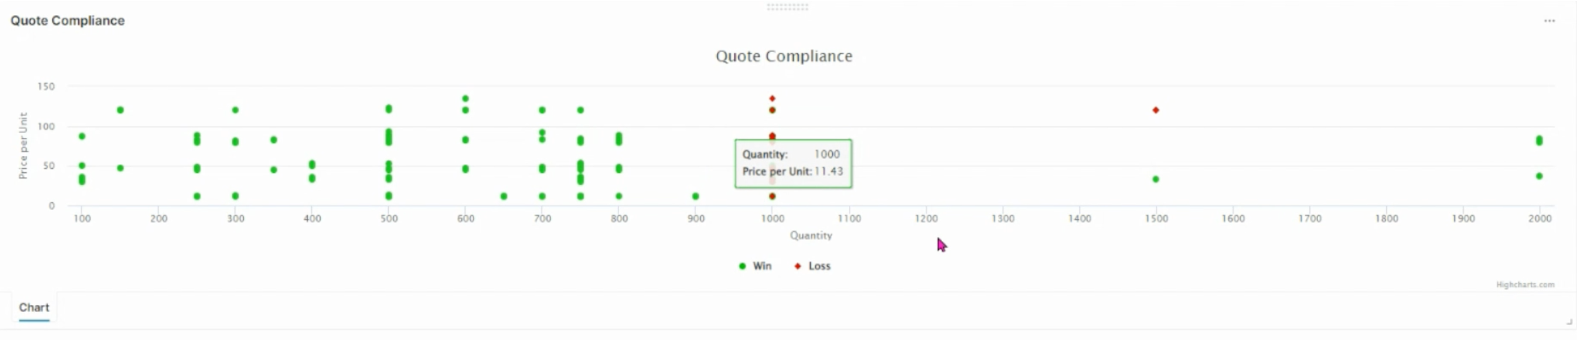
Based on the above data we can also visually represent the information.