This article provides a step-by-step checklist for testing Pricefx Agents, from initial smoke tests to in-depth validation of Sales Insights, Customer Insights, and waterfall dashboards. It explains how to prepare representative test data, verify data integrity and mappings, and confirm that Copilot and agent-driven actions behave as expected.
1. First Round of Tests (Smoke and Exploratory Tests)
Review each dashboard to verify whether it opens correctly and whether data is displayed as expected. Note any instances where data is missing or an error message appears. Report and follow up on any non-standard behavior.
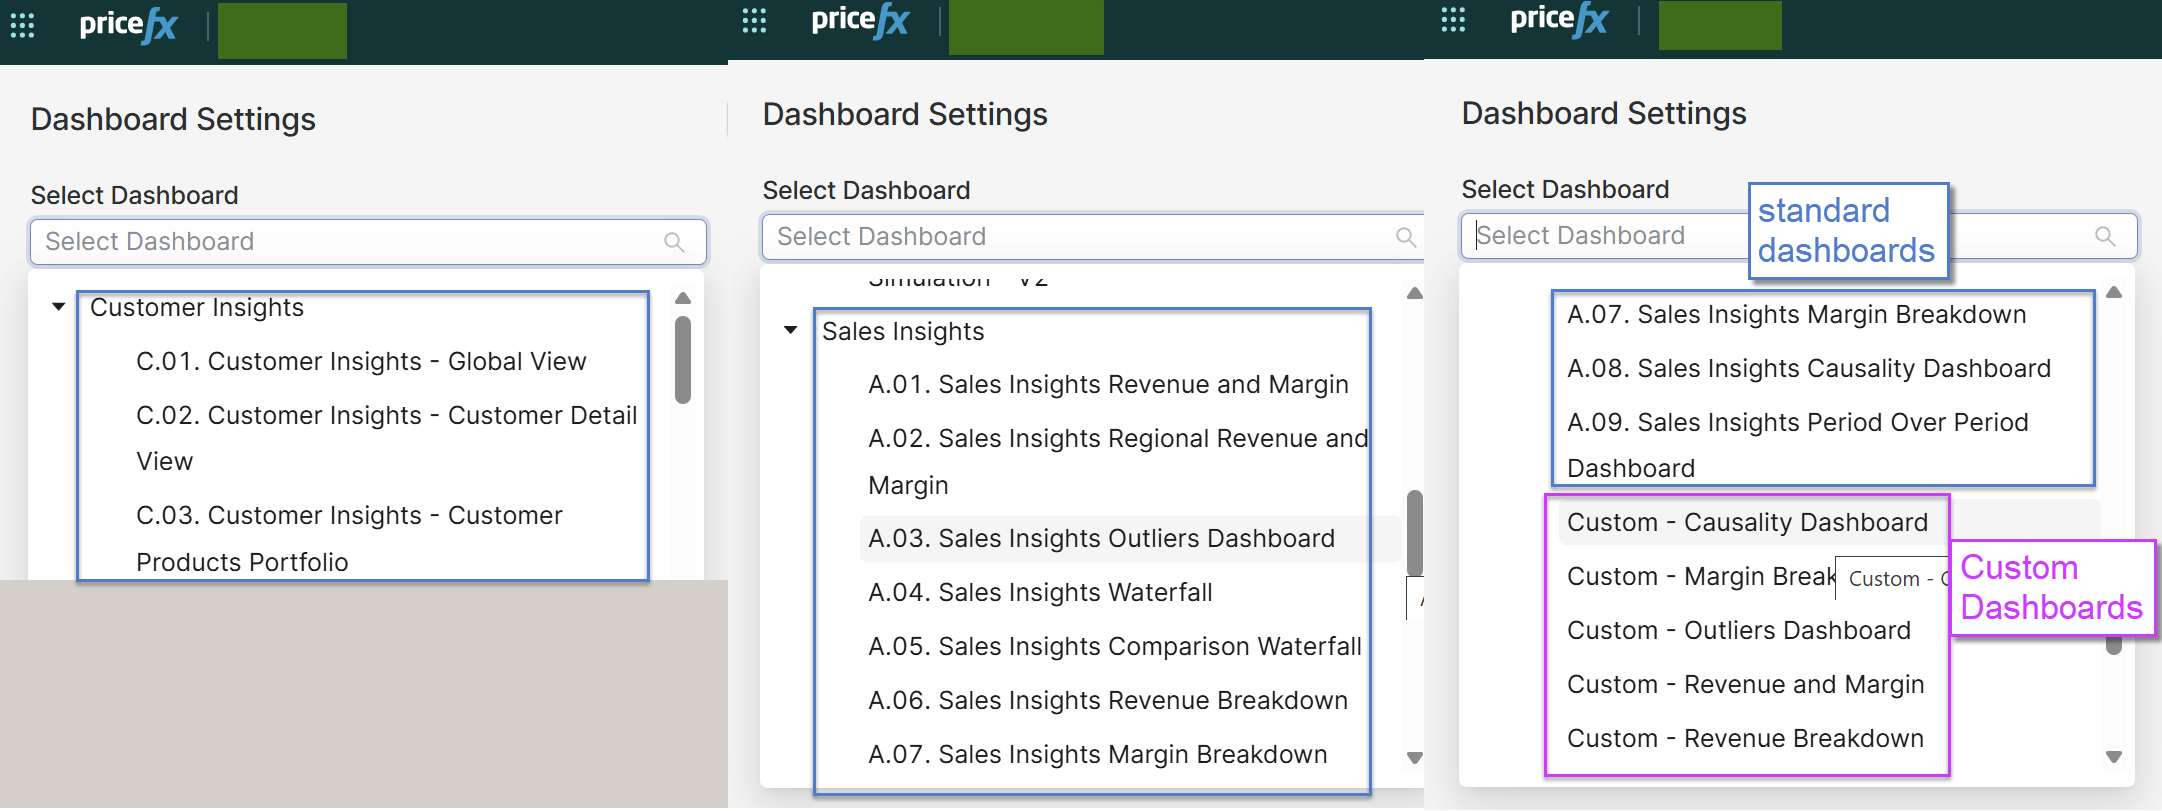
Some dashboards may have been slightly modified and will have the prefix Custom (see image below). Please ensure these are checked as well.
2. Second Round of Tests (Content-focused Testing)
Focus on the content of the dashboards. Assess whether the data makes sense and is consistent, with particular attention to data integrity. Specifically, try to obtain answers to the following:
2.1 Prepare Test Data
Prepare test data (a representative sample) that you will use to browse the dashboards.
-
For example, include all transactions for a specific Customer Id and Period (usually the last two years, so you can test settings such as
Last 3/6/12 months, etc.). A sample size of a few thousand records is acceptable. A sample of only a few transactions is not sufficient, as it does not allow proper filtering to test various data filter options. -
Create a view in the datamart (and save it) that includes the columns used in the SIP, CI, and Waterfall Configurations (Administration > Configuration > Advanced Configuration), and arrange them in the same order as in the configuration. After downloading this sample dataset from the datamart, it will speed up validation of the data displayed in the dashboards by allowing you to filter the data as needed.
Be aware that dashboards usually contain more advanced filtering than simple filtering in Excel (e.g., XLS).
-
During the process of arranging columns based on the waterfall configuration, consider whether the structure makes logical sense. The scope of testing is to verify the consistency of the data used. In some cases, this is straightforward (e.g., three columns: Revenue − Cost = Margin). In other cases, the structure may be more complex, and logical discrepancies can occur, especially if the customer (or prospect) has not yet used SI/CI and, therefore, no one has harmonized the datamart values. Review the data primarily from the following perspectives:
-
Currencies – Are all columns in the same currency? For example, having Revenues in EUR but Costs in USD would result in meaningless dashboards. A waterfall graph might show Revenue (EUR) − Cost (USD) = Margin (EUR), which is not valid.
-
Units of Measure – Do the values represent the same unit of measure? For example, having Revenues as total values and Costs as per-unit values would result in incorrect calculations in the waterfall (and other dashboard components).
-
Value Amounts – It may occur that a Revenue column represents values in thousands (“'000”), while a Cost column does not. Avoid situations where the dashboard calculates Margin % as Margin / Revenue (in '000), which would distort the percentage result.
-
2.2 Accelerators Mappings in Sales Insights and Customer Insights
-
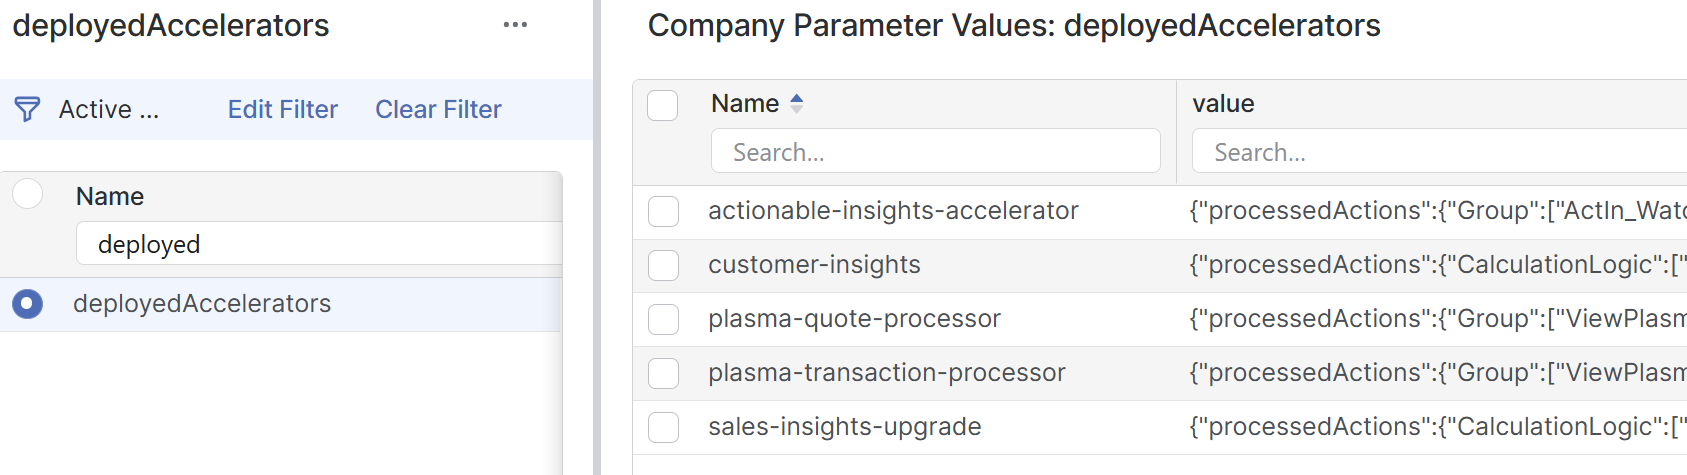
Verify whether accelerators are deployed and review the mappings in the Sales Insights and Customer Insights.
-
Go to Company Parameters.
-
Select the
deployedAcceleratorsparameter.
-
-
Cross-check the mappings for the Sales Insights, Customer Insights, and the Waterfall.
-
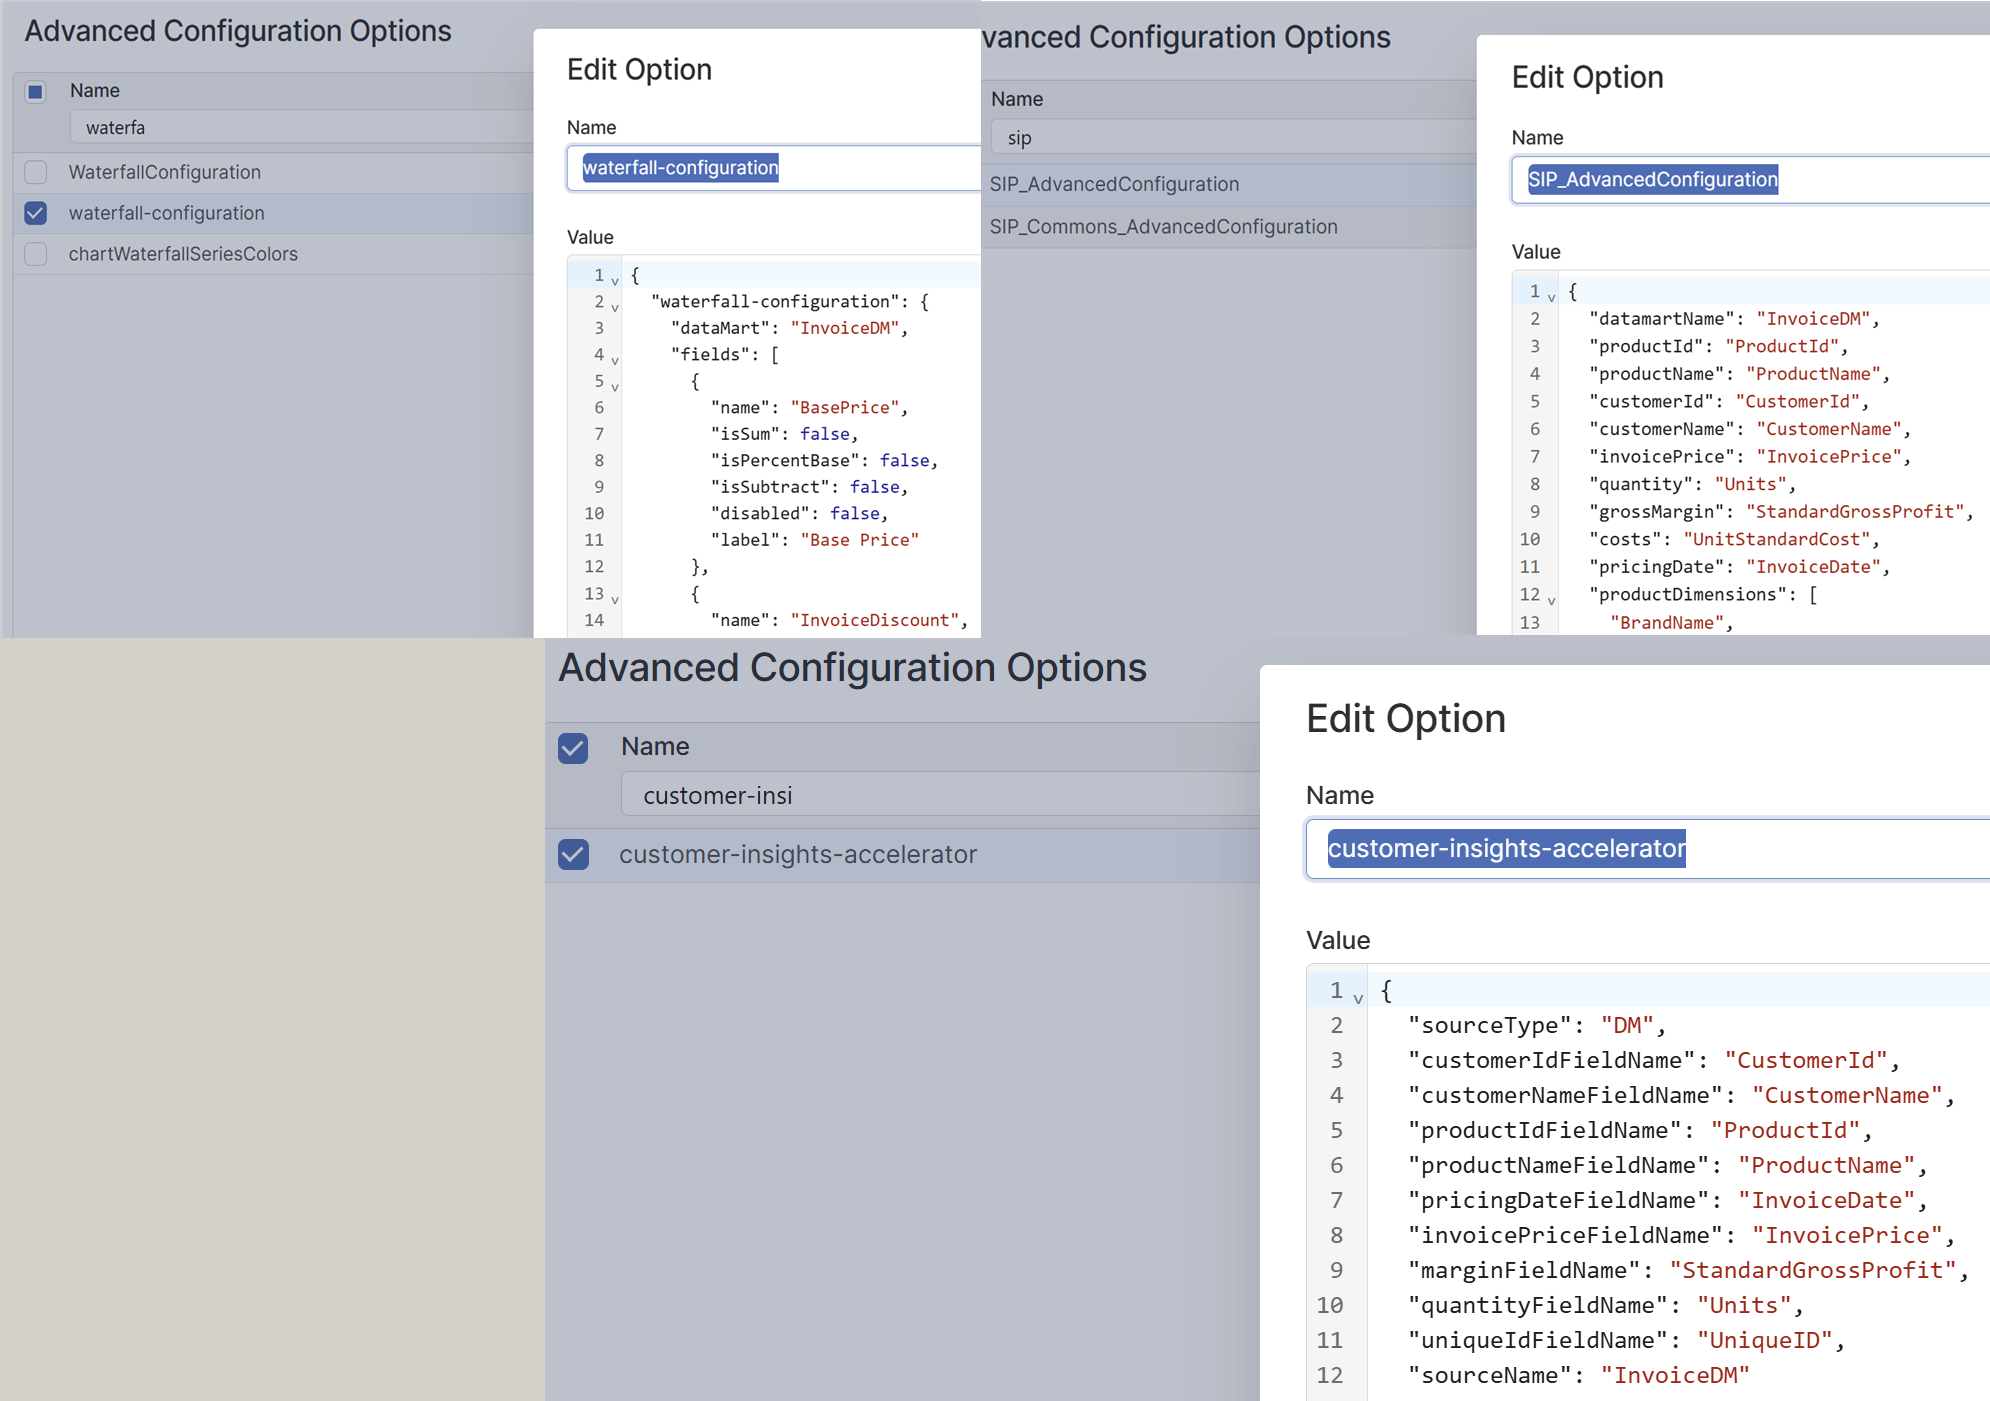
Go to Administration > Configuration > Advanced Configuration Options.
-
Select the following parameters:
-
SIP_AdvancedConfiguration -
waterfall-configuration
-
-
Verify that Revenue and Margin are mapped to the same datamart elements in both the Customer Insights (CI) and Sales Insights (SI) configurations.
For example, if Revenue for Customer X in 2024 is shown as 1 million in the Sales Insights dashboard but 1.2 million in the Customer Insights dashboard for the same customer and period, the values are inconsistent. The figures should match across dashboards.
-
2.2.1 Data Filter Check
Check the Data Filter on the left-hand side and test different values for the available inputs.
-
Verify whether you can search for a specific Product and Customer. Select a combination for which you are confident that transactions exist in the datamart for the chosen time frame.
-
Test various time frames, such as Last 12 Months (L12M), Last 3 Months (L3M), and Year-to-Date (YTD).
-
Check values for Product Aggregation and Customer Aggregation. It may occur that Product Aggregation incorrectly contains values related to the Customer hierarchy, or vice versa.
2.2.2 Revenue and Margin Check in Portlets
Should Revenue and Margin be checked in every portlet across all dashboards? The answer is no.
There is a single mapping location for Revenue in Sales Insights (SI) dashboards. Therefore, it is sufficient to verify Revenue and Margin on a selected SI dashboard. However, the Waterfall uses a different configuration, and Customer Insights (CI) dashboards have their own separate configuration.
As a result, the minimum number of dashboards that should be checked is three:
-
One Sales Insights dashboard (e.g., Revenue & Margin, Outliers, Revenue Breakdown)
-
One Sales Insights Waterfall (or SI Comparison Waterfall dashboard)
-
One Customer Insights dashboard
2.2.3 Sales Insights Waterfall Dashboards
-
Double-check that surcharges and discounts have the correct positive/negative signs. Configuration errors can occur, and it is possible to accidentally reverse the sign. For example, if a discount is displayed in green and added to the total, it is most likely incorrect.
-
Verify that the overall integrity of the waterfall chart makes logical sense. If possible, manually add or subtract the values of individual elements to confirm that they reconcile with the final value shown in the waterfall.
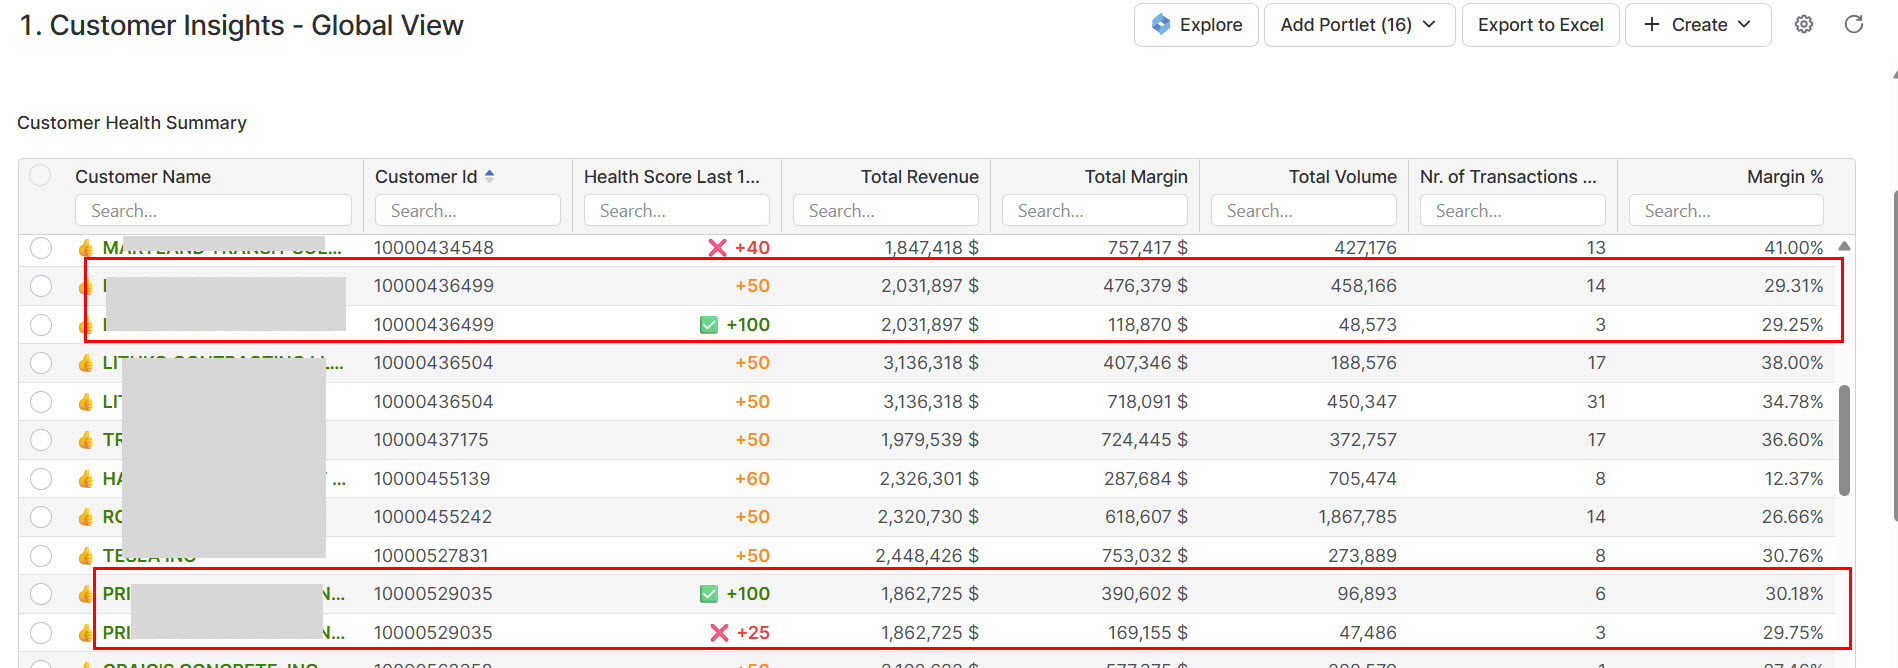
2.2.4 Customer Insights Global View Dashboard
-
Load the dashboard and verify whether the Customer field in the Data Filter on the left-hand side is populated correctly.
-
Increase the Customer Rank Bucket to
100in the Data Filter to ensure better coverage and higher-quality test data. -
Review the Customer Health Summary carefully, paying particular attention to records that represent the same customer (i.e., the Customer Name and Customer ID are identical) but display different values. This situation should not occur. A single customer should have one set of KPIs, such as Revenue, Margin, and Health Score, at any given time. There is no valid reason for one customer to have multiple, conflicting KPI values simultaneously. Please refer to the screenshot below for an example.
2.2.5 Agents Accelerator Checks
-
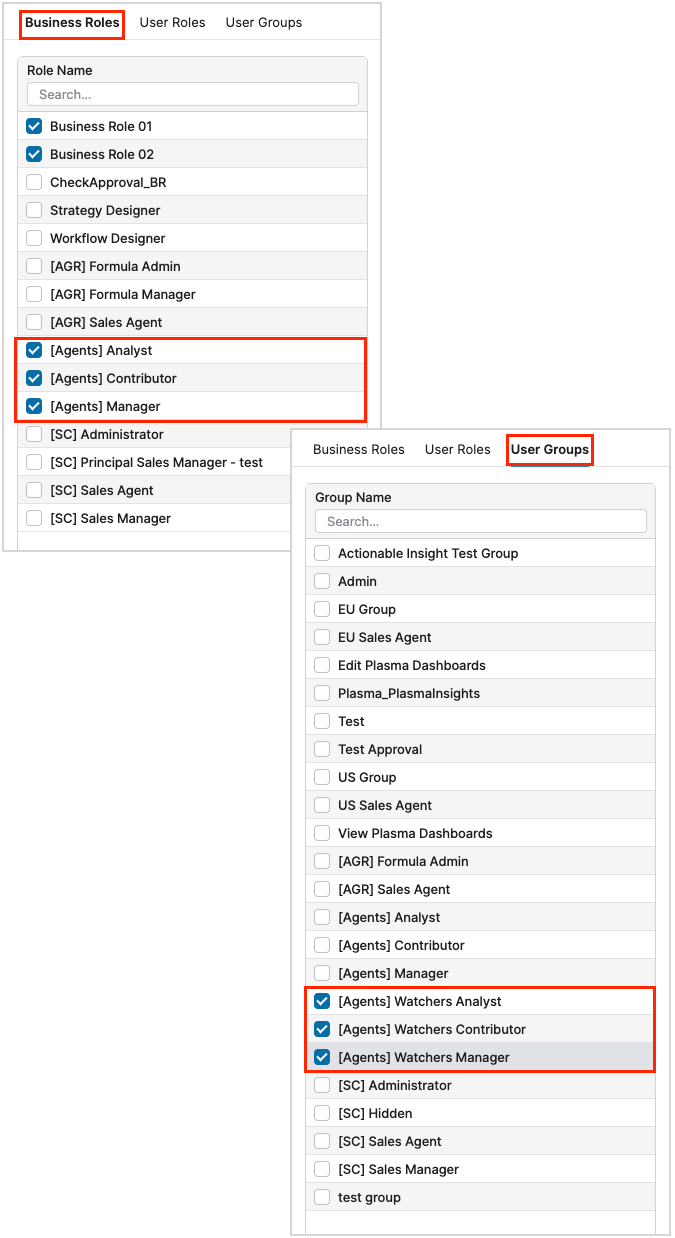
Make sure your User has the Agents Business Role(s) and User Groups.
|
Business Roles |
User Groups |
|---|---|
|
[Agents] Analyst |
[Agents] Watchers Analyst |
|
[Agents] Contributor |
[Agents] Watchers Contributor |
|
[Agents] Manager |
[Agents] Watchers Manager |
-
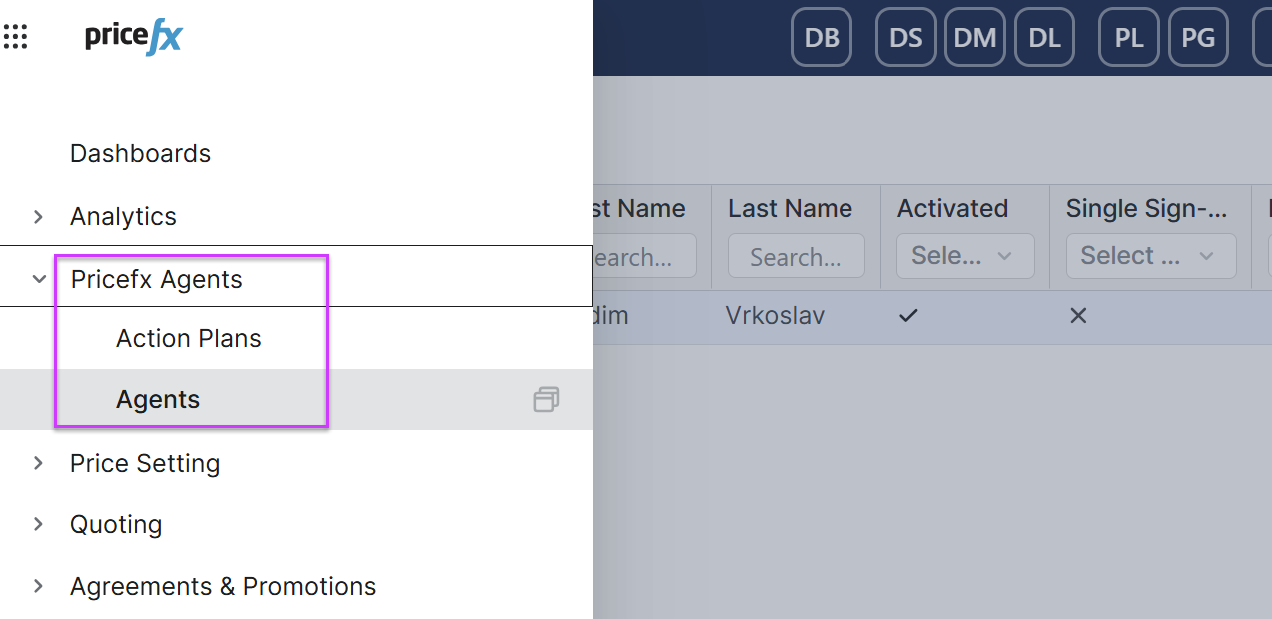
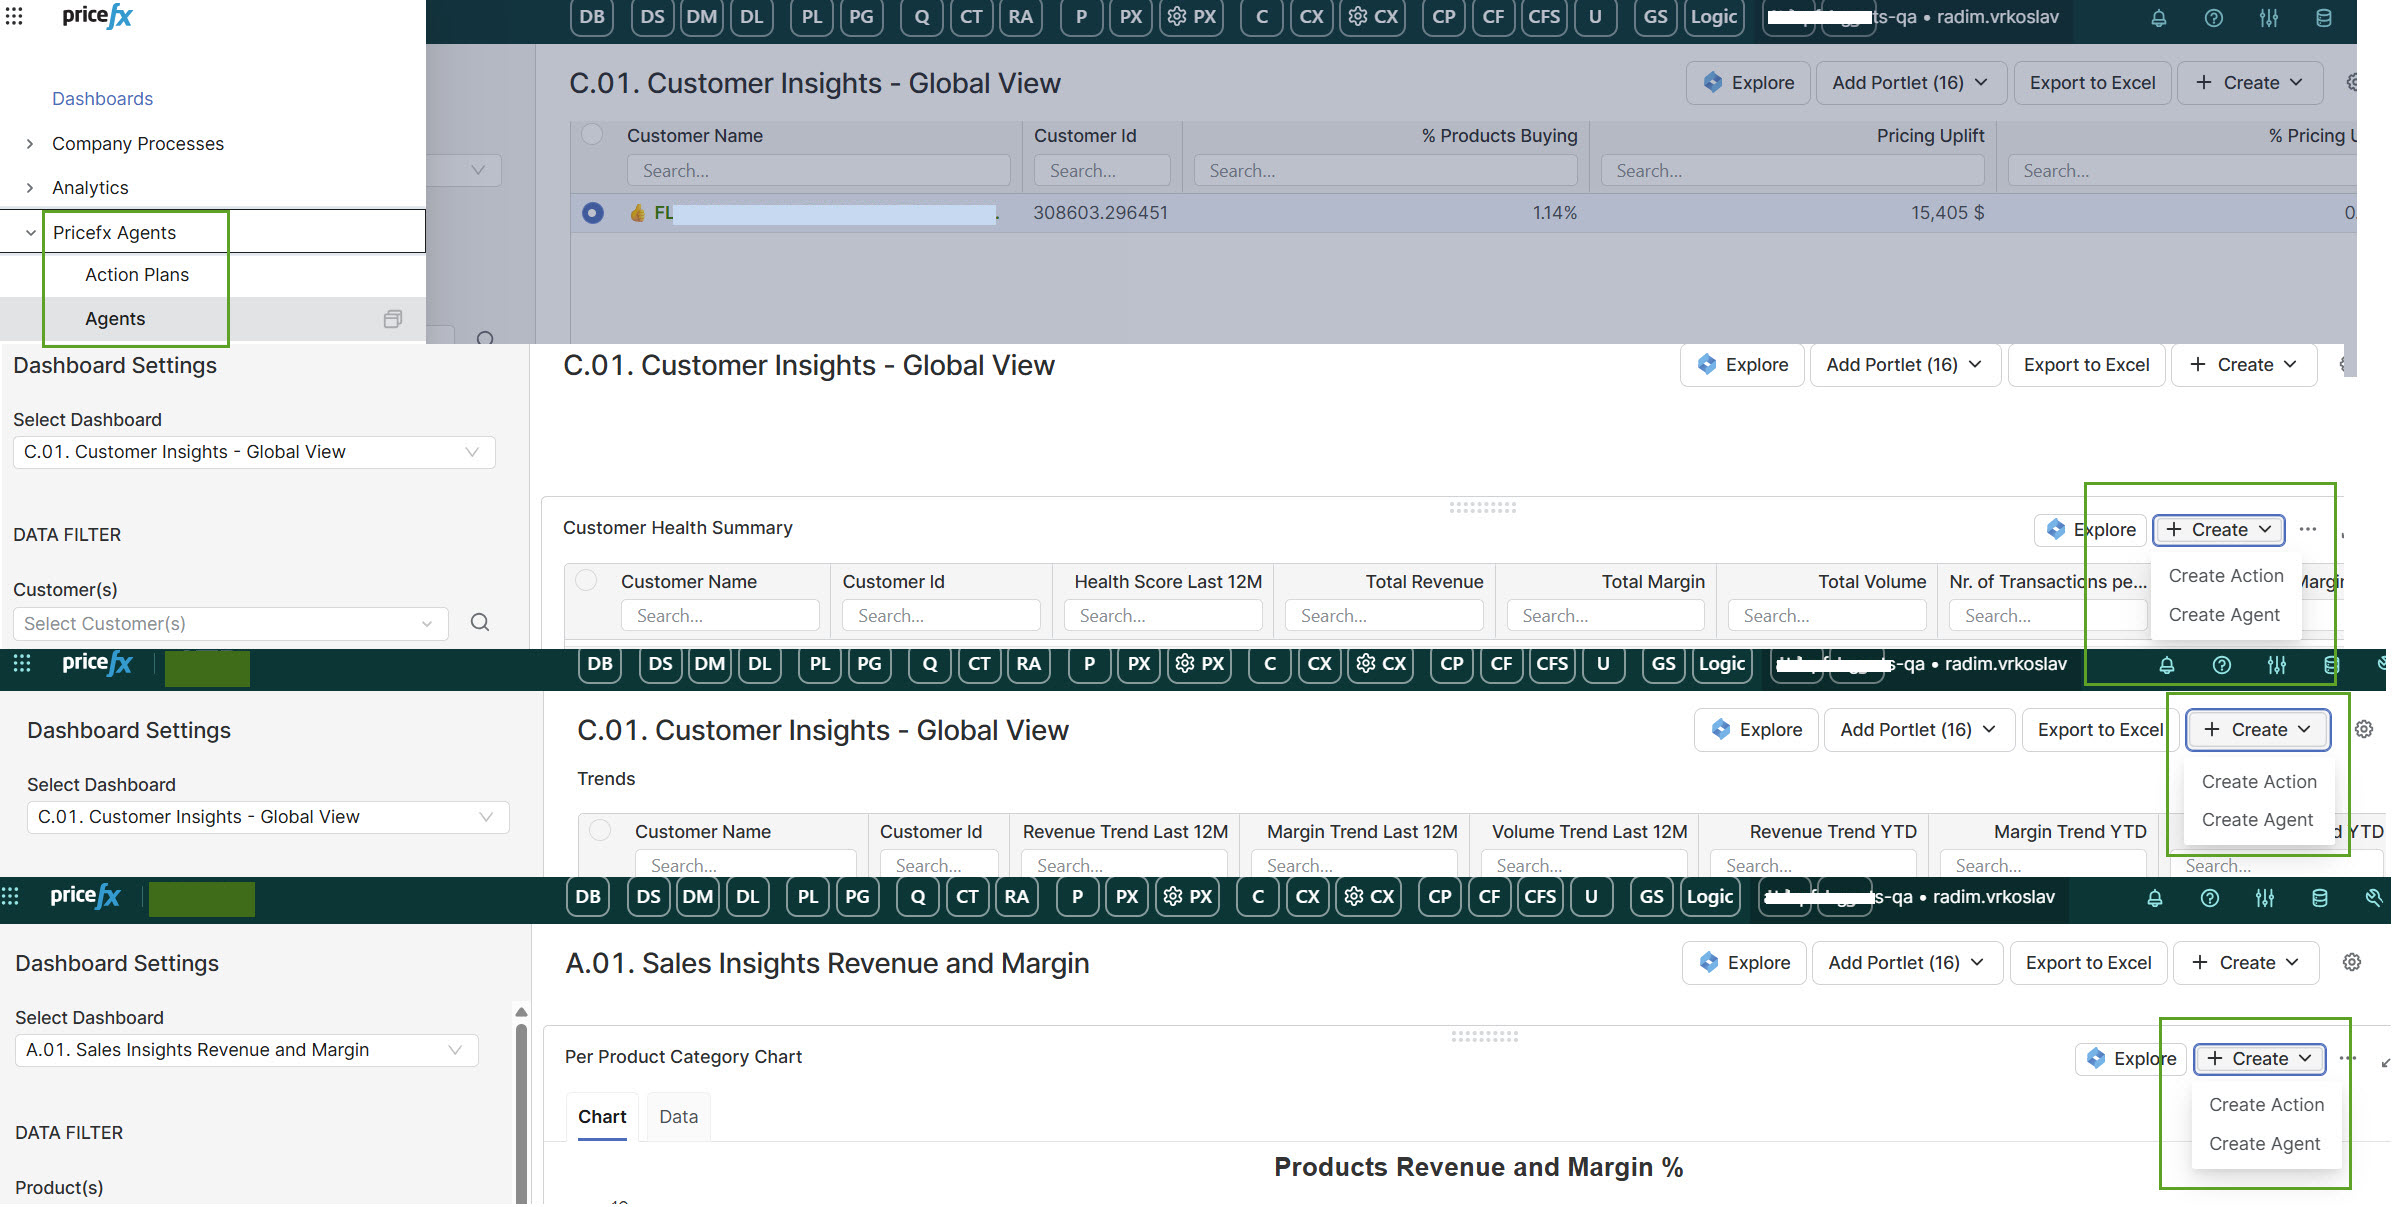
Check the main menu relabeling. It should appear as follows:
-
Verify that the Create Action and Create Agent buttons are accessible at both the Dashboard level and the Portlet level.
-
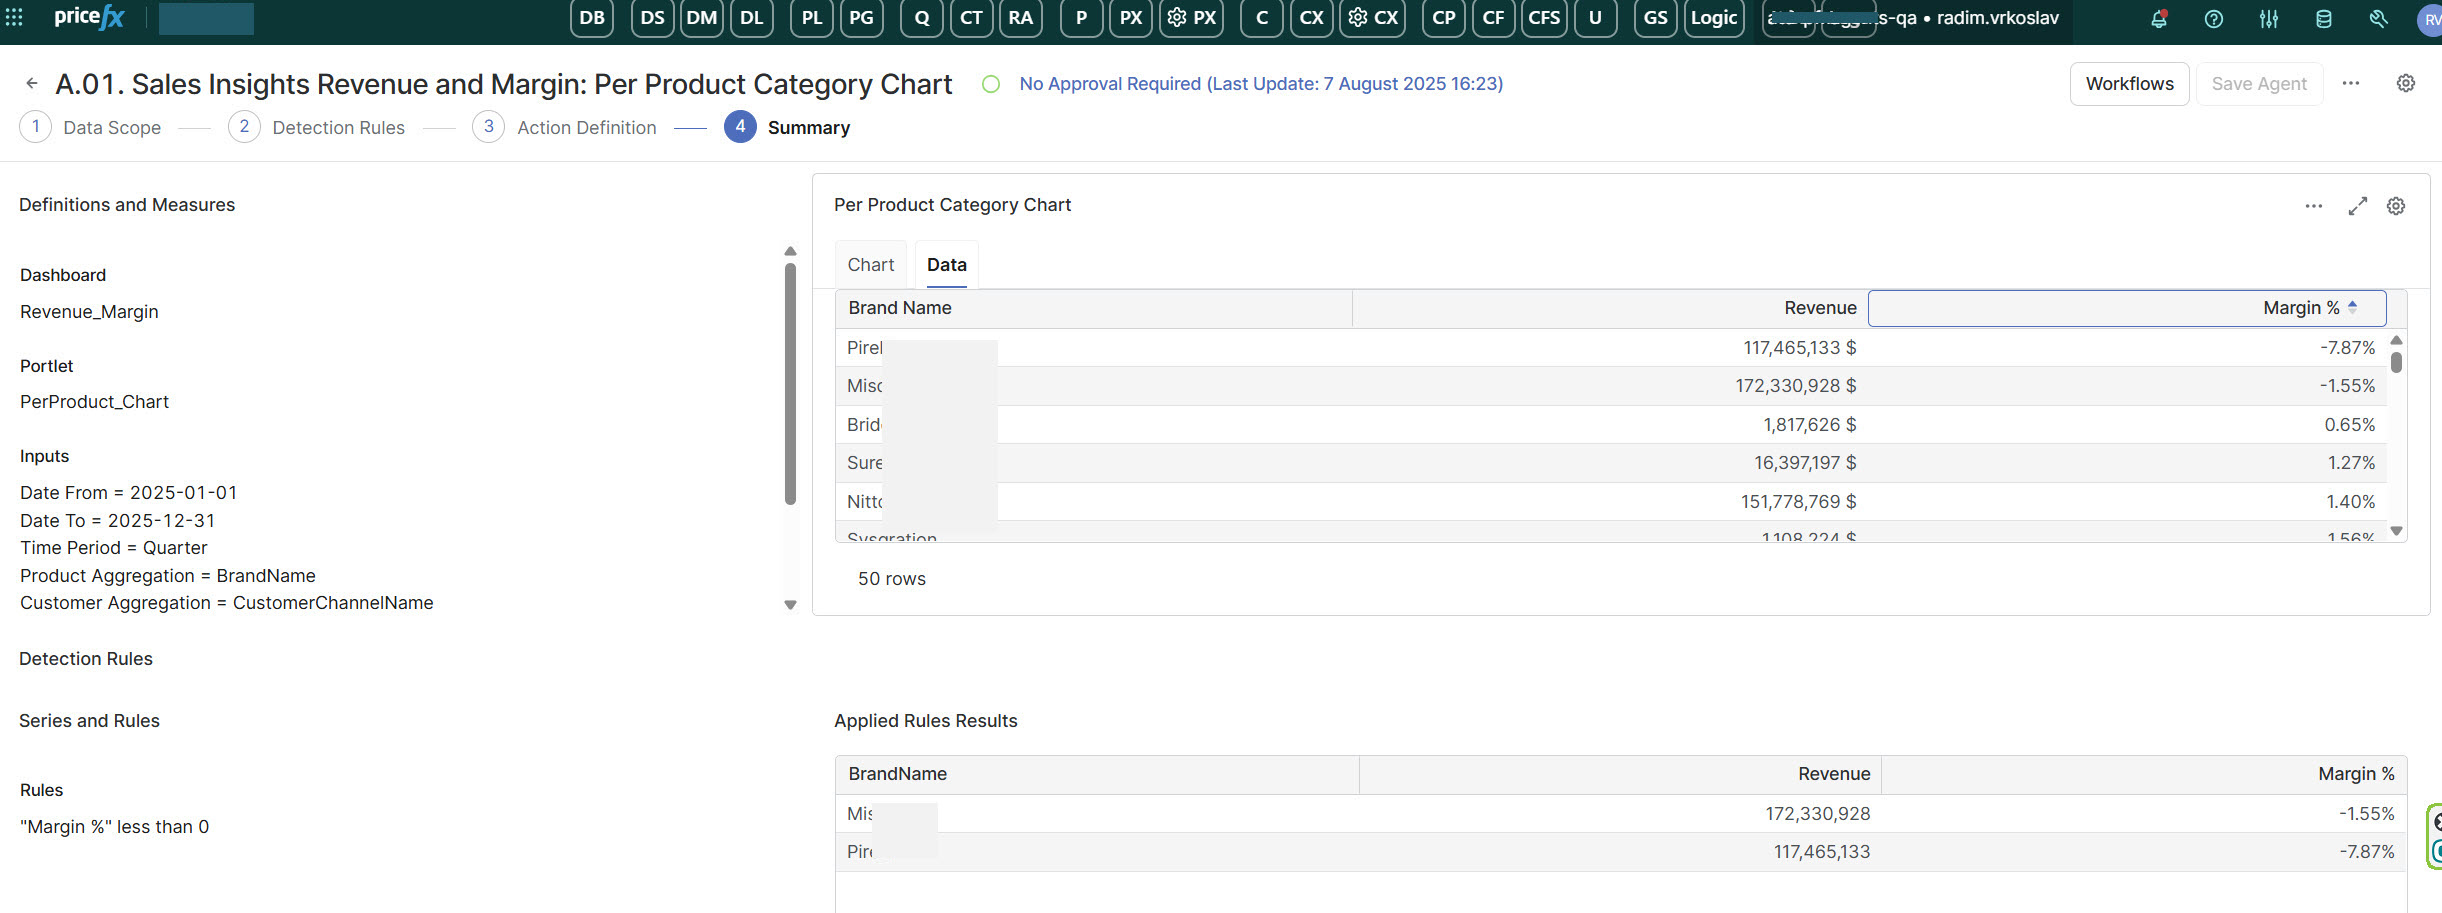
Create a test Agent and select a threshold that you are confident will be breached when the job runs. During the creation process, configure an Action Item, assign it to yourself, and set an appropriate due date.
-
Schedule the agent during creation, preferably to run in the near future (e.g., within the next 10–15 minutes).
-
Verify that the job has executed successfully.
-
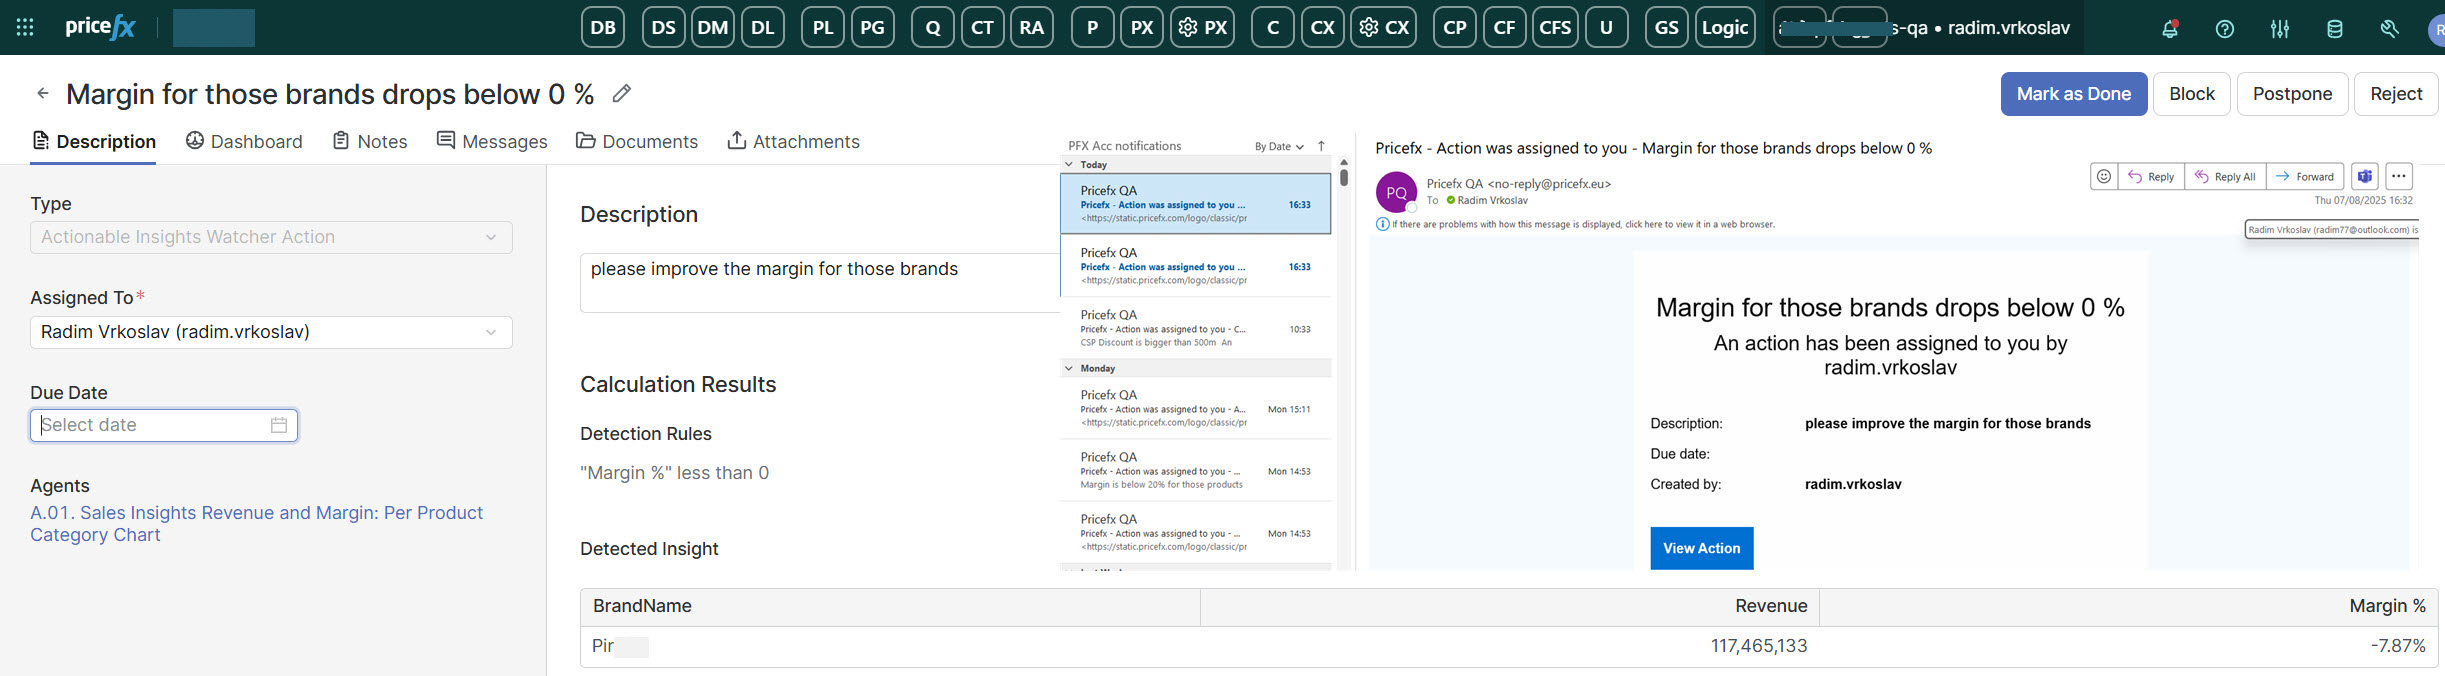
Confirm that the notification email has been received.
-
Check that the Action Item has been created correctly, is assigned to you, and includes the correct due date.
-
See the example below:
2.3 Copilot Tests
-
Test the Explore buttons at both the Dashboard level and the Portlet level.
-
Start with simple questions where the expected answer is obvious, for example:
-
Which customer has the lowest revenue or margin?
-
Which products have a negative margin %?
-
-
Validate the responses. Copilot should provide a clear answer. For example, a list of the relevant customers or products along with the requested values (Revenue, Margin, Margin %, etc.).
-
Next, ask Copilot how to improve the situation, for example:
-
What would you recommend to improve these products?
-
Provide recommendations to improve margin/revenue for these customers.
-
-
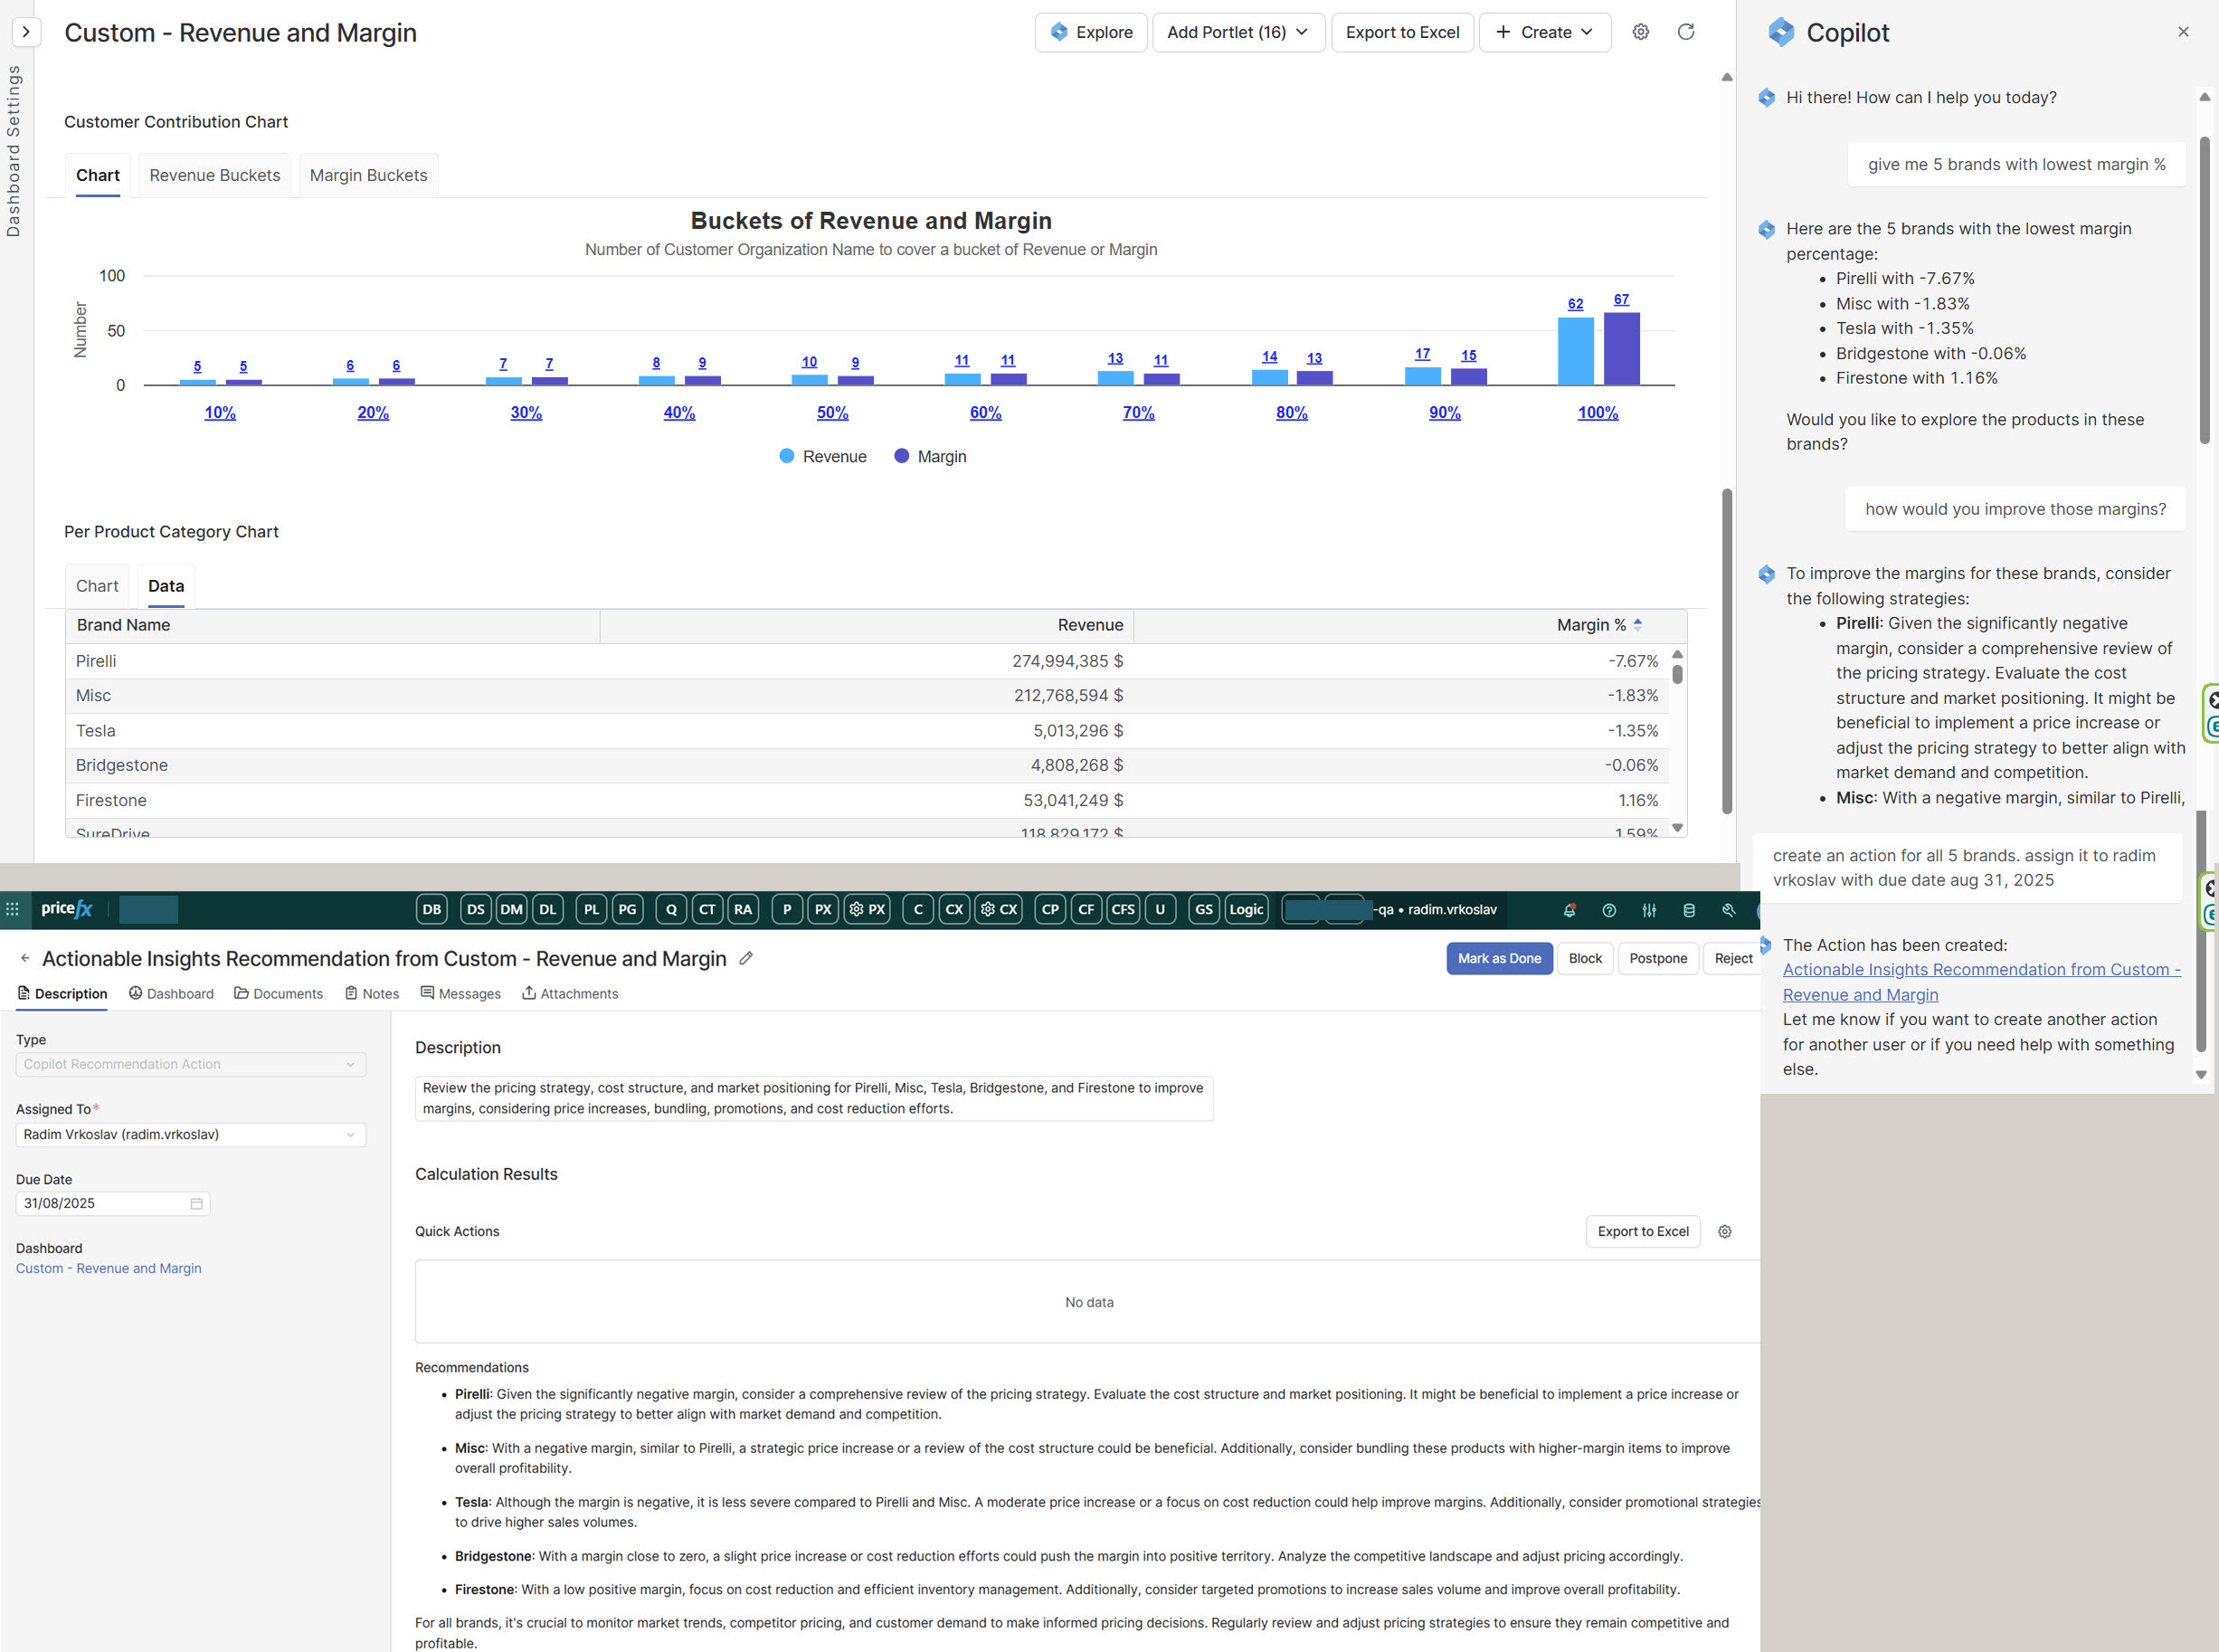
Ask Copilot to select the second, third, or all recommendations and create an Action for them. Assign the action to your user and set a due date.
-
Confirm that the action was created and verify that:
-
The action content matches what you requested (the correct recommendation),
-
The action is assigned to the correct user.
-
The due date is correct.
-