CHEM05: Improve price realization by simulating impact of mass price change scenarios

📽️ Check out a video demonstration for this use case, here.

Use Case Situation Description

Improving price realization through simulated mass price change scenarios in the process industry enhances revenue potential by optimizing pricing strategies. This approach allows for informed decision-making, minimizes risks associated with price adjustments, and boosts profitability. By simulating various pricing scenarios, businesses can accurately predict customer responses, align prices with market dynamics, and ultimately achieve higher financial gains while maintaining competitive positioning. Pricefx can assist throughout its capabilities with all these aspects.

User Role(s) and Business Objective

Sales, Pricing, or Product Manager or Analyst

Business Objective:

Businesses seek to keep performance at or above the business plan for the current year.  However, changes in business conditions, for example increases in costs for raw materials, transportation, or distribution, have created a gap between expected and projected earnings performance for the remainder of the year.  An immediate need exists to evaluate and implement pricing actions across an entire product, market, and/or geographic sector to bring expected business performance back on or above target for the year. 

Complication

·       Targeting price changes at a granular level can be challenging

·       Limited time to update data, complete models, review, and react

·       Limited visibility into impact on margin and volume due to market cost changes

·       Limited visibility into underperformance and recommendation for price improvements

Capability Needed

·       Evaluate options for price changes quickly

·       Mass price change simulation including product, market, geography

·       Connection to ERP or other system to publish/execute updated customer contract pricing

Benefit(s)
  • Improved margins due to frequent/smart revisions on price setting vs. forecast planning

  • Reduced margin compression with reduction in manual errors and timely pricing updates

  • Increased margin with decision support

KPIs
  • Margin improvement due to more effective targeting of mass price changes

Calculations
  • Margin improvement = CM2 (new pricing) – CM1 (old pricing)

Value Projections

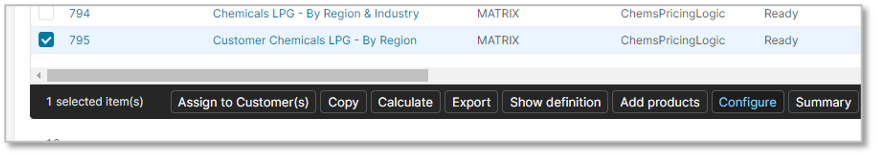
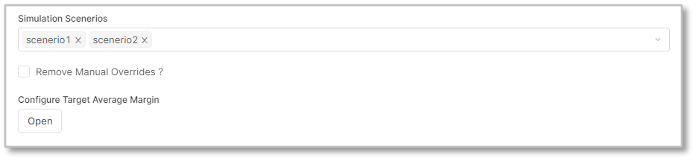
LPG – Simulation (select price list and configure)

image-20230825-050508.png

LPG – Simulation (open configure target average margin)

image-20230825-050528.png

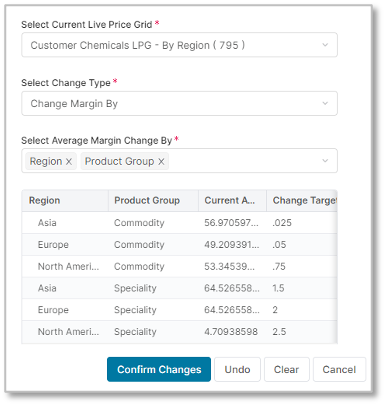
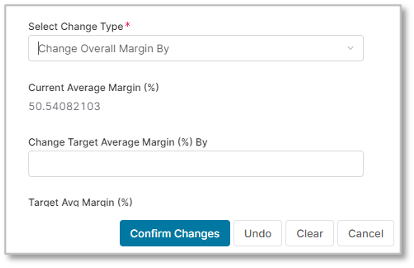
LPG – Simulation – a) targeted margin change per hierarchy, b) mass margin change 

image-20230825-050555.png
image-20230825-050616.png

Prescriptive Design Requirements

As a [Pricing Manager/Pricing Administrator], I want to create and compare diverse pricing scenarios in the LPG, evaluating price, volume, revenue, and cost variables to determine optimal price increases, so I can:

  • Compare them to help decide which prices to increase and by how much.

  • Use the goal seeking functionality in my LPG

  • The LPG should display KPIs both in the general interface and within the scenario comparison window, aiding decision-making.

The overall design requirements are summarized in these articles:

Functional and Non-functional Requirements

Using the chemicals live price grid described in CHEM03, add scenario tables and goal seeking functionality to simulate mass price changes.

Scenario tables: add folders in the company parameter (CP) tables list, under the “Chemicals” header:

image-20230825-053529.png

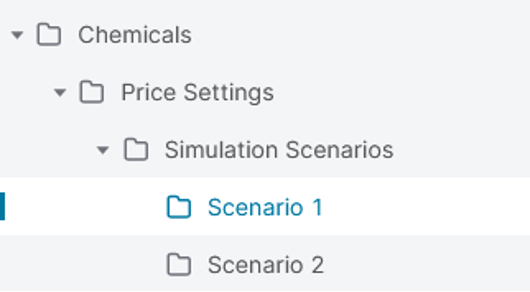
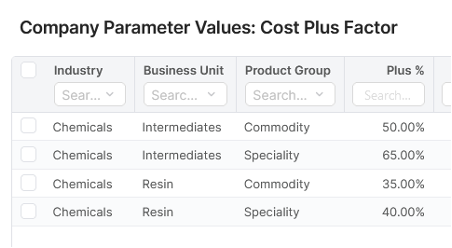
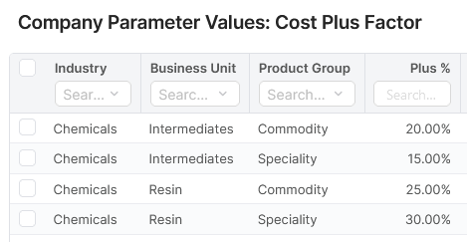
Each scenario contains the CP tables defined in CHEM03, with different values in scenario 1 vs scenario 2; example below for the Cost Plus Factor CP table

image-20230825-053612.png
image-20230825-053627.png

Scenarios can be compared within the LPG using the “Show” button located in the “Scenarios Matrix” field.

image-20230825-053658.png

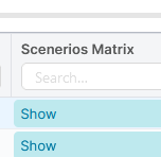
This brings up a table comparing all the scenarios.


Goal seeking: configure the LPG to handle goal seeking to the user sees the window below:

image-20230825-053750.png

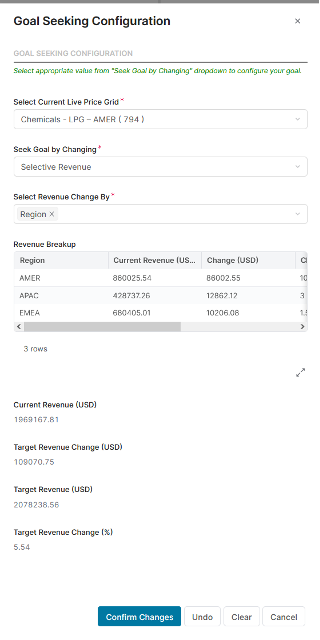
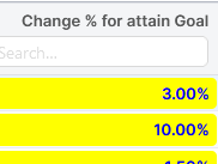
Once the user has entered all the changes in this window, the LPG should be recalculated to display the new change % by material.

image-20230825-053851.png

Non-functional requirements

N/A

Reporting and Dashboards

There are no requirements applicable for reporting and dashboards for this use case.

Measures, Calculation and Decision-making KPIs

There are no new or additional calculations in this use case. Since this is price change simulation, all calculations exist already in other use cases. You can check them all here.

Scope Validation and Project Readiness

There are no new or additional validation questions in this use case. Since this is price change simulation, questions exist already in other use cases. You can check them all here.


User Stories

These are the user stories associated with this use case.

Epic: Metrics

As a Pricing Manager/Pricing Administrator, I want to set up several scenarios covering several price, volume, revenue or cost hypotheses, so I can compare them to help decide which prices to increase and by how much.

User Story Name - Metric definition

I want to: Define the appropriate metrics for my business

so I can: Adjust them in each scenario to see their impact on costs, volumes, revenues, prices etc

Acceptance Criteria: The chosen metrics are relevant to the business context under consideration


User Story Name - Metric Tables

I want to: Have a table for each metric and scenario to store values I want to work with

so I can: Use them in the calculation of costs, volumes, revenues, prices etc.

Acceptance Criteria:

Each metric has its own table with appropriate fields for each scenario, e.g.

  • Dimensions: dates, geographies, product or customer groupings…

  • Values: absolute, % variation, factors…

Epic: KPIs

As a Pricing Manager/Pricing Administrator, I want to see KPIs in the LPG I use to compare scenarios.

User Story Name - LPG Header KPIs

I want to: Define the appropriate header level KPIs for my business

so I can: Use them to validate the overall LPG

Acceptance Criteria: Examples: current and future revenues, margins, margin %...


User Story Name - LPG Line KPIs

I want to: Define the appropriate line level KPIs for my business

so I can: Use them to validate each line of the LPG

Acceptance Criteria: KPIs to be displayed in columns

Examples: current and future revenues, margins, margin %, detailed cost, price, volume values…

Epic: Scenario comparison

As a Pricing Manager/Pricing Administrator, I want to see KPIs in the scenario comparison window of the LPG I use to compare scenarios.

User Story Name - Scenario comparison KPIs definition

I want to: Define the appropriate KPIs to compare scenarios with

so I can: Use them to choose the best scenario

Acceptance Criteria: KPIs will be displayed in columns/fields

Examples: current and future revenues, margins, margin %, detailed cost, price, volume values…

Describe how they are calculated/sourced

Epic: LPG goal seeking functionality

As a Pricing Manager/Pricing Administrator, I want to use the goal seeking functionality in my LPG.

User Story Name - Configure the “Revenue Change By” setting for goal seeking

I want to: Define the appropriate dimension in my goal seeking settings

so I can: Use the goal seeking functionality in a relevant way

Acceptance Criteria: Any LPG output field can be used and will show in the drop down list for the user to choose from


Data Requirements

No additional input data is needed for this use case other than the simulation scenario tables covered in the requirements and design.


Out-of-Scope

Out-of-scope business functions and features can be configured, but are not included in the Chemical Industry Catalog.


Solution Design

Pricefx’s data structures allow for duplicate versions that can be modified and managed independently from others. Meaning that simulation versions can be created alongside the primary ones to enable this use case.

Create the scenario simulation data structures

To do this, create a new set of folders, as highlighted in the requirements. The names of the folders don’t matter. Create one folder for each simulation scenario that you want to enable. A realistic limit here is about 3 – more than that and performance will degrade and the UI will get chaotic. All that needs to be done here is to replicate any existing Company Parameter tables that impact pricing – preferably limited to those with simulation factors – into these new folders. Certain tables will make sense to be part of a simulation scenario and others will not. More static elements like costs or <something> won’t necessarily make sense to be part of a simulation since they’re not under the user’s control. Elements like percent mark ups or surcharges will make sense since those are the types of elements that might be adjusted to help hit targets.

Cost to serve elements could also be included here, though those are not often variable for in major price changes.

In the price setting logic, create the scenario outputs

Create a new logic element(s) in the LPG / price list logic for the simulation results. The approach in the demo uses a single element with an expandable matrix. The matrix shows data from the simulation, including Cost, Base Price (original / current price), amount of the price change, % delta in price, and other waterfall element contributions to the price calculation. The minimum set here would be current price, new price and a delta field, but the user will be able to define what information is useful to visualize in the output matrix.

This output could also be shown in individual elements within the price setting object, but keep in mind that price setting objects only allow 100 columns in each object, so use them wisely.

Variability points – places where requirements might differ

First and foremost for this use case is when the scenarios are run. Scenarios can be run on every price setting calculation, but that will have a toll on performance. More likely, a selector that determines whether to use the scenario data at all should exist. This might exist in an LPG / PL header (a checkbox or a scenario selector, see below) or in a company parameter table – again either a Yes / No selector for simulations and/or a scenario selection option. These selections would need to be recognized in the logic (pulled from the header or the table) and then the simulation “behavior” would execute when they’re used. The primary price calculations could even be skipped when in “simulation mode.”

One of the main distinctions for this use case will be in the metrics that are used to evaluate each simulation and potentially the use of goal seeking (below). Most of the metrics for the simulation are likely already being calculated for the prices, so no additional logic is needed, just a reflection of these elements in the scenario outputs matrix (above). The elements in that matrix could vary greatly depending on what’s valuable to the user.

A second variability point is around the number of scenarios. Users may want to select one of several available scenarios (table sets) or compare scenarios against one another in the scenario outputs matrix. Selecting scenarios is somewhat more complicated – a selector would need to be created, either in an LPG / PL header or in a company parameter table that allowed the user to select the scenario to be run. 

Also, if the price setting object has a header, particularly if there’s a way to select a “simulation mode” of the object, the calculation outputs may want to display the impacts to revenue, margin or any other KPI of the simulation. In a “simulation mode” set, the metrics shown for the object overall could be set to show the simulation KPIs rather than the standard ones based on price calculations.

Goal seeking and attainment

The primary use case here displays a target metric for the price change simulation. This is pulled from the price setting object configuration (created via a user entry input) or from a table (more likely) and shown in the object. More likely this will be pair with a calculated metric and perhaps a delta field so that the user can see the current state of the target metric and how far it is from achievement.