📽️ Check out a video demonstration for this use case, here.
Use Case Situation Description
In this use case, our primary objective revolves around the attainment of our margin objectives. This is a challenge that can be overcome through meticulously formulating optimized pricing directives for your sales team.
PriceFx offers an opportunity to streamline optimization allowing the creation and implementation of models for optimized pricing. This results in substantial profit margin growth and increased sales team confidence in your pricing suggestions.
Prescriptive Design Requirements
As a [Pricing Manager, Pricing Analyst, Data Scientist Manager], I want to empower sales with intelligent pricing guidance (Floor/Target/Ceiling) based on statistical input and business rules, so I can:
-
Improve the overall margin expansion by pricing the underperforming customers to be inline with their peer group.
-
Increase the sales efficiency by providing guidance on the what price to start the negotiation with (Ceiling Price), what target price to achieve (Target Price), and the walk-away price (Floor Price)
-
Improve price consistency
The overall design requirements are summarized in these articles:
User Stories
These are the epics and user stories that make up this use case.
Data Requirements
The following tables can be either manually loaded in Pricefx via Pricefx Excel Client or can be automatically integrated using CSV files in a dedicated SFTP folder.
LEARN MORE: To know about alternatives to Excel client, check out this article.
-
2 years of Billing data (Covered in CHEM00)
-
All relevant waterfall elements are available at each line of the billing data. (Pocket Price, Gross Margin, Quantity)
-
Customer and Product Masters (Covered in CHEM00)
Out-of-Scope
This represents the out-of-scope business functions and features for this use case. They can be configured, but by default they are not included in the Chemical industry Catalog.
-
Data transformation to enrich each line of the billing data with the relevant waterfall elements. (Cost, Margin Pct)
-
Cross Segments rationality rules.
-
Customer’s level recommendations
-
More than one segmentation
-
Derived or calculated attributes as potential pricing drivers
Solution Design
The design and implementation are going to utilize the suite of Pricefx out-of-the-box features and capabilities of the Optimization module within Pricefx (Pricefx Accelerate Negotiation Guidance). Pricefx Accelerate Negotiation Guidance can be deployed for the first time from Pricefx Marketplace and Accelerator Packages within Pricefx Platform Manager into the desired partition.
LEARN MORE: For more information Negotiation Guidance, its deployment and everything it can do for you, click here.
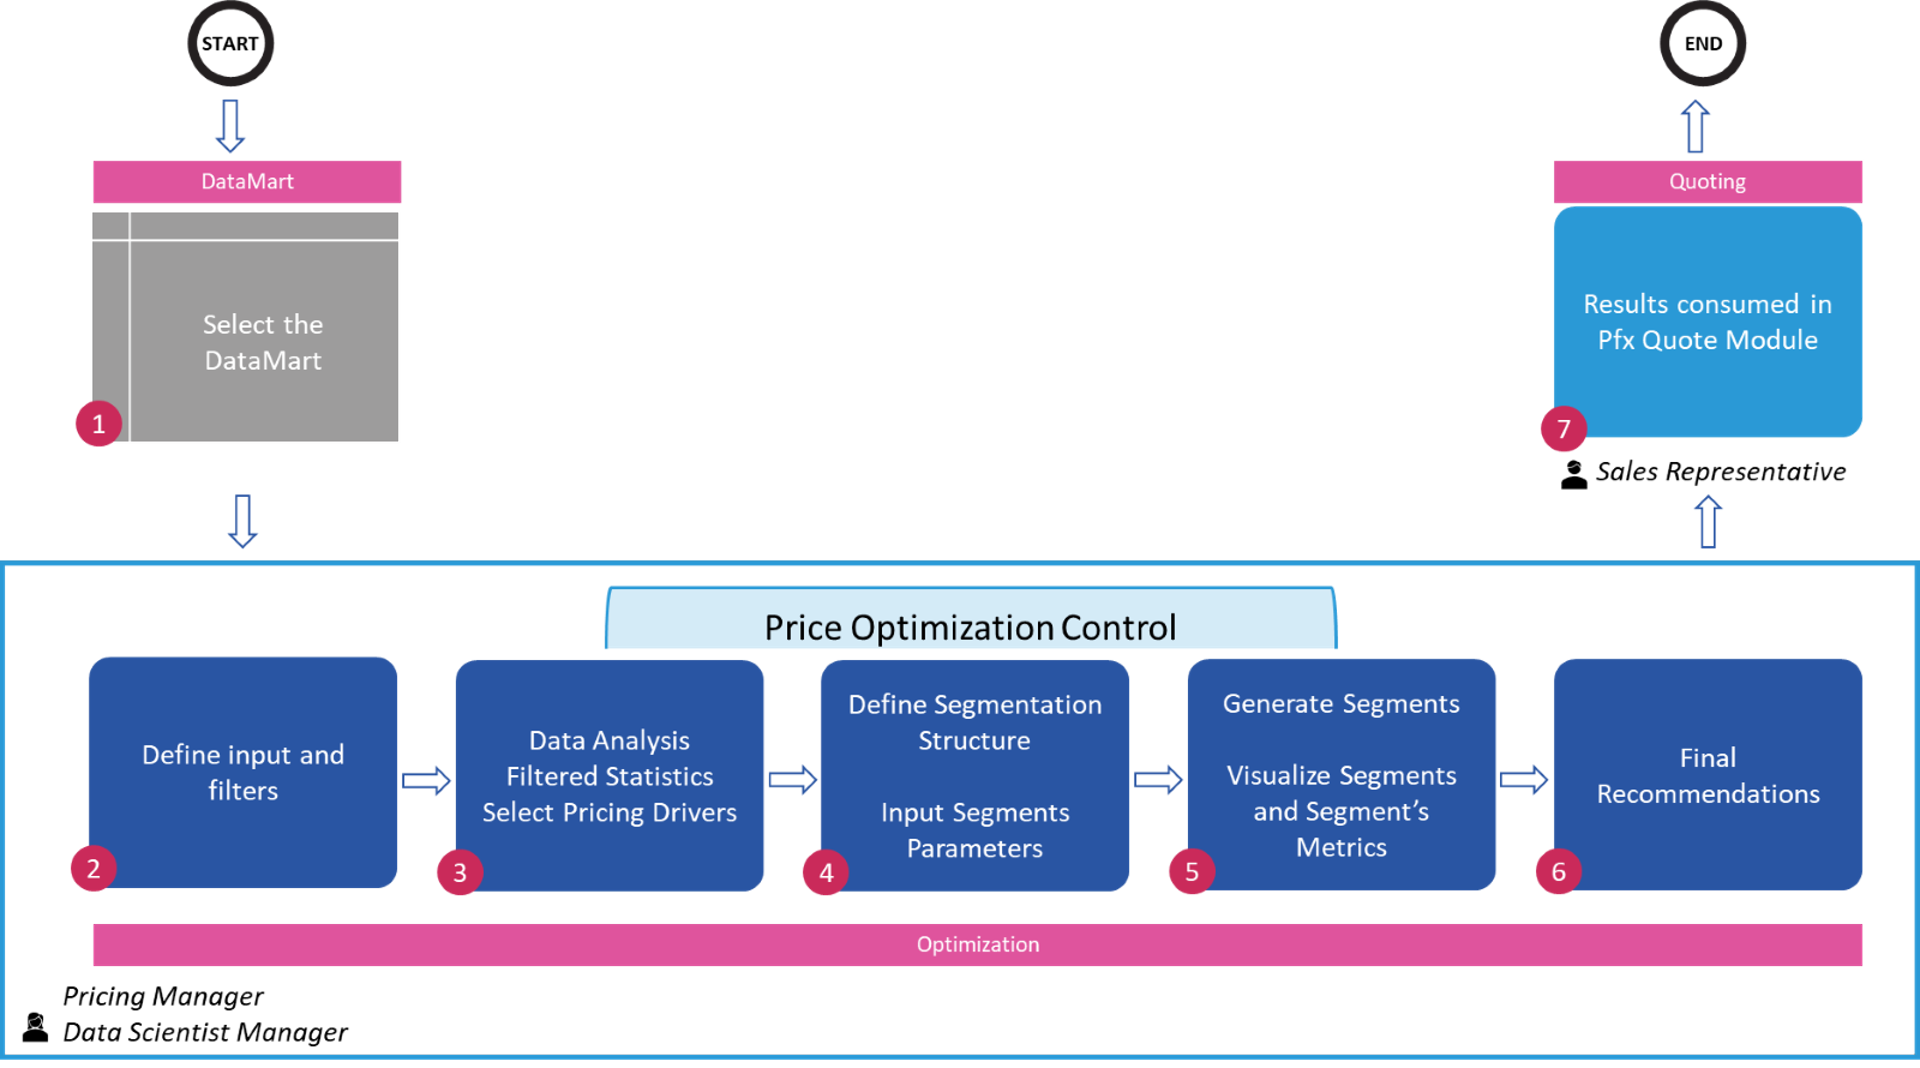
As part of the overall design, it is important first to highlight the prescriptive Negotiation Guidance Workflow that Pricefx will work with our customer in implementing the end-to-end Pricefx Accelerate Negotiation Guidance.
DataMart
Within the Optimization module, the user can select the DataMart that is the subject of optimization.
LEARN MORE: Pricefx relies heavily on good quality data to help you benefit from the best possible SaaS. For this, you need to provide accurate information. To learn more about how you can do this and Data Readiness Methodology, click here.
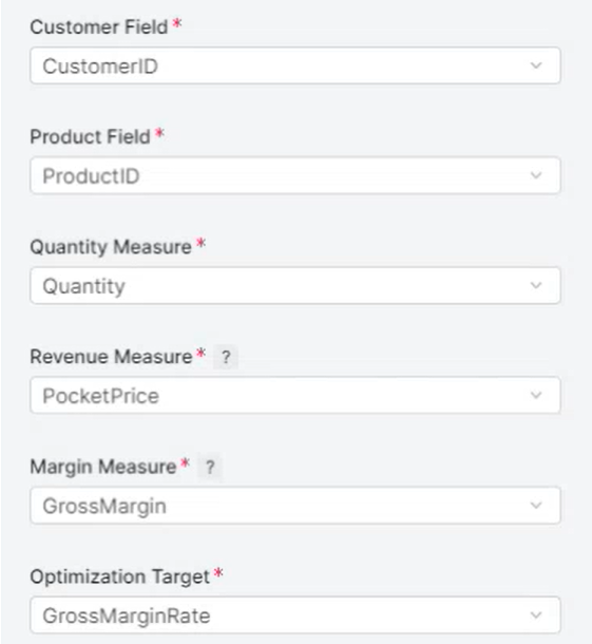
It is important to ensure that data fields listed below are predefined within the DataMart, those data fields will be used as an input for the fast-following steps.
-
Customer Entity and all Customer Attributes considered for the segmentation.
-
Product Entity and all product attributes considered for the segmentation.
-
Quantity Measure
-
Revenue Measure: Pocket Price
-
Margin Measure such as Gross Margin
-
Any data fields required for filters that need to be applied.
These fields must exist in the DataMart:
-
8 -12 potential attributes that may be leveraged in the segmentation structure used to build segments in negotiation guidance.
-
Strategic: attributes considered should be aligned with a customer’s pricing strategy
-
Available: attributes should be available in the historical data and at the time of quote
-
General: attributes should be relevant for a large portion of the business being processed in negotiation guidance
-
Compact: attributes should not have more than 20 distinct values to avoid manufacturing sparse segments (rule of thumb)
Inputs and Transactions Filters
-
Inputs: Two inputs:
-
Target Type: Pocket Margin %
-
Weight Measure: such as Pocket Price, Gross Margin, or Quantity.
-
Transactions Filters: will leverage Pricefx robust data filtering capabilities.
-
It is important to include transactions data from the last prior two years.
-
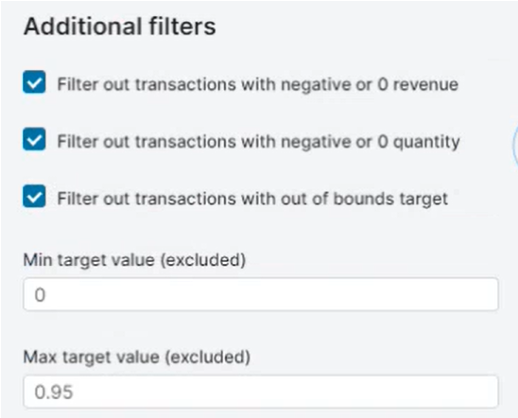
It is important to remove irrelevant transactions that will influence the recommendations such as Returns, Promotions, and Credits.
-
It is important to remove any transactions that exhibit negative margin, negative revenue, or transactions that have odd margin (example: margin greater than 99%.
-
Specialized Customer
-
Intercompany transactions
-
Large, heavily managed accounts
-
Specialized Products
-
Sample products
-
Shipping codes
-
Temp Product codes
-
Isolated / Specialized Geographies
Pricing Drivers
Once the scope of the data is defined, then the user will be able to select the relevant pricing drivers. Pricing drivers are the relevant Products, Customers and Transactions attributes that potentially will help in explaining the variations in the Pocket Margin %.
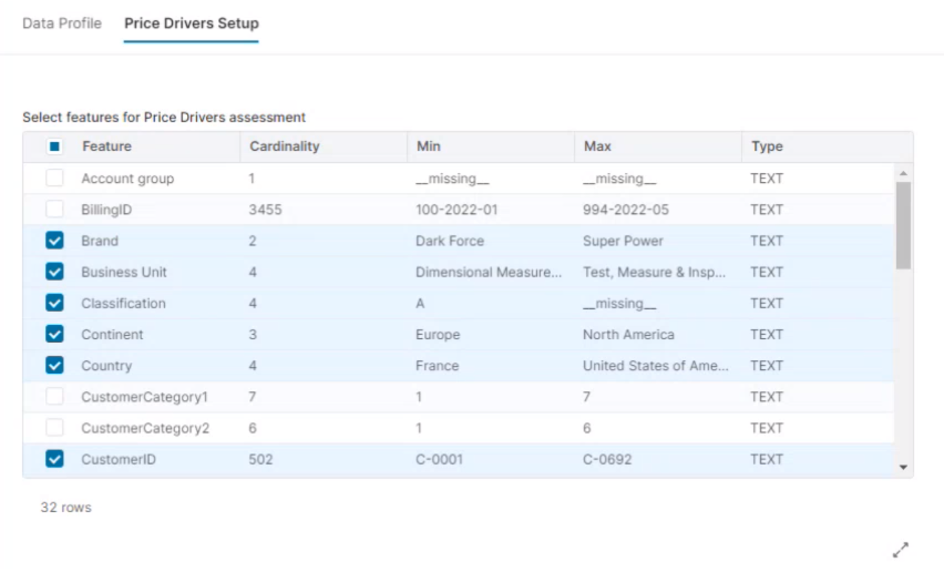
(Optional Pricing Driver – Derived attribute)
Customer Revenue Spent: System will calculate the 12-month revenue spend of the customer entity to be used in price optimization.
Customer Revenue Spent table structures (to be managed outside the Optimizer module)
|
Customer Revenue Spent |
Percentile |
Min Revenue (Calculated) |
Min Revenue (user override) |
|
Large |
70% |
$154,320 |
$150,000 |
|
Medium |
30% |
$24,600 |
$30,000 |
|
Small |
0% |
0 |
|
|
Customer Parent |
Customer Name |
Annual Revenue |
Customer Class (Calculated) |
Customer Class (0verride) |
|
11210 |
Patel Brothers |
$184,000 |
Large |
|
|
10595 |
Pete’s Market |
$145,000 |
Medium |
Large |
|
4592 |
Asian American Market Place |
$4500 |
Small |
|
The system will provide diagnostic type of analysis on the selected Price Drivers. This analysis will empower the user with information to determine the Pricing Drivers will be used to structure the segmentation. The analysis will illustrate the Price Driver’s importance (power) in explaining Pocket Margin % variation, along with the Price Drivers relative importance.
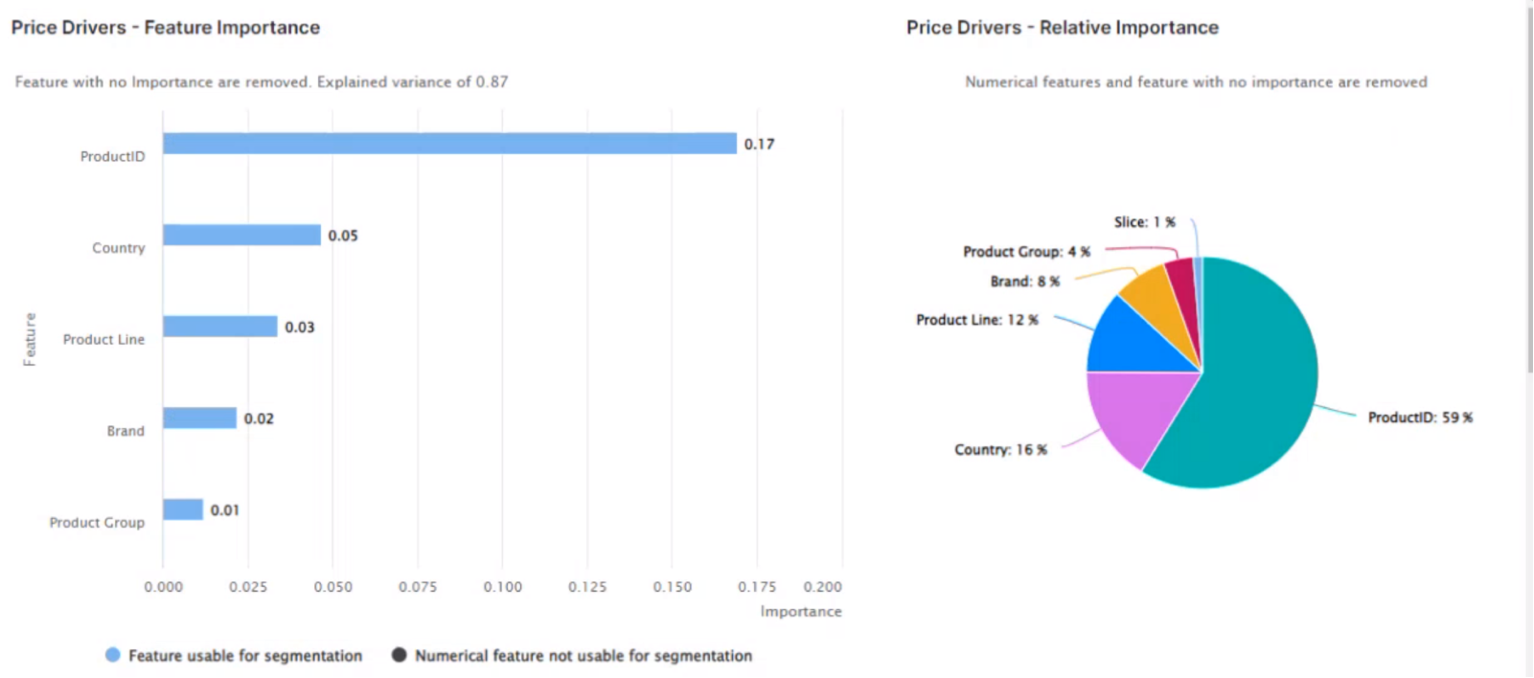
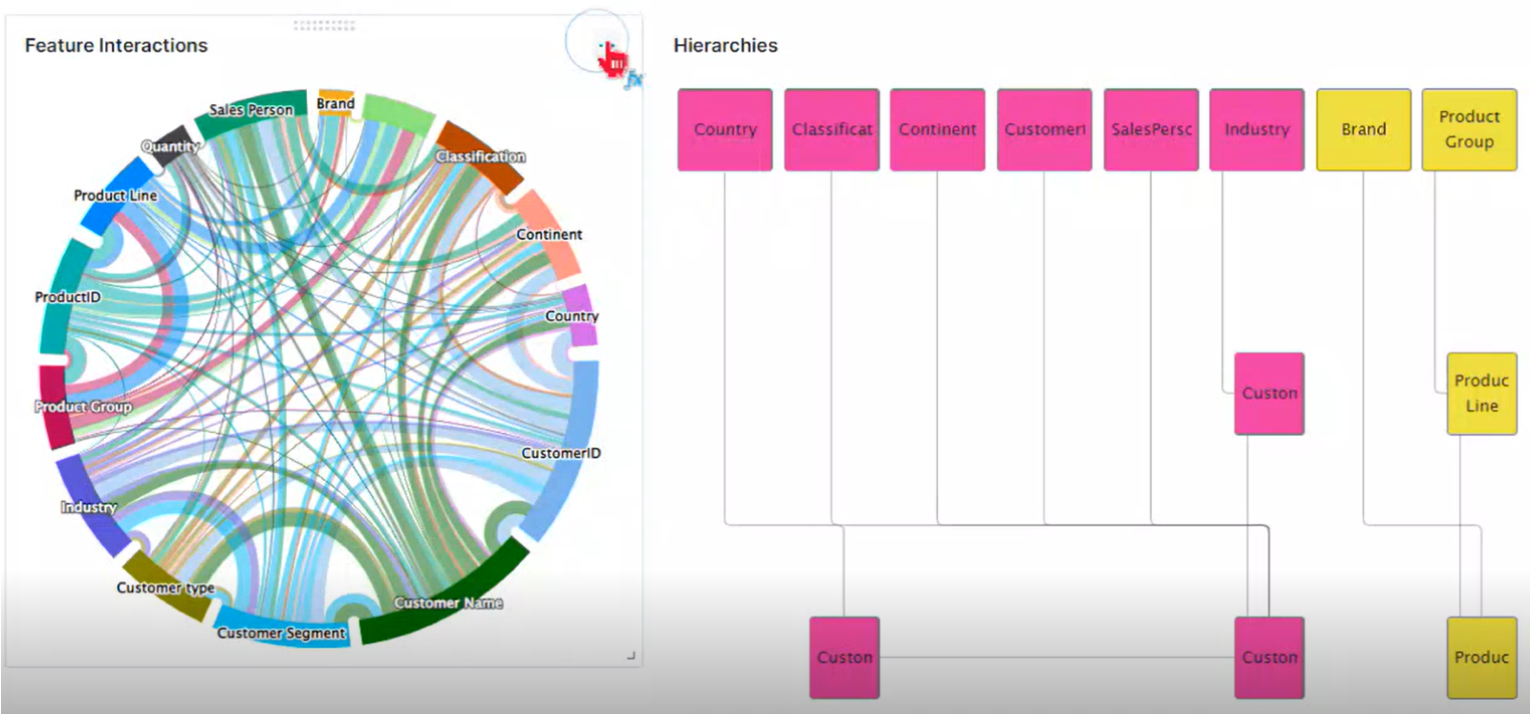
Additionally, the system will provide additional analysis to help deep dive into the inter-relationship between those price drivers. At the end of the process, the user will be able to manually select the relevant price drivers that will form the basis of the segmentation structure.
Segmentation structure
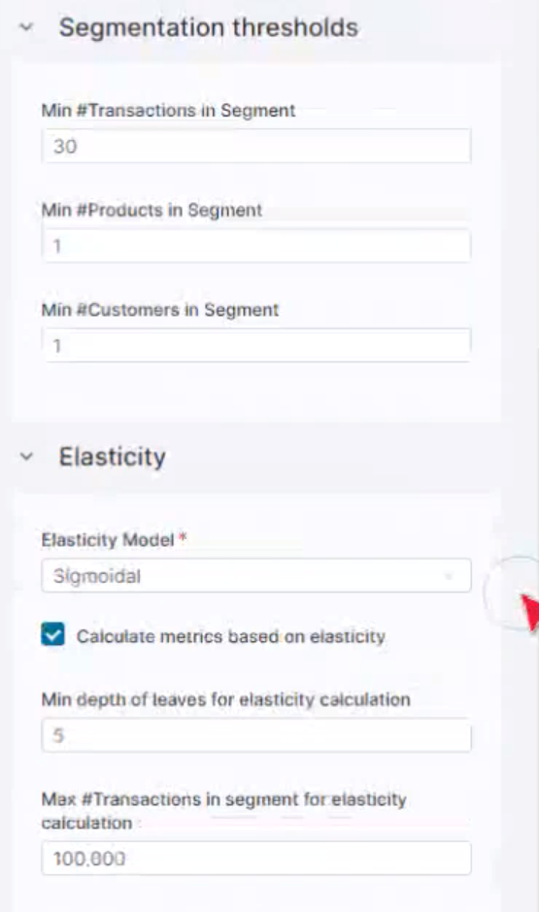
Based on the analysis referenced in the prior step, the system will be able to automatically recommend the Price Drivers to form the basis of the segmentation. The system will rank the selected price drivers accordingly. However, it is important that the user review the recommendation and make an educated judgement that will drive the business moving forward. The user must complete two actions before creating the segmentation structure:
Select the segmentation dimensions.
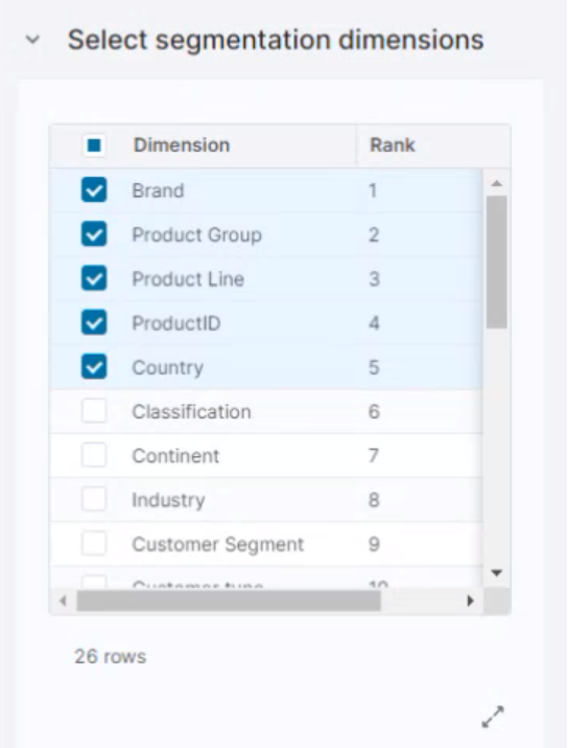
Determine the segmentation thresholds.
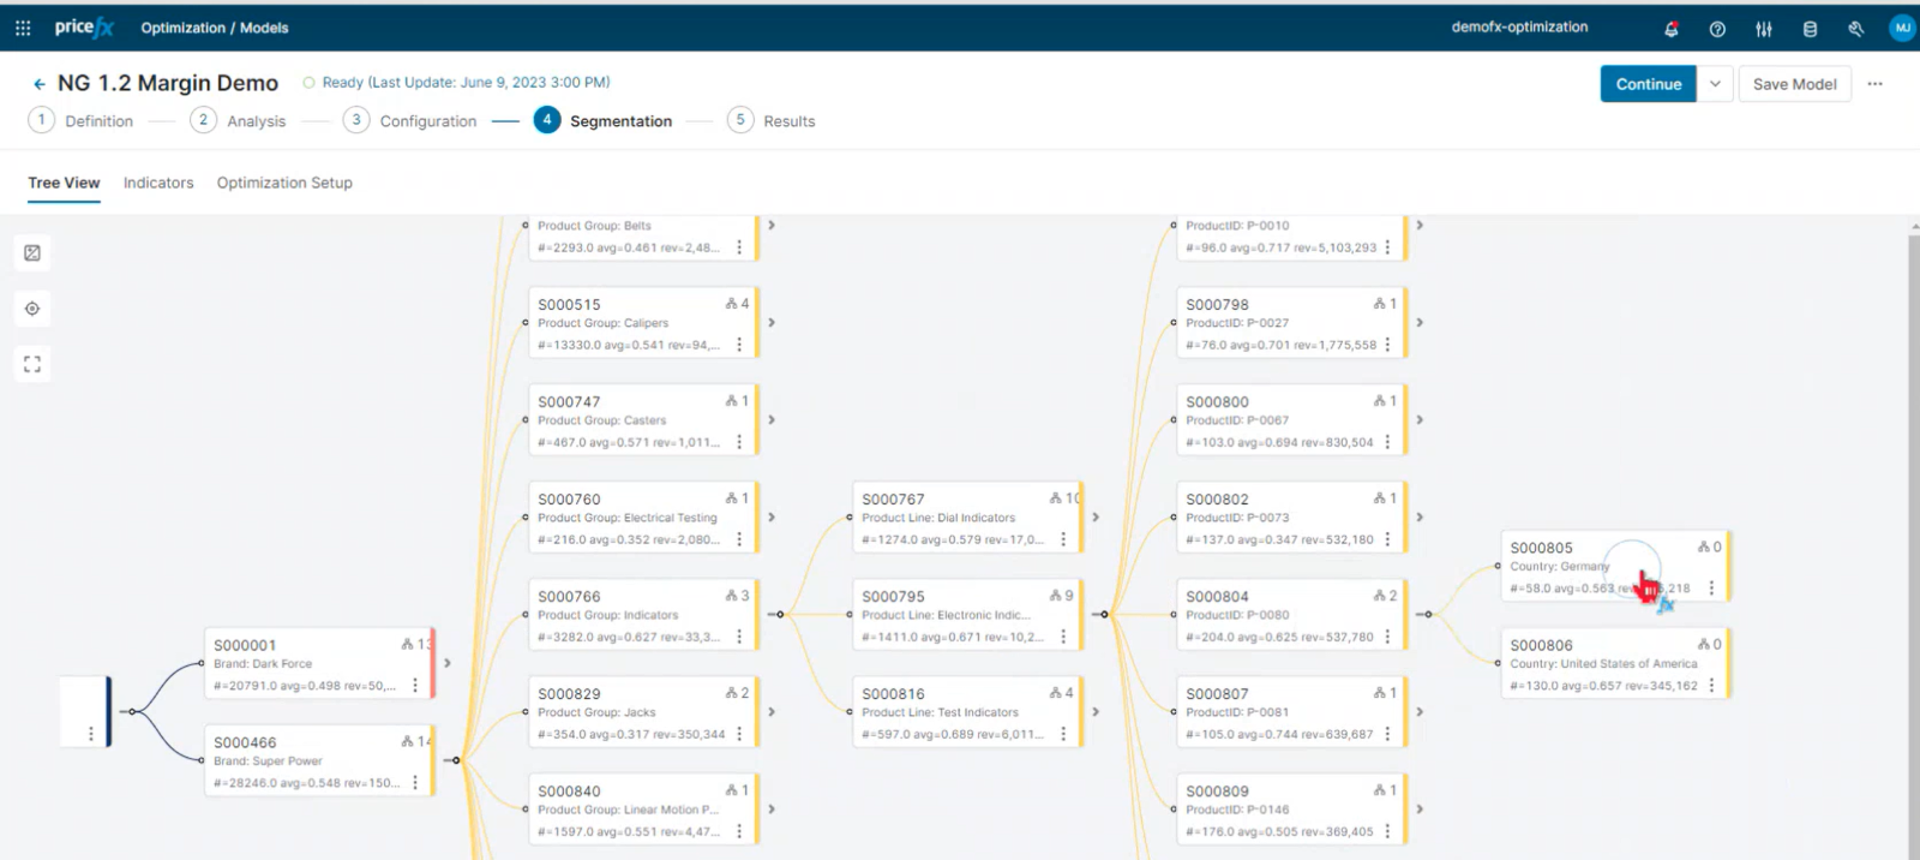
Segmentation generation and visualization
Based on the prior setup, and the system will generate the segmentation structure accordingly. The user will be able to visualize the segmentation and traverse the segmentation hierarchy as illustrated in the image below.
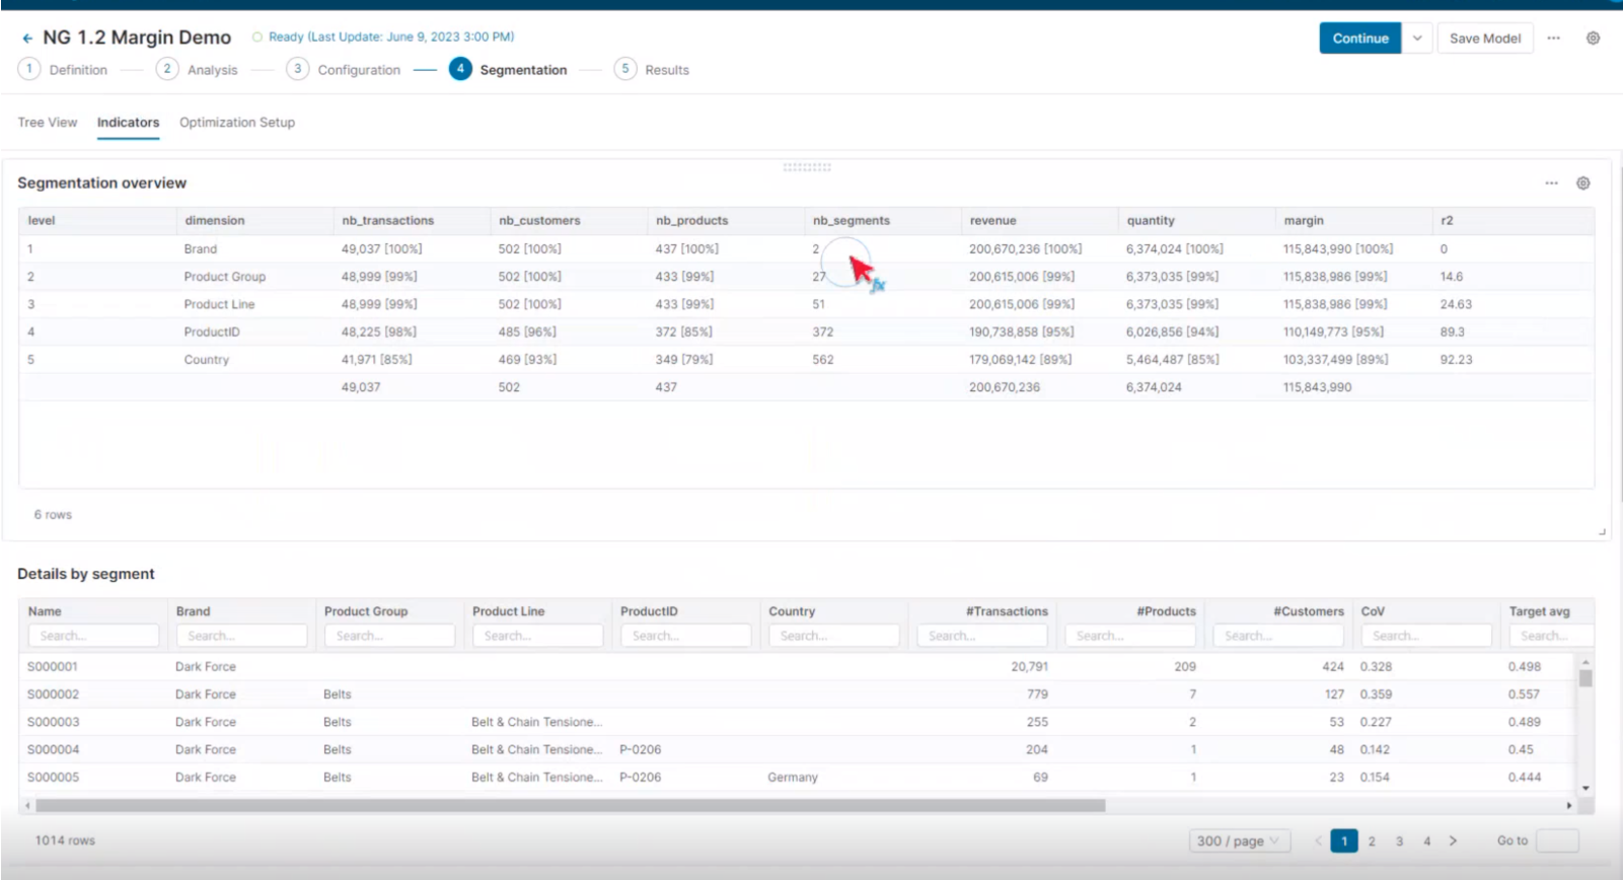
For each one of those leaf nodes, the system will calculate corresponding metrics that will provide 360-degree view on the segments. The following images illustrates the difference metrics and analysis that are autogenerated for each leaf node:
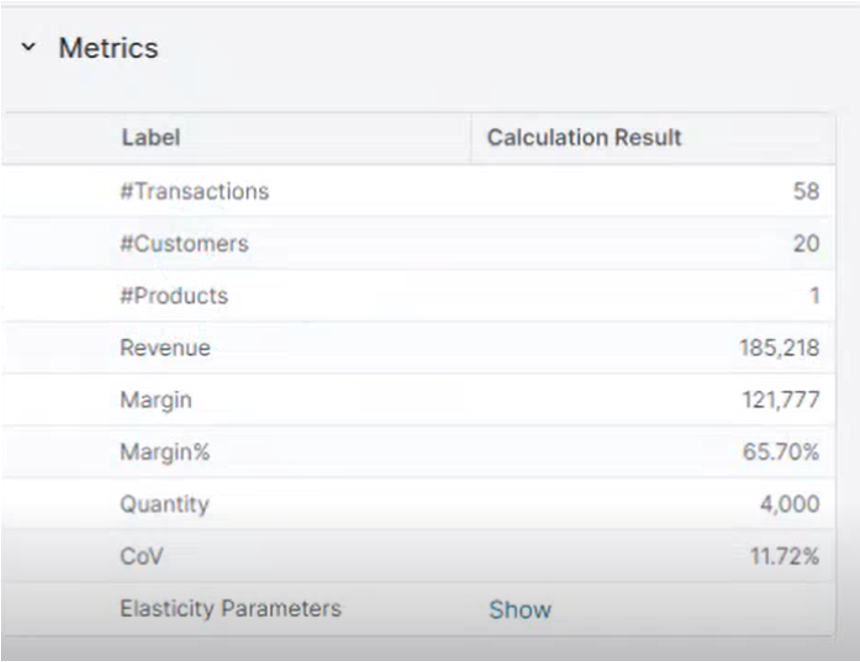
Segmentation leaf level metrics
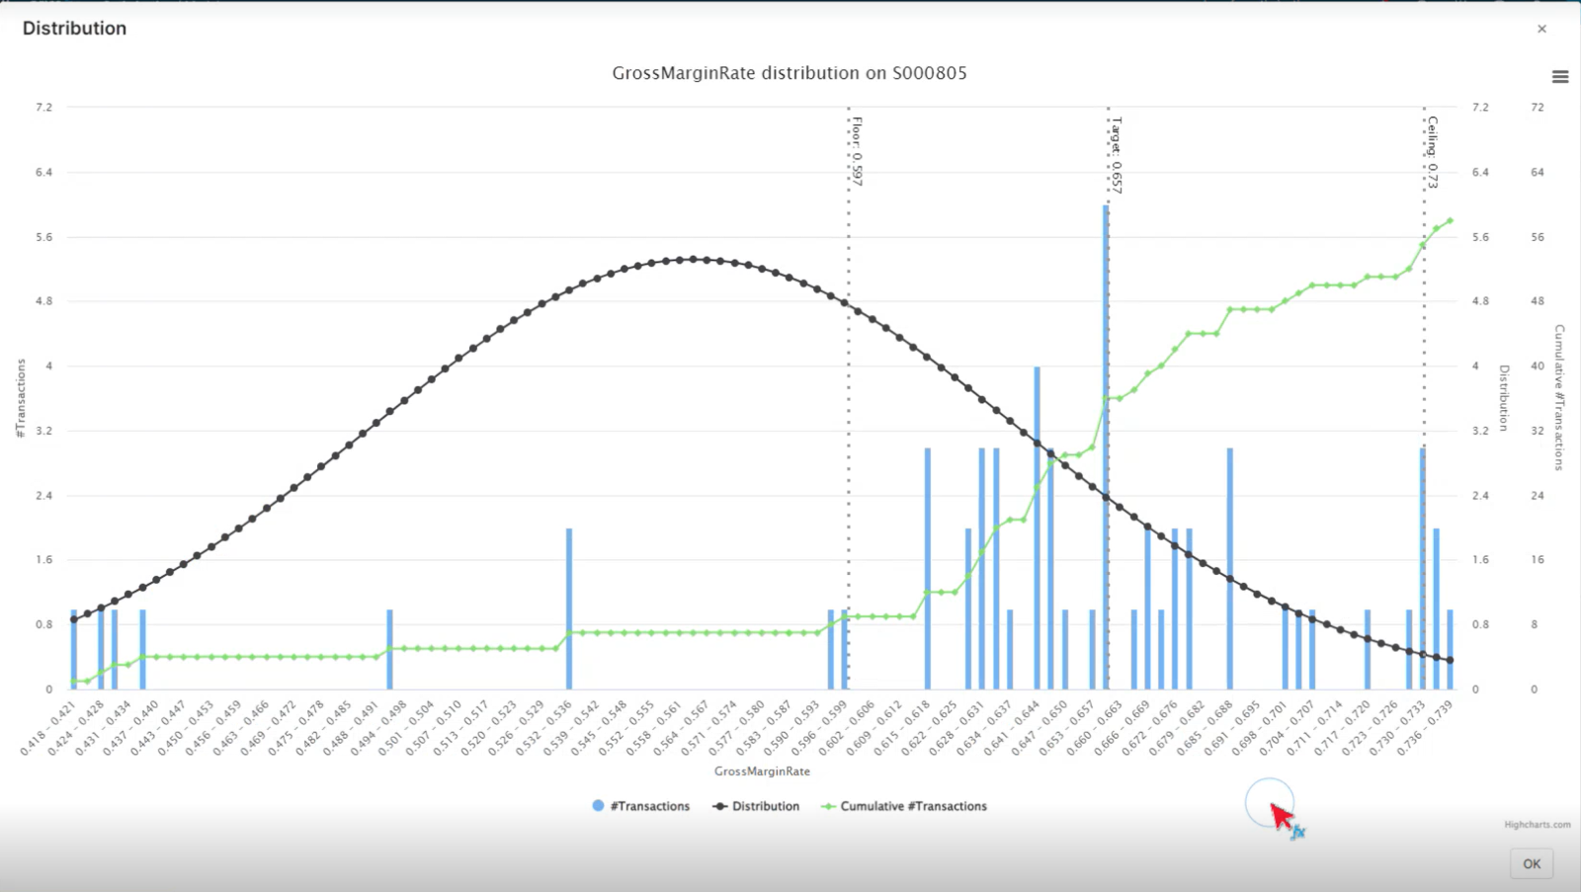
Segmentation metric distribution (at the leaf level)
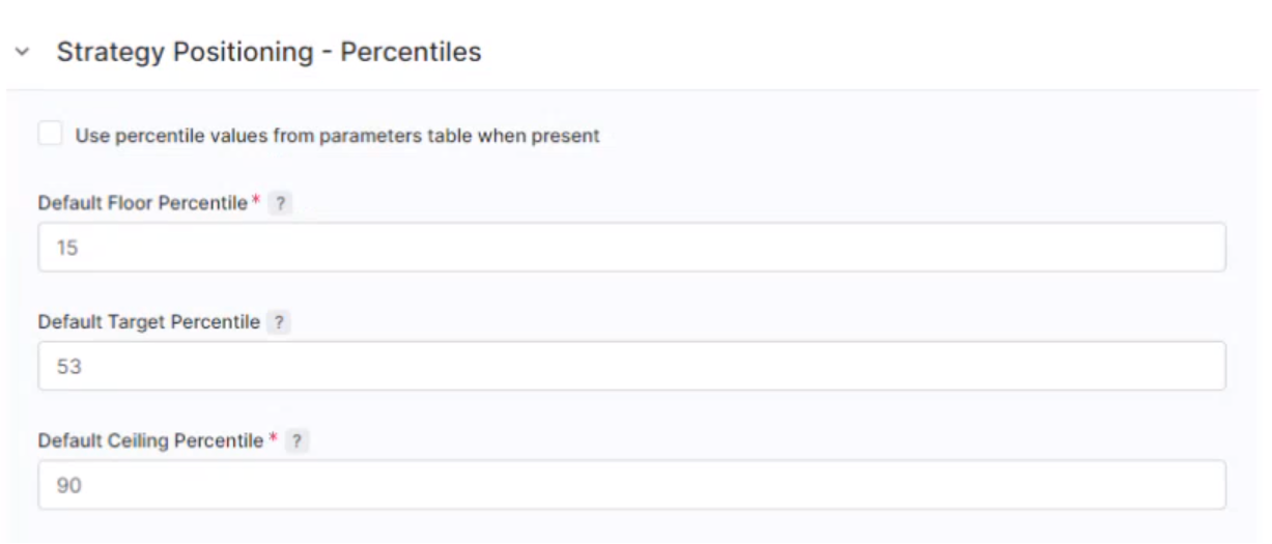
Once the segmentation structure is created, the user should be able determine the percentile parameters that will be used to calculate the Floor/Target/Ceiling margin recommendations for each one of those nodes.
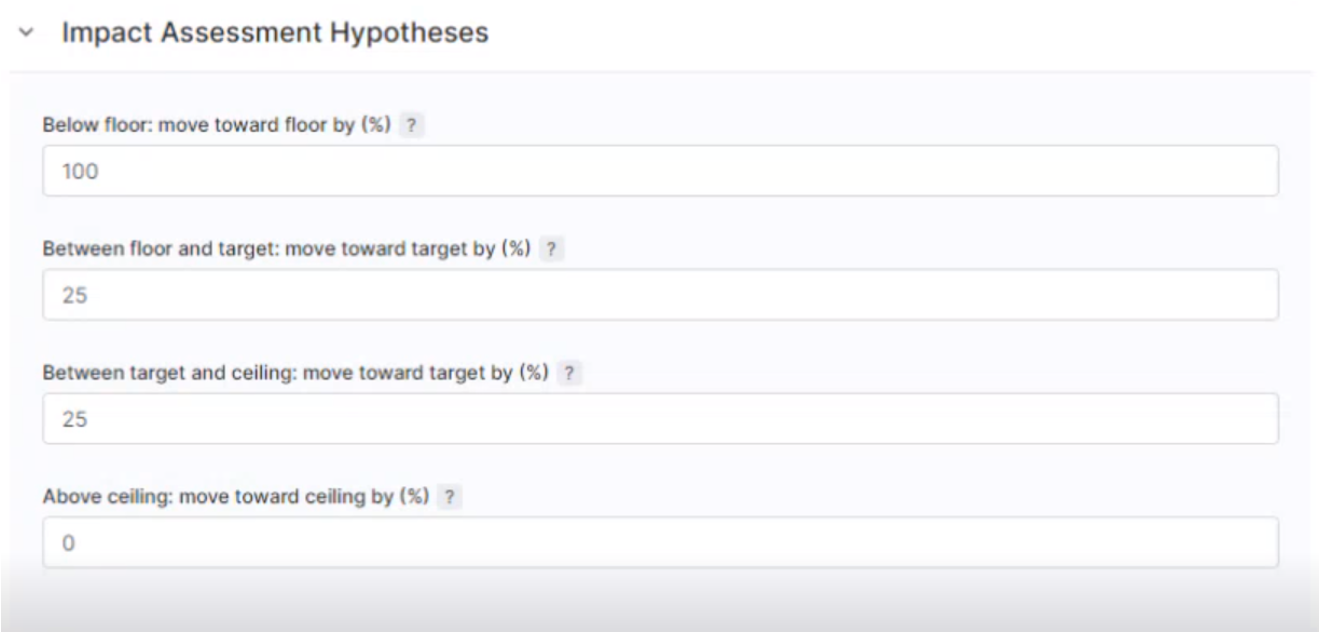
In parallel and as part of helping the user understand the financial impact on the revenue and margin. The user can provide assumptions around the expected margin attainment. The image below illustrates those hypothesis parameters will be used to calculate the financial impact once the final recommendations are calculated:
Final recommendations
The final recommendations are stored in the “Results” step within solution. The Results step consists of 4 components:
-
Impact: is a prescribed dashboard that provides descriptive sets of charts and analytics that help quantify the potential uplift. Additionally, it will provide capabilities on slicing and dicing the analysis to help the user quickly understand the quality of the potential uplift using the different levels of the segmentation.
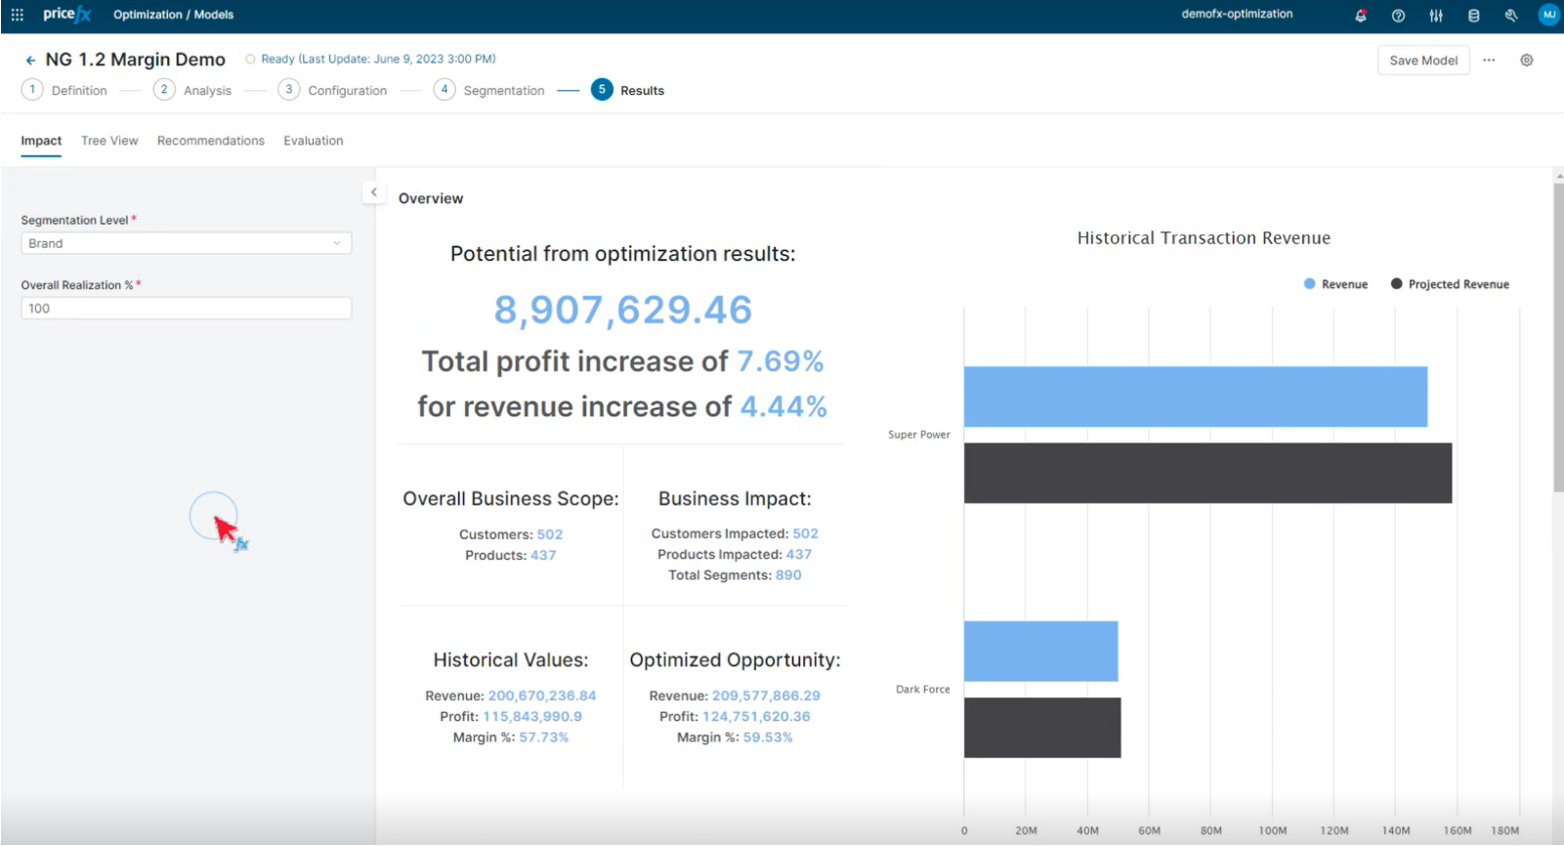
Impact Analysis at the highest level (root) of the segmentation
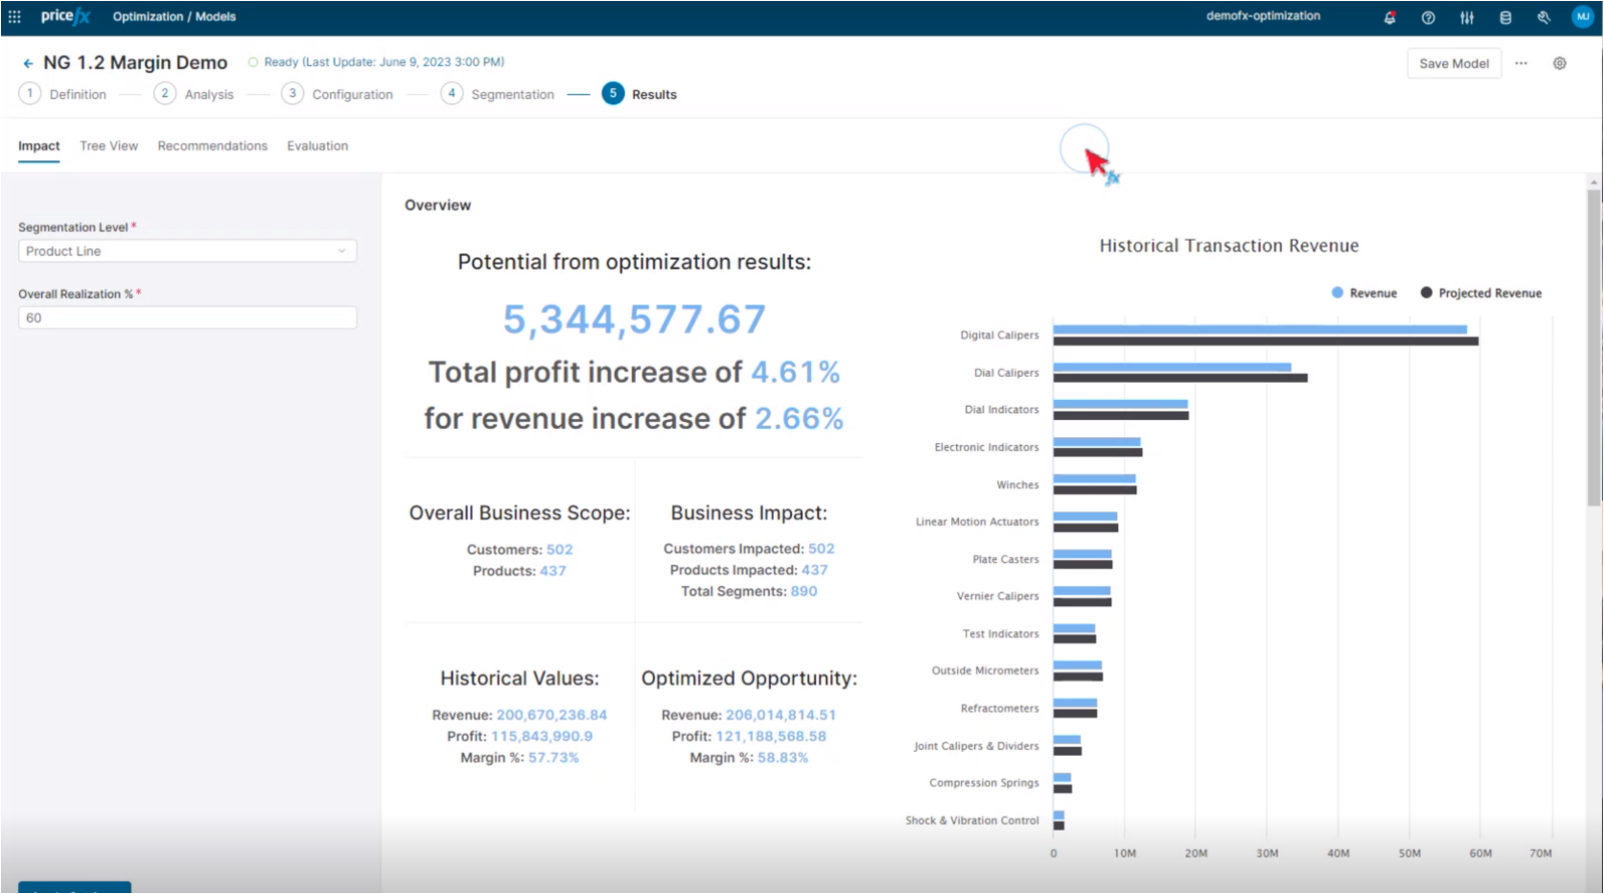
The Potential uplift is assessed for each line of transaction DataMart that is considered part of the data scope. Each transaction will be enriched with Floor/Target/Ceiling Margin % along with the Segment ID. Using the historical Cost of Goods Sold for each transaction, the equivalent Floor/Target/Ceiling prices will be calculated and enriched.
-
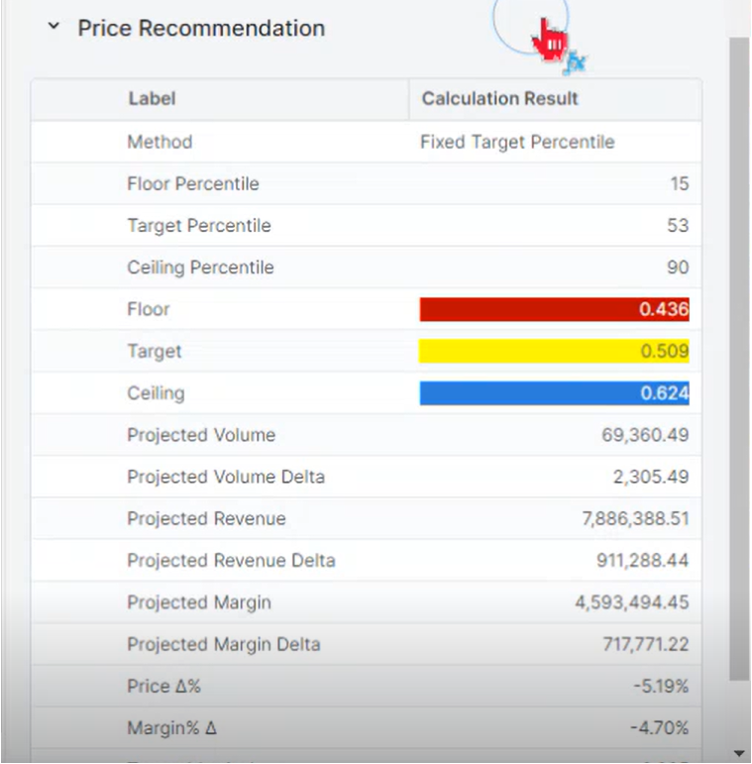
Tree View: it is similar view as in figure # …., the view tree view will be updated with the segment level Price Recommendations
-
Recommendations: within this tab, all segment level recommendations will be stored in a table view. This table will be considered the source of truth for all the data that will be consumed in the downstream processes. Such as Pricefx Quoting.
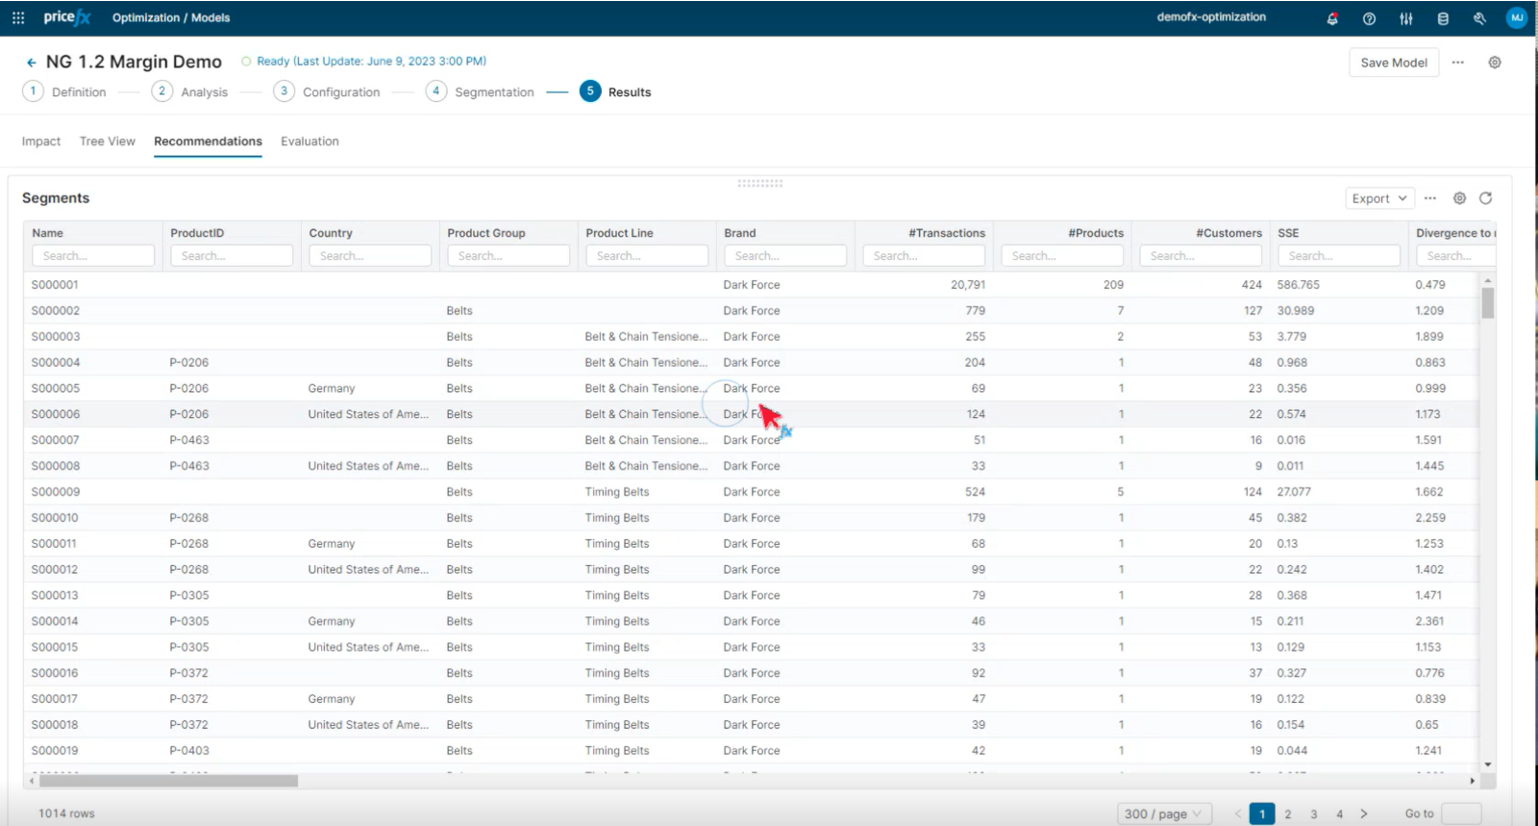
Segmentation Results
Each line in this table consists of the relevant data associated with each leaf of the segmentation tree. Such data includes:
-
Segment ID
-
Segmentation Dimensions
-
# of Transactions, # of Products, # of Customers
-
Statistical values such as: Sum of Error Squared, Divergence to Normal, Coefficient of Variation, Weighted Coefficient of Variation, Standard of Deviations, Weighted Standard of Deviation, Average, and Weighted Average
-
Segment level Revenue and Margin
-
Segment level Floor/Target/Ceiling percentiles
-
Segment level Floor/Target/Ceiling Margin %’s
-
Elasticity
-
Projected Quantity associated with Floor/Target/Ceiling
-
Relevant Revenue/Margin/Quantity deltas.
-
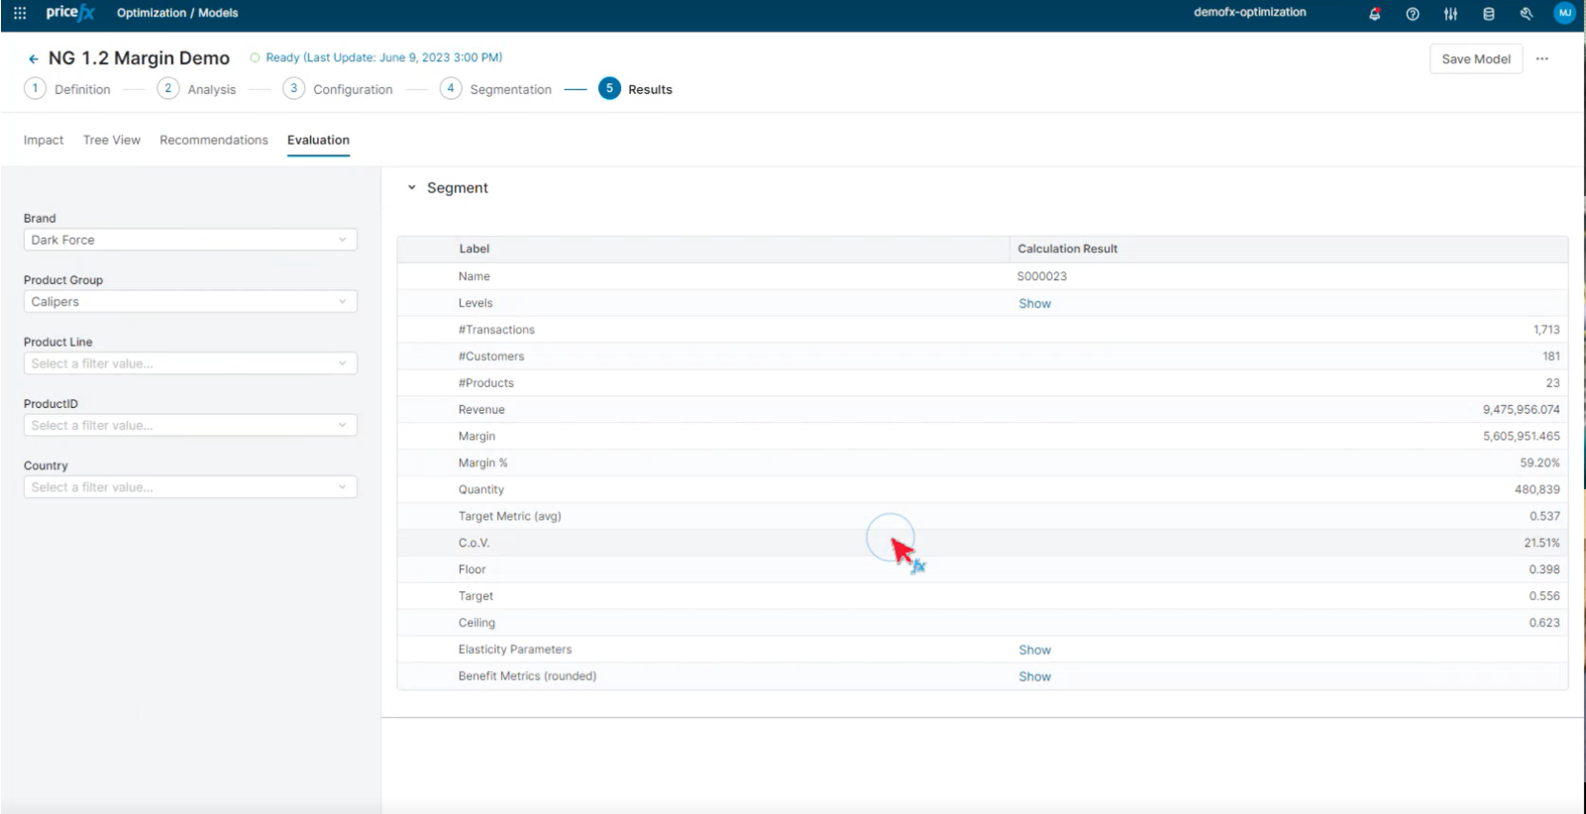
Evaluation: within this tab, the user will be able to retrieve the recommendations based on input values that is associated with the segmentation level.