📽️ Check out a video demonstration for this use case, here.
Every use case has an estimation guide that includes assumptions and questions to determine the configuration level for the customer during the "Scope Validation and Project Readiness Workshop". This will aid in estimating the required person days for that use case in a particular industry.
low
medium
high
Please note that this is just an estimate and adjustments based on the client’s needs may be required.
Use Case Situation Description
Comparing company pricing and deal performance using benchmark data in the discrete manufacturing industry provides several advantages such as improved pricing strategies, competitive insights, better negotiations, increased profitability, and data-driven decision making. It helps manufacturers identify areas of over and under-pricing, stay competitive, negotiate more effectively, improve profitability, and make informed business decisions based on real-world market conditions.
Prescriptive Design Requirements
Coming soon
User Stories
Coming soon
Data Requirements
Coming soon
Out-of-Scope
Coming soon
Solution Design
In this use case we are looking at how Pricefx Plasma can help you compare against other players in your industry and make sure that you are at the top or at least on the podium in your industry. For this, there is a capability that you can use out of the box in Pricefx, but you need to provide as accurate data as possible to ensure as relevant a comparison as possible.
LEARN MORE: To understand why data matters in Pricefx and how to provide the best quality data, check our data readiness methodology here.
Good to know: Some of our screens may be different as we are in a demo environment.
Workflow: Step 1 - Company comparison waterfall
Let’s look into how this is done in Pricefx.
In this illustrative scenario, we are overseeing the operations of two distinct business units and we want to closely examine the performance of our paper business unit. For the purpose of this brief demonstration our focus is exclusively directed towards the Executive Summary, a section providing an overview of the most pivotal Key Performance Indicators (KPIs).
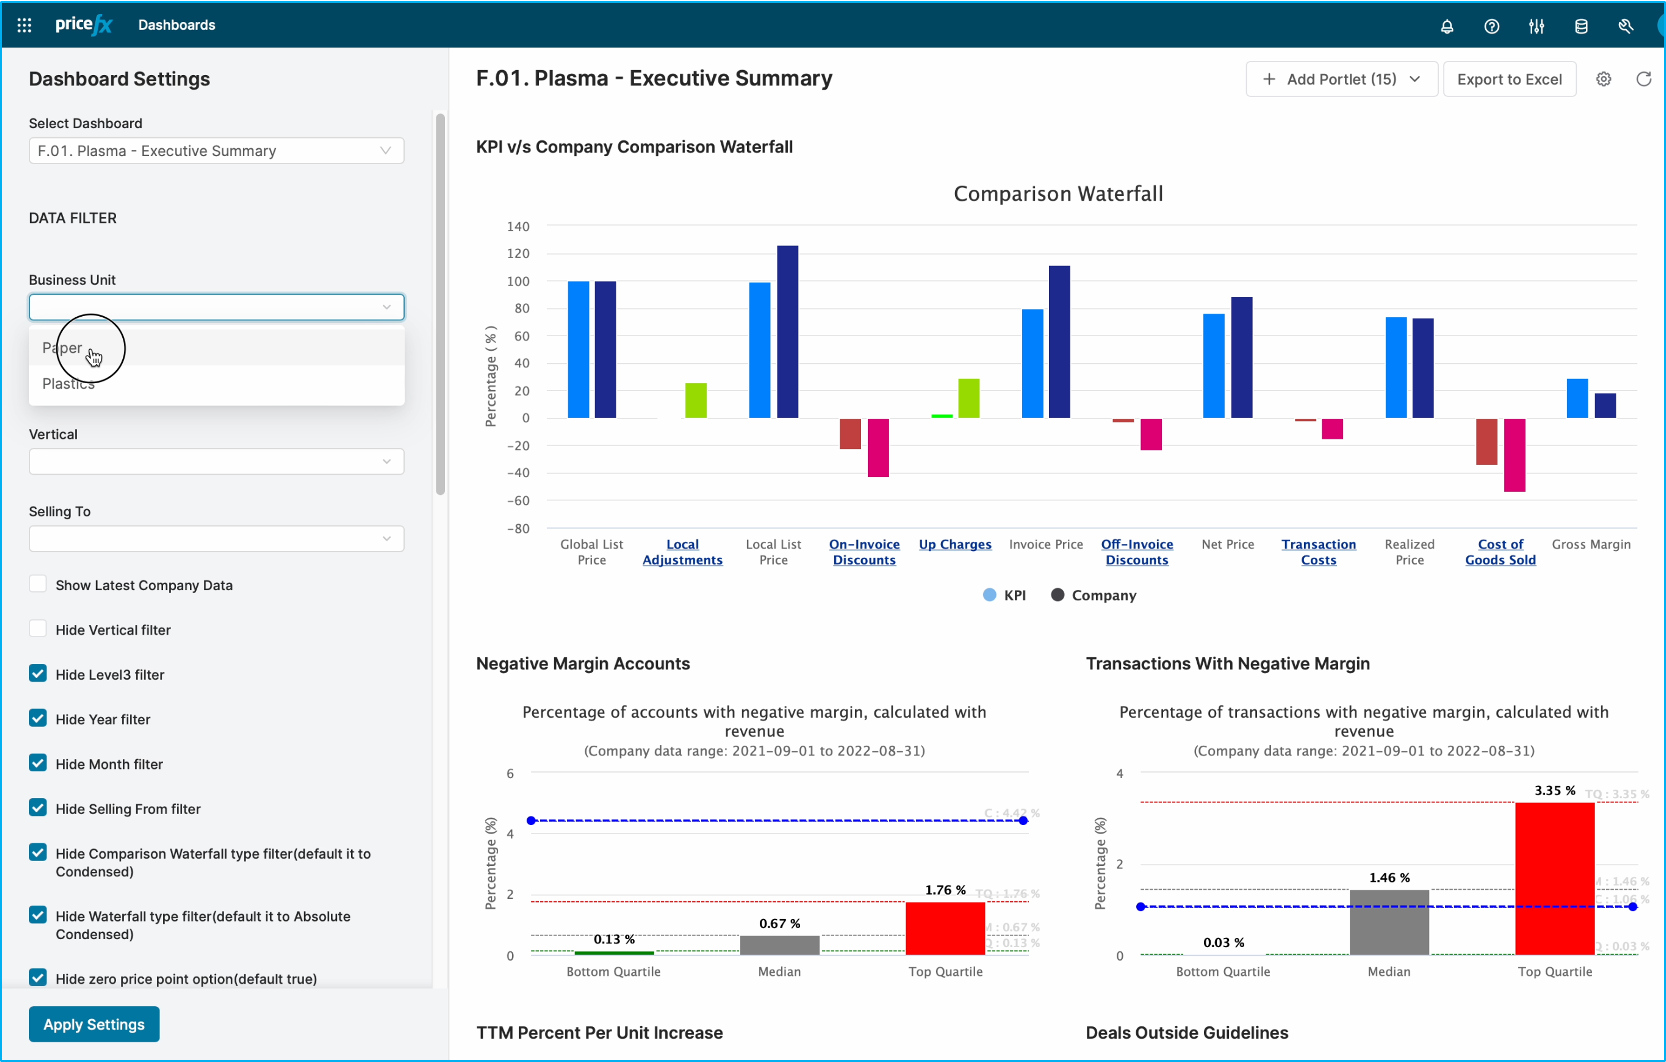
Looking forward at the available charts, we can see that we give almost twice as much of a discount compared to the benchmark. All these elements are grouped, but if you want to know more details, you have the possibility to drill down further into, for example the discounts where you can directly see that while we're in a similar range on the negotiated discounts, we're still offering a comparably high amount of volume discounts, but also a comparably high amount of seasonal discounts which actually barely exist with the competitors.
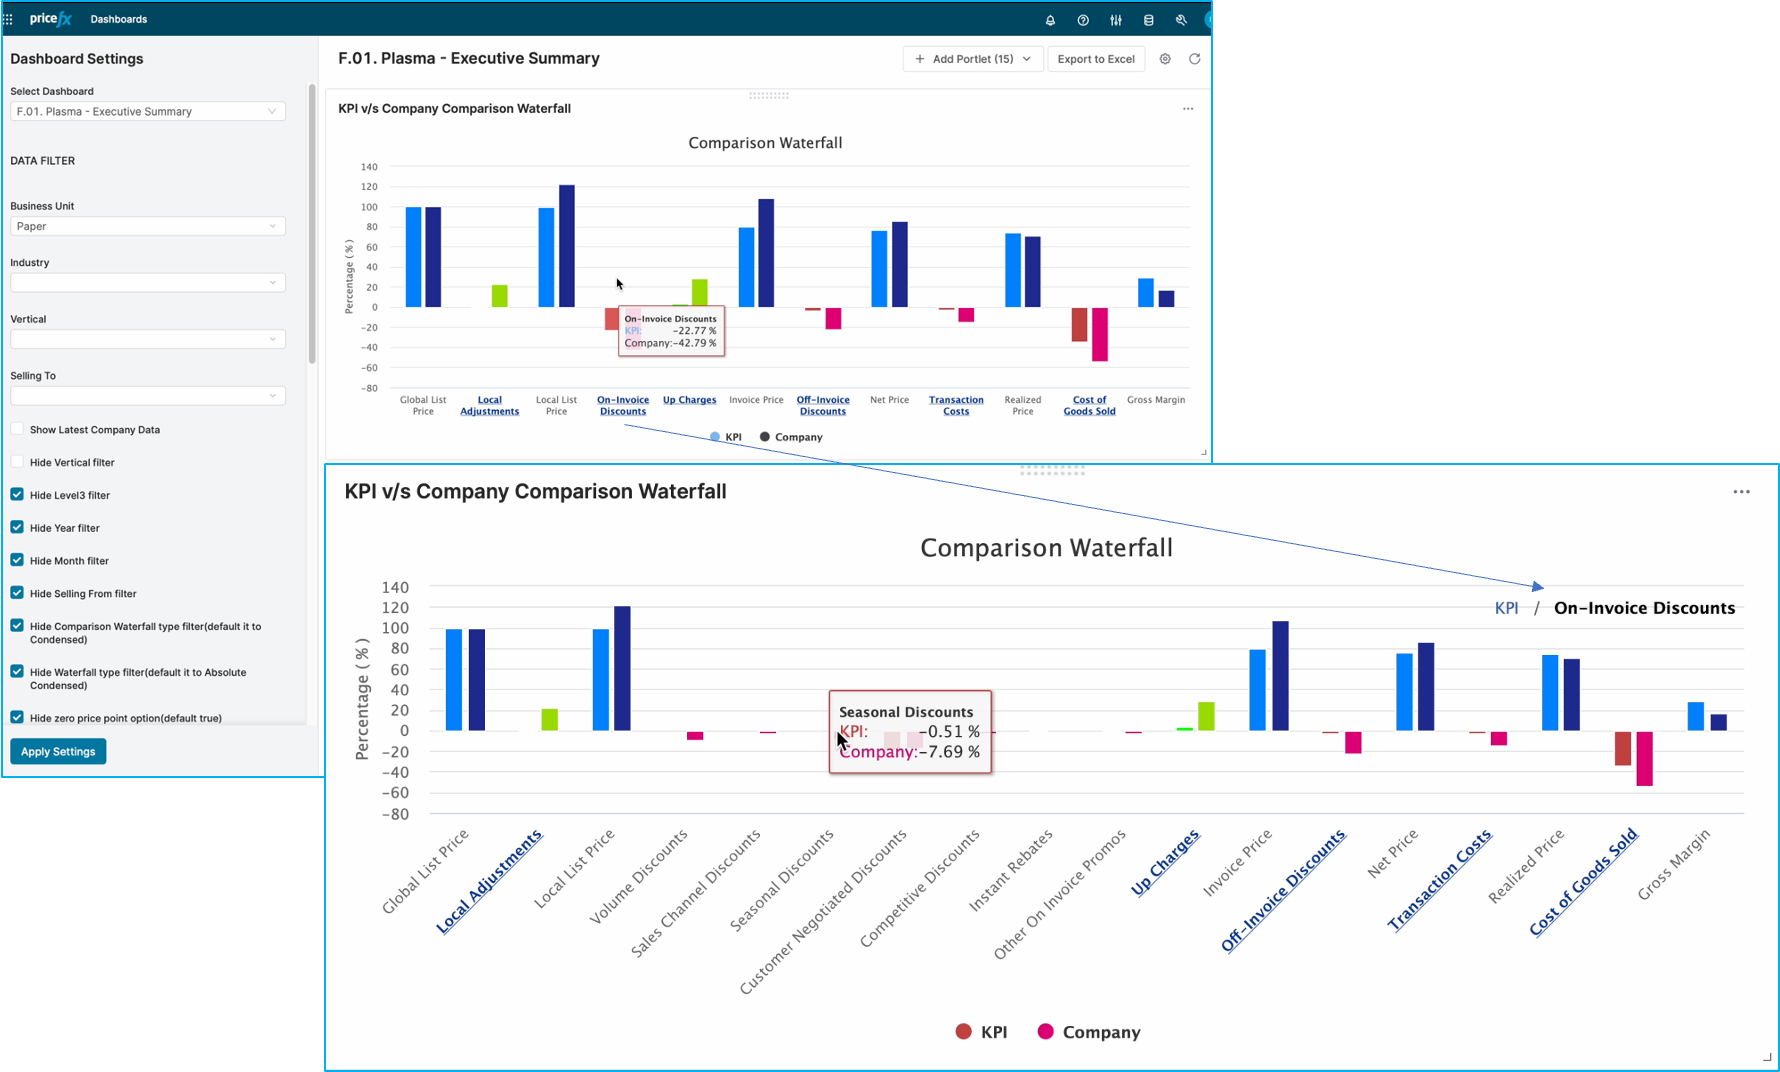
This makes for an excellent starting point for further exploration as it becomes imperative to conduct a deeper analysis to assess the intentional nature and efficacy of our discounts.
Workflow: Step 2 - Dashboards
The charts consist of standard types illustrating benchmark data for the bottom, middle, and upper quartiles within the industry, organized to represent typical performance standards. These quartiles serve as indicative representations of Key Performance Indicators (KPIs) or benchmark data. The colors illustrate whether a particular quartile exhibits relatively robust performance, as evidenced by the green shading, or quite the opposite, indicates subpar performance, as signified by the red color.
For now we will focus on the negative margin accounts. Within this context, we are presented with distinct quartiles: the highest-performing, the median, and the lowest-performing, all plotted against the percentage of accounts with negative margins along the Y-axis. This implies that the most proficient competitors register a mere 0.13 percent of accounts with negative margins, in contrast to the less adept contenders who contend with a higher number at 1.76%. Your data, in this case, our data is represented by the blue line, which signifies a performance metric belonging to a specific case study.
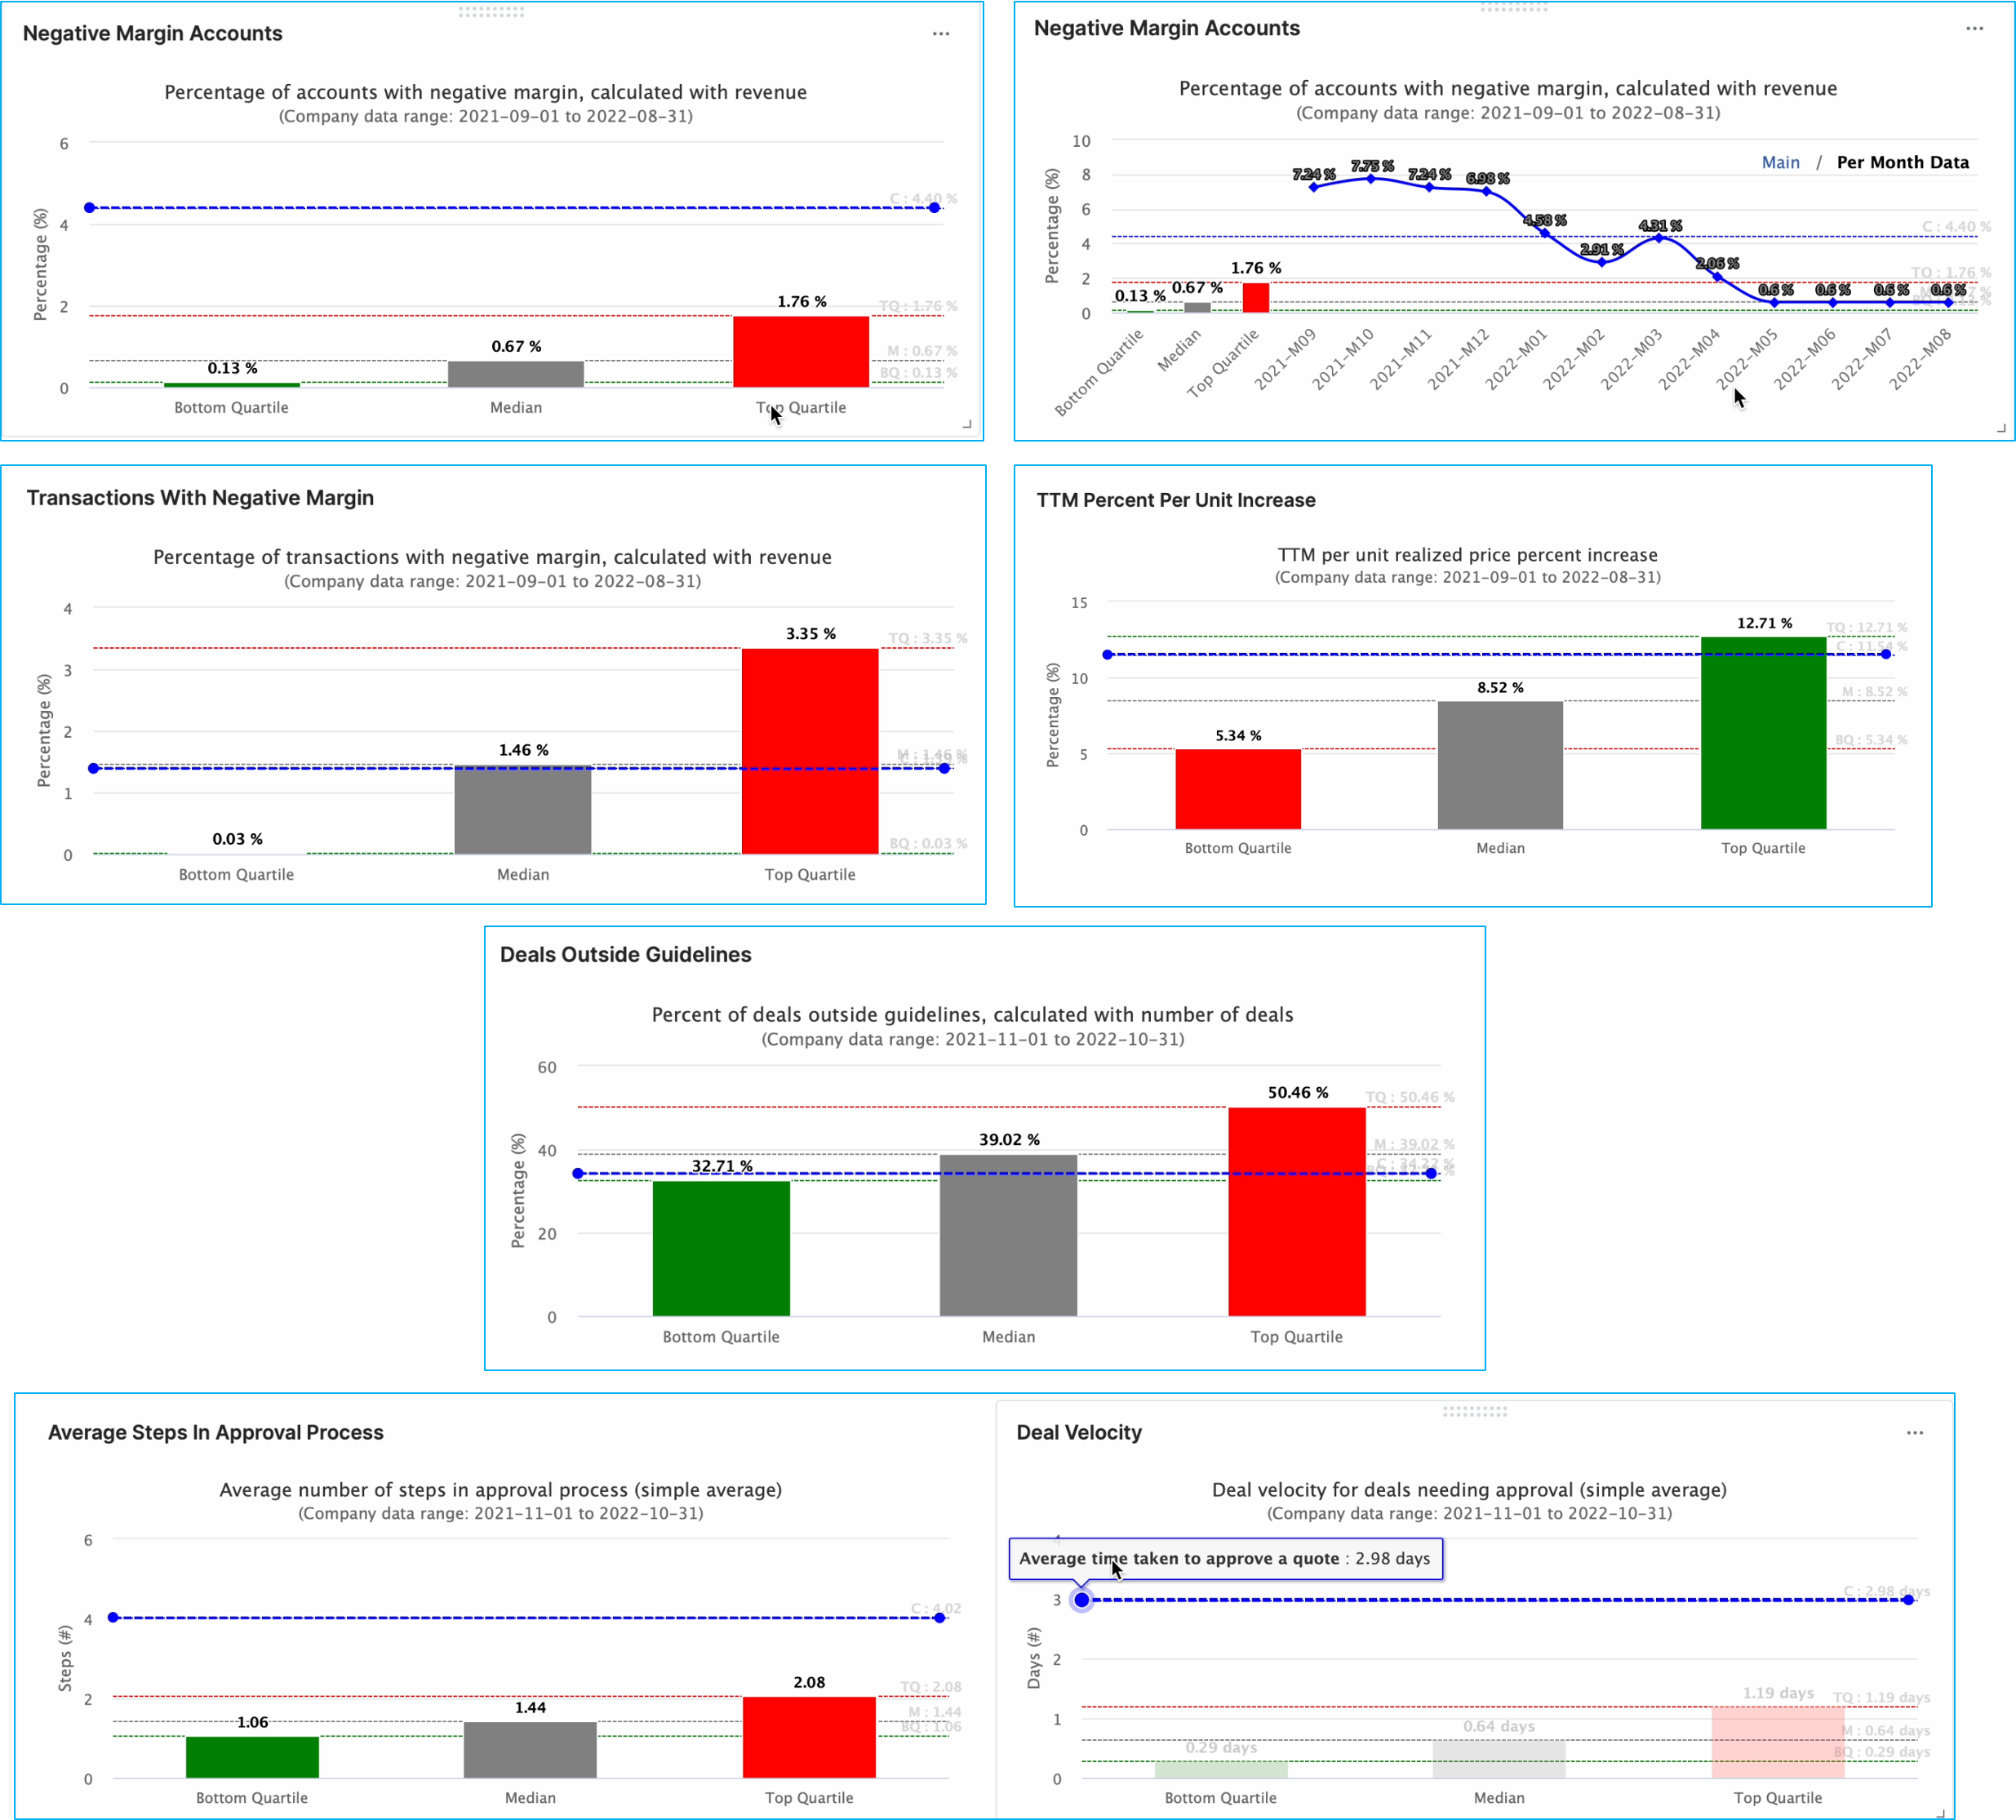
At a first look, our performance appears comparatively lacking when placed against the industry benchmarks. It is worth noting however, that this information depicts a twelve-month timeframe. You can get a more comprehensive understanding of your evolution on a monthly basis. To do this, simply click on the blue line.
Delving deeper into the analysis, it becomes evident that substantial efforts have been expended to address the issue of negative margin accounts (see right screen, top row, above). This could prompt a deeper investigation into the factors contributing to the reduction, as well as the subsequent decline.
The rest o f the charts work on a similar profile illustrating though distinct information, all paramount to manufacturers when it comes to correct pricing in order to be competitive and drive growth and profitability.
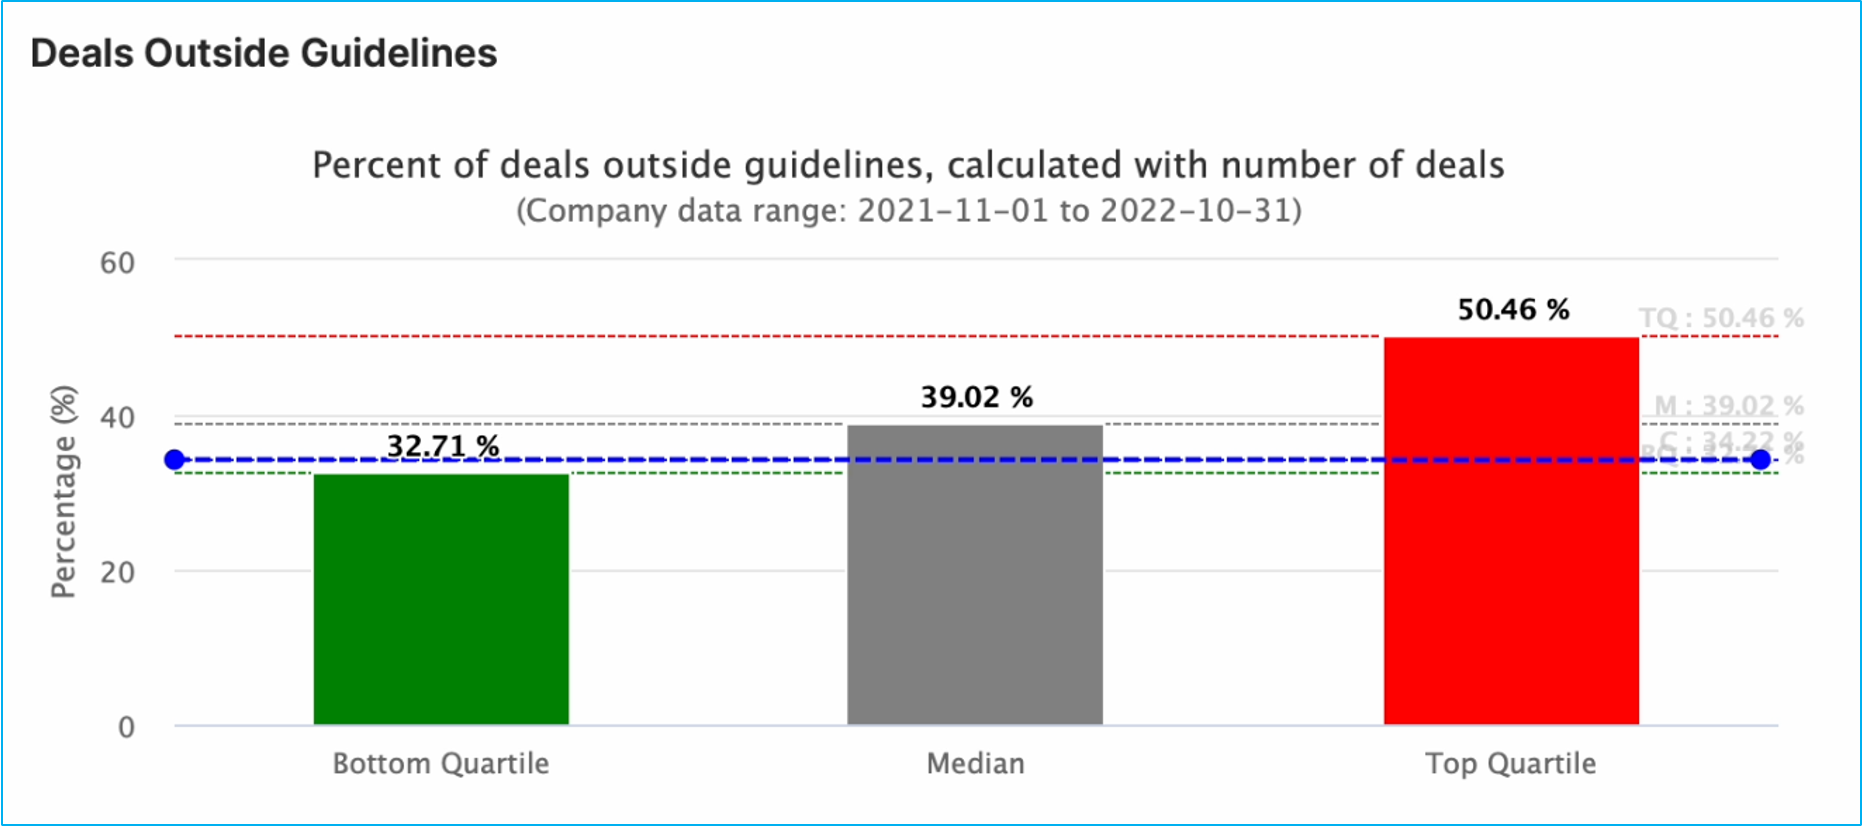
Workflow: Step 3 - Deals outside guidelines
Assessing deals that fall outside established guidelines involves a thorough evaluation of how well those guidelines have been followed over time, measured by the number of quotations. This helps us measure how effective the pricing is and allows us to come up with ways to improve and refine the approval process, which is crucial for providing accurate guidance.
Furthermore, we also look at well the approval process is working, which we can use as a standard to compare against industry norms. This gives us a clear picture of the number of steps involved in the approval process compared to what's commonly practiced in the industry.
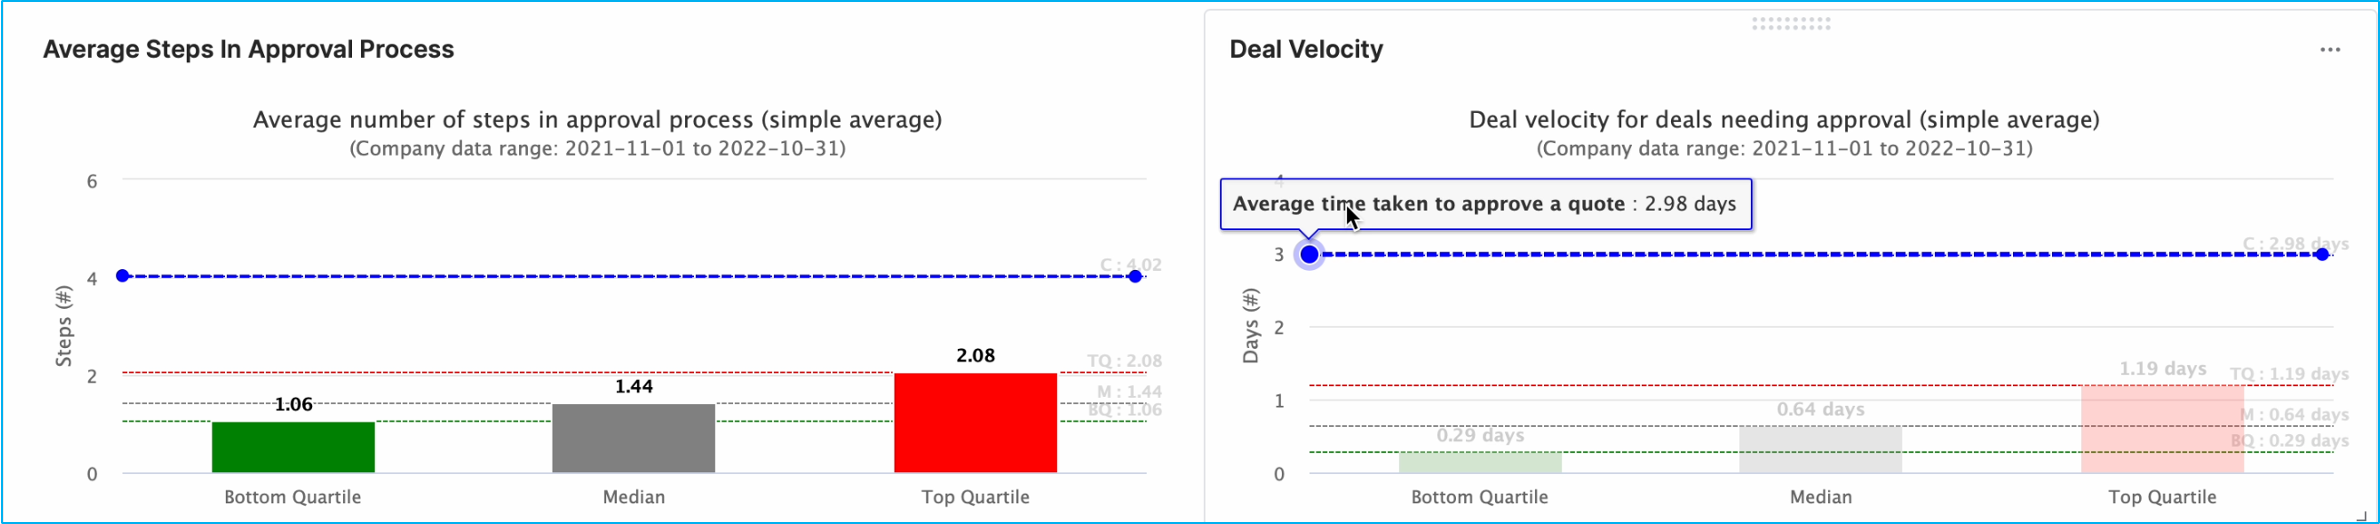
Lastly, let's talk about deal velocity, an important metric. This metric shows us the average time it takes for deals that need formal approval to go from the beginning date to the approval date. By analyzing this metric, we can understand how quickly deals are being closed and track any changes in efficiency over time. For instance, studying recent months can provide us with a more detailed view of these trends.
These aspects together showcase how Pricefx enables a valuable comparison of a company's pricing and deal performance. This is done by utilizing a strong framework of benchmark data, which helps us gain valuable insights and it concludes the flow for this use case.