You can use the Expression Editor to manage the Functions used for the Aggregation of the Measures. Measures are parameters that are used to define analytical data that are visualized in the Charts, Rollups, and Actionable Insights. The Expression Editor provides a graphical user interface that helps you create and edit the Functions.
See the complete list of the available expressions Datamart Query Expressions.
Create Measure
To create a new Measure directly from the list of pre-defined aggregation types follow these steps:
Rollups
-
Go to Analytics > Rollups > Rollup Settings > Measures > Add Measure.
-
Select an item from the list.
-
Click Add Item.
-
Under Aggregation select the aggregation type.
-
Click Apply and Refresh.
How to add Measures in Rollups
Charts
-
Go to Analytics > Data Analyzer.
-
Select a Chart type.
-
Go to Measures > Add Measure.
-
Select an item from the list.
-
Click Add Item.
-
Under Aggregation select the aggregation type.
-
Click Apply and Refresh.
How to add Measures in Charts
Edit Measure
You can edit an existing pre-defined Measure using the Expression Editor.
Rollups
-
Go to Analytics > Rollups > Rollup Settings > Measures > Add Measure.
-
Select an item from the list.
-
Click Add Item.
-
Under the Aggregation click { } Function.
-
You will be presented with the Expression Editor.
Charts
-
Go to Analytics > Data Analyzer.
-
Select a Chart type.
-
Go to Measures > Add Measure.
-
Select a Chart from the list.
-
Click Add Item.
-
Under the Aggregation click { } Function.
-
You will be presented with the Expression Editor.
Edit Measure Expression dialog
Expression Editor Description
|
Expression Editor Item |
Description |
|---|---|
|
Measures |
You can select from the dropdown:
Expression Editor only works with the aggregated values. You need to either select an aggregated value directly from the dropdown or specify aggregation later otherwise you receive the following warning: non-aggregated value used. |
|
Operators |
Using the following operators you can define a relation between each aggregated value.
|
|
Functions |
You are provided with the following function categories that can be used in your expression.
|
|
Run |
You can test your expression to see if you are getting the expected value. The calculated value will be presented in the Result Preview section. |
|
Visual Editor |
You can switch between graphical and text representations of your expression. |
When you define an expression for your measure you always need to specify a concrete argument otherwise you receive the following warning: Missing argument.
Expression Examples
Below you can find the most common expression examples.
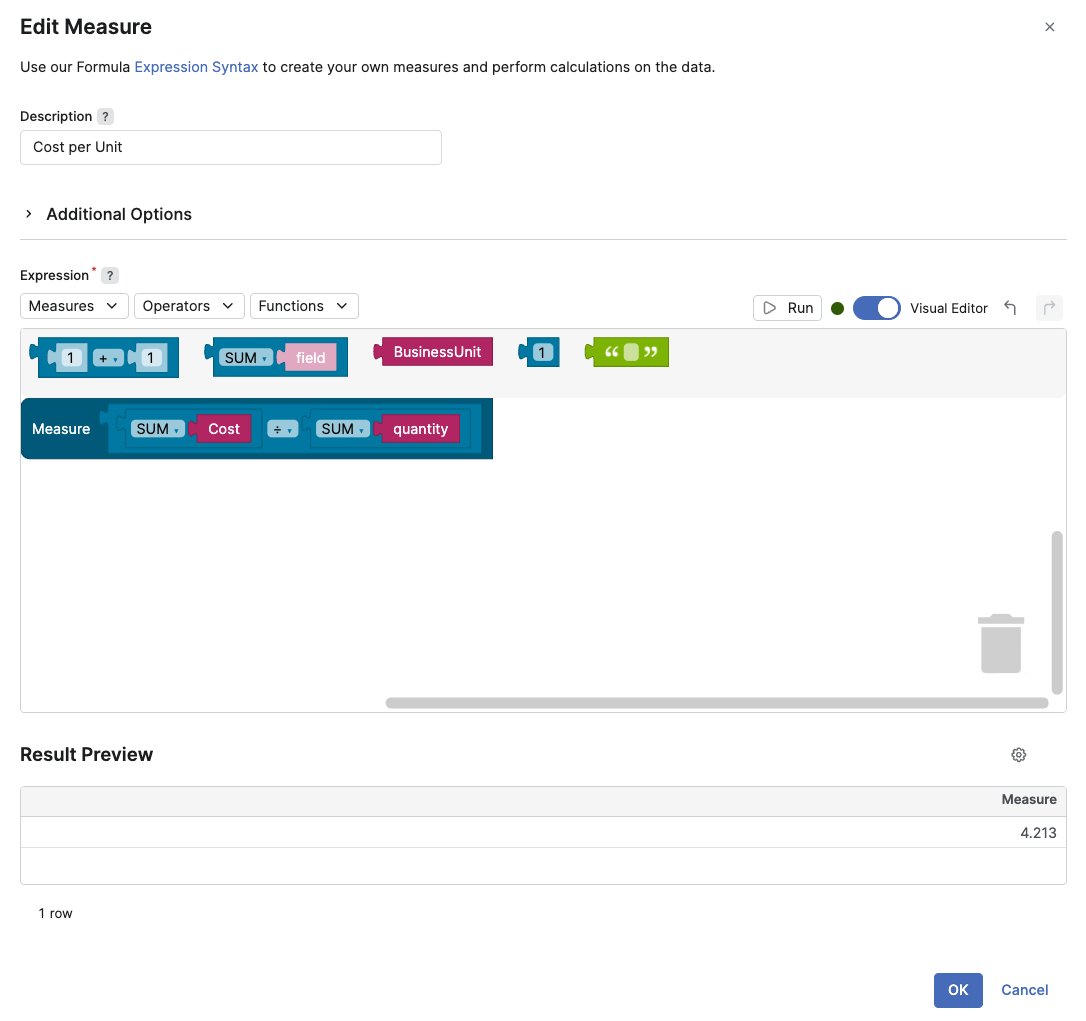
Cost per Unit
This is a typical example of an expression that has two aggregated SUM values that are divided.
How To
Result
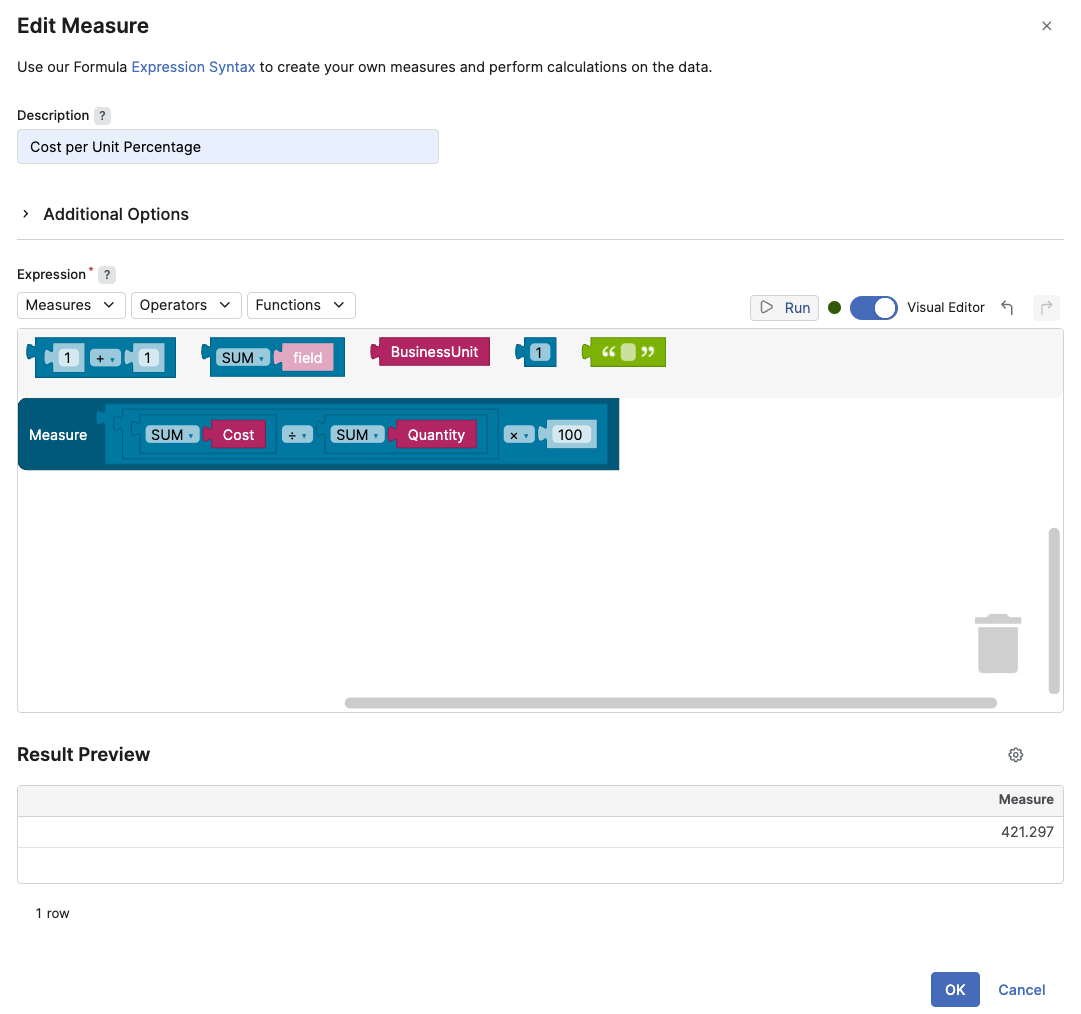
Cost per Unit Percentage
How To
Result
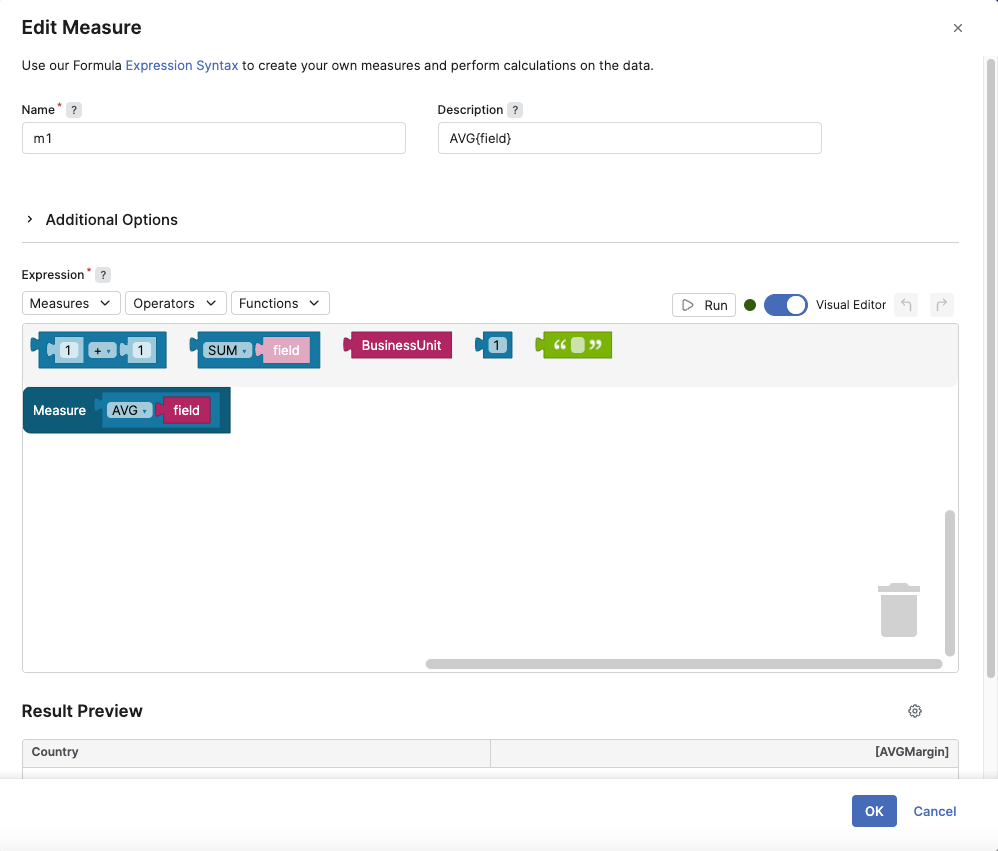
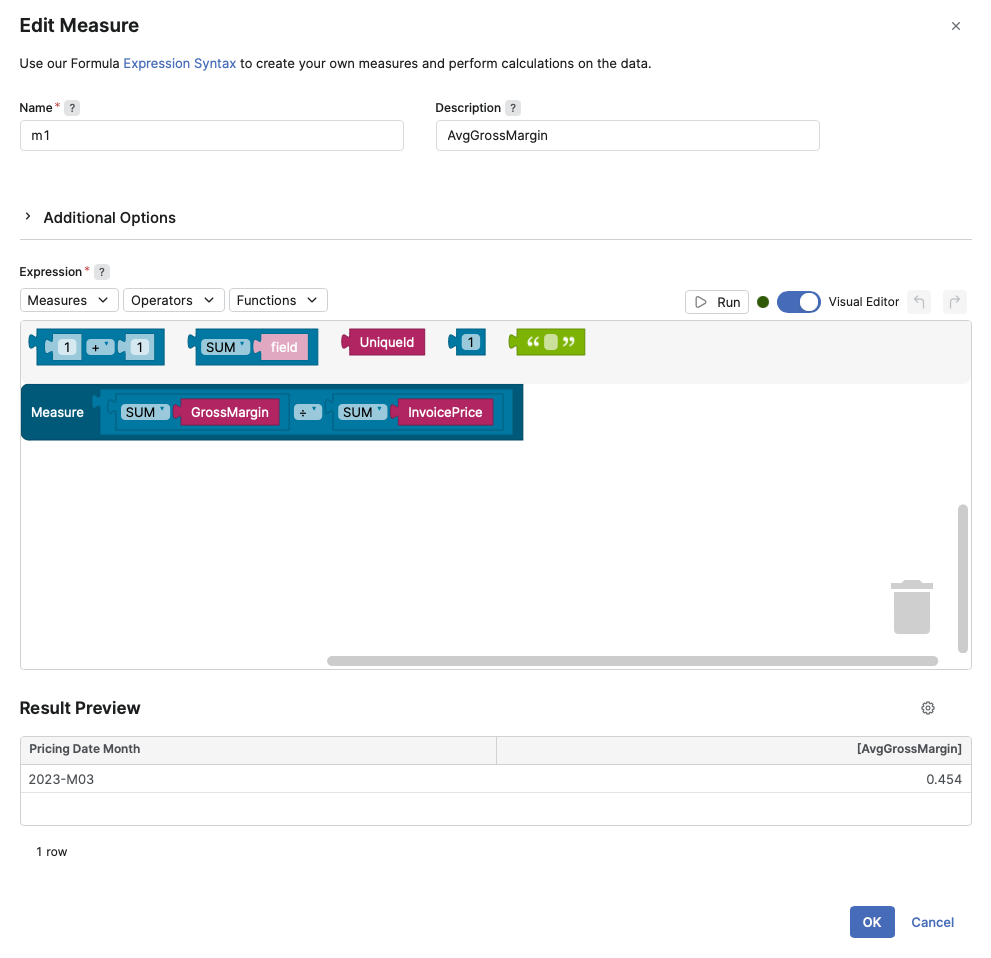
Average Gross Margin
How To
Result
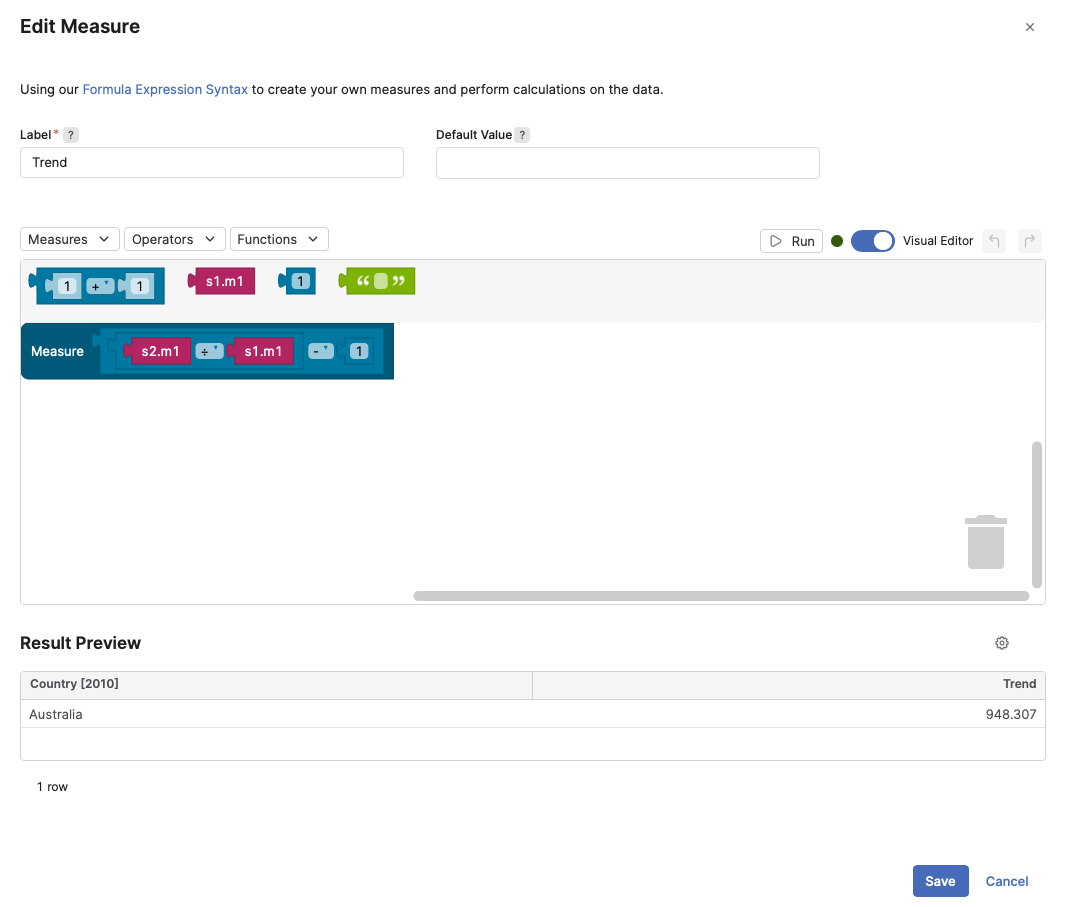
Gross Margin Trend
In this example we already have a Watcher defined. We have two Time Series grouped by Country. The Invoice Date Quarter is used as a Dimension Filter. We want to create a Join Series to track the Gross Margin Trend.
How To
Result
Since the release of Southside 15.1, we have introduced the Label field in Measures.
By default, the Label value is automatically generated based on the Measure and Aggregation Formula. For example, if your Measure is Quantity and your Aggregation Formula is ∑, then the Label value will be ∑Quantity. This concept is similar to the Name and Label fields used for Logics and Dashboards.
The default Label value can be customized according to user preferences. Labels are displayed in the Datatable Result and will also be utilized in Agents, such as Detection Rules.
See also: