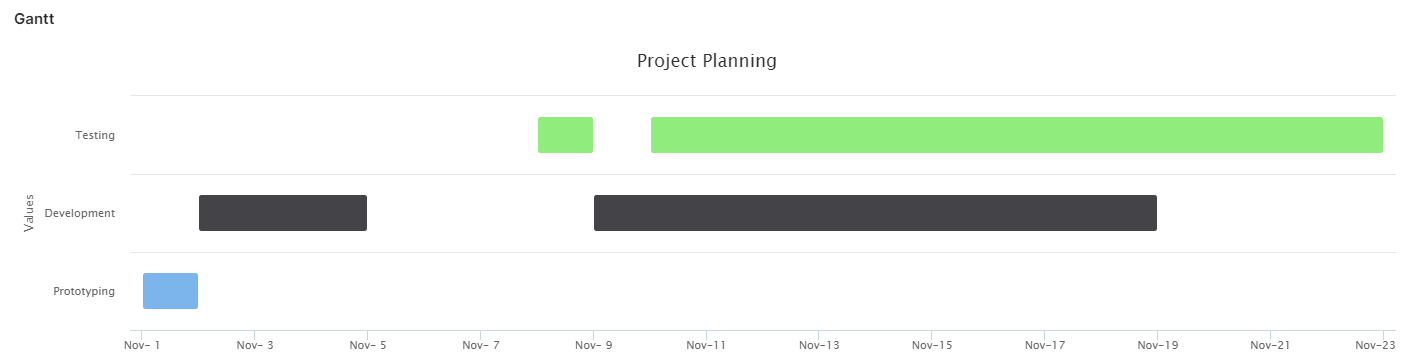
Gantt charts are commonly used in project management to visualize activities on a timeline.
To display a Gantt chart, use the Highcharts API to return a ResultHighchart from the element.
Gantt.groovy
ResultHighchart buildGanttChart(
        String title,
        List<String> yLabels,
        List<Map<String, Object>> data
) {
    def formats = libs.Library_Charts.Formats

    // Transform the dates into Unix Epoch, which is required by Highcharts. ❶
    def seriesData = data.collect {entry ->
        entry + [
                start: (entry.start as Date).getTime(),
                end: (entry.end as Date).getTime(),
        ]
    }

    def chartDefinition = [
            chart  : [
                    type: 'gantt', // ❷
            ],
            credits: [
                    enabled: false, // Hide the Highcharts link
            ],
            legend : [
                    enabled: false, // Let the legend be hidden.
            ],
            title  : [
                    text: title,
            ],
            yAxis  : [
                    categories: yLabels,
            ],
            xAxis  : [
                    type  : 'datetime',
                    labels: [
                            format: "{value:$formats.MONTH_FORMAT}", // ❸
                    ],
            ],
            series : [[
                              data      : seriesData,
                              dataLabels: [[
                                                   enabled: true,
                                                   useHTML: true,
                                                   align  : 'left'
                                           ], [
                                                   enabled: true,
                                                   useHTML: true,
                                                   align  : 'right'
                                           ]]
                      ]]
    ]

    def chart = api.buildHighchart(chartDefinition)
    chart.addModule('gantt') // ❹

    return chart
}
❶ Times needs to be specified in Unix Epoch time, i.e. the number of milliseconds since 1st January, 1970.
❷ Specifies the type of the chart.
❸ Format the X axis, so that you do not just see a number.
❹ The Gantt chart module must be loaded explicitly, as it is not enabled by default.
GanttChart.groovy
def gantt = libs.Library_Charts.Gantt

def data = [
        [
                start   : '2022-11-1',
                end     : '2022-11-2',
                y       : 0,
                assignee: 'Johannes'
        ], [
                start     : '2022-11-2',
                end       : '2022-11-5',
                y         : 1,
                assignee  : 'Gustaf',
        ], [
                start   : '2022-11-8',
                end     : '2022-11-9',
                y       : 2,
                assignee: 'Karl-Oskar'
        ], [
                start   : '2022-11-9',
                end     : '2022-11-19',
                y       : 1,
                assignee: 'Johannes'
        ], [
                start     : '2022-11-10',
                end       : '2022-11-23',
                y         : 2,
                assignee  : 'Karl-Oskar',
        ]
].collect { dataPoint ->
    dataPoint + [
            start: api.parseDate('yyyy-MM-dd', dataPoint.start as String),
            end:   api.parseDate('yyyy-MM-dd', dataPoint.end as String),
    ]
}

def yLabels = ['Prototyping', 'Development', 'Testing']

gantt.buildGanttChart('Project Planning', yLabels, data)
With Legend
You might have data in the series that you want to show when the end user displays the tooltip by hovering a data point. In this case, add a tooltip property to the chart definition.
For example, you might want to show the exact start and end dates for the bars:
def formats = libs.Library_Charts.Formats

def chartDefinition = [
    ...
    tooltip: [
        outside    : true,
        pointFormat: "Start: {point.start:%d %b %Y}<br/>End: {point.end:%d %b %Y}",
    ],
    ...
]
You might want to show the values of additional properties that are passed to the series data:
Gantt.groovy
def chartDefinition = [
    ...
    tooltip: [
        outside    : true,
        pointFormat: getToolTipPointFormat(seriesData),
    ],
    ...
]

...

String getToolTipPointFormat(List<Map<String, Object>> data) {
    def formats = libs.Library_Charts.Formats
    def knownPropertyKeys = ['start', 'end', 'y']
    def allPropertyKeys = data.collect { dataPoint ->
        dataPoint.keySet().toList()
    }.flatten().unique()
    def otherPropertyKeys = allPropertyKeys - knownPropertyKeys
    return (
            [
                    "Start: {point.start:$formats.DAY_FORMAT}",
                    "End: {point.end:$formats.DAY_FORMAT}",
            ] + otherPropertyKeys.collect { propKey -> "$propKey: {point.$propKey}" }
    ).join('<br/>')
}