This article explains how to save network logs (HAR/XML file) in web development tools and console logs from the browser and how to capture and read the client side response trace with a HAR file analyzer. This is useful when troubleshooting web applications.
Steps to take differ according to the browser:
This article is based on this source: https://support.qlik.com/articles/000016292
Google Chrome
-
Open Developer tools (in Menu > More tools > Developer tools or use Ctrl+Shift+I or F12).
-
Select the Network tab.
-
Make sure that the Preserve log option is checked so that all traffic is captured.
-
Access or refresh the page for which traffic needs to be captured or where a problem should be reproduced.
-
Perform the steps which lead to the behavior/issue.
-
Click the download icon Export HAR or right-click the Network capture pane and choose Save as HAR with content and save the .har capture locally.
-
On the Console tab, right-click, select Save as and save the .log file.
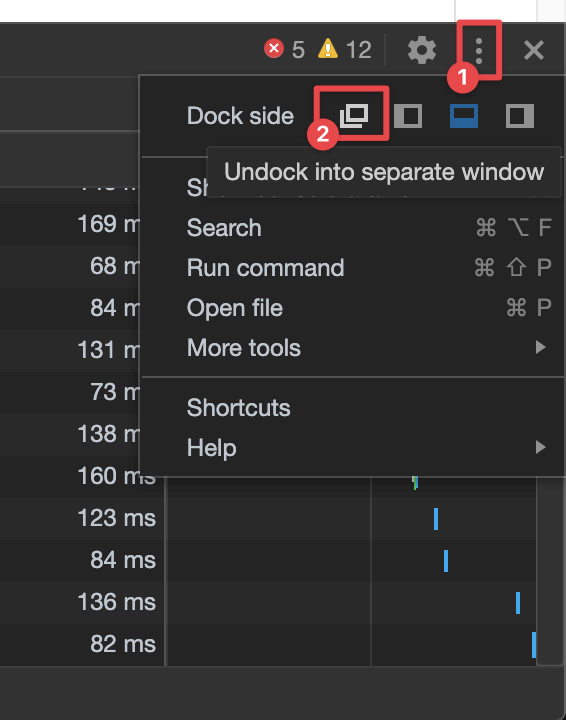
If you want use the whole browser area and keep logging in the background, just undock the Developer tools to a separate window using the More options menu.
Firefox (41+)
-
Go to Menu > Web Developer > Network.
-
Reload the page you want to get the log for.
-
Perform the steps which lead to the behavior/issue.
-
Right-click and select Save All as HAR.
-
Click the Console tab and select Select All.
-
Right-click, select Copy Message and save it as a .txt file.
Internet Explorer
-
Open Developer Tools (F12).
-
Go to the Network tab and click the green arrow to start the tool.
-
Refresh the page to capture the logs.
-
Perform the steps which lead to the behavior/issue.
-
Click the Export captured traffic icon and choose XML or HAR format.
-
On the Console tab, right-click and select Copy All and save it as a .txt file.
HAR Analysis
To analyze the HAR file, it is the easiest to use HAR Analyzer: https://toolbox.googleapps.com/apps/har_analyzer/