Overview
This article will help you configure a modal dashboard in a Pricefx module (e.g., Quotes, Rebates) so users can open On-Demand Dashboards by clicking a link on a line item. This feature is designed to improve the inline insight experience and help with overall performance.
This approach works like "lazy loading" – the dashboard is not calculated during the initial logic run. Instead, you reference the dashboard name and input parameters in the logic. The user interface will generate and display the dashboard only when the user clicks the link.
In Price Setting or CLIC modules, customers often want to show a chart or ResultMatrix on a line item. You can approach this in two ways:
-
Calculate the inline analytics during the main logic execution (the default way)
-
Calculate when the user clicks a link to view the dashboard (improved performance, especially for clients with complex logics – On-Demand Dashboards)
Target Audience
Intended for Configuration Engineers, Solution Architects, and Administrators.
Why Use On-Demand Dashboards?
-
Improved performance (by decoupling optional dashboard logic from the main calculation)
-
Display more focused, contextual insights tailored to the specific line item
-
Speed-up loading of dashboards. The data is fetched only when the user opens the modal.
Prerequisites
-
Version 15.0 or later
-
This feature works for the following modules:
-
Quotes
-
Rebates
-
Agreements & Promotions
-
Sales Compensation
-
Live Price Grids
-
Price Lists
-
Calculation Grids
-
-
A dashboard already exists in your environment
Limitations
|
Limitation |
Explanation |
|---|---|
|
Do not use for attributes required for calculating entire object |
The dashboard result is not available until the user clicks the context link to open it. If the header logic depends on this result, the calculation will fail due to missing data. |
|
Data is always current |
Ideal for real-time insights, but not recommended for historical or audit scenarios (e.g., reviewing already submitted quotes), as the dashboard always reflects current data. This means the displayed values may differ from those at the time the object was originally submitted. |
|
Not suitable for objects with few line items |
If the dashboard calculation is simple, embedding may not save time. |
How To Add Modal Dashboard to a Line Item
Step 1 – Create Logic
Example 1: Showing PriceHistory dashboard for a given SKU:
def pgi = api.currentItem() // Get the Current Line Item Context
def year = api.calendar().get(Calendar.YEAR)
return api.dashboard("PriceHistory")
        .setParam("Year", year)
        .setParam("sku", pgi.sku)
        .showEmbedded() // open as modal, embedded
You can get such a snippet if you click Add element from template > Dashboard in logic editor in Studio.
Example 2: Showing Revenue Margin from Sales Insights for a given sku:
def pgi = api.currentItem()

return api.dashboard("Revenue_Margin")
        .setParams([
                "Product(s)"            : [
                        "productFieldName" : "sku",
                        "productFieldValue": pgi.sku,
                        "productFieldLabel": "Product",
                ],
                "Customer(s)"           : null,
                "Date From"             : "2025-01-01",
                "Date To"               : "2025-12-31",
                "Time Period"           : "Month",
                "Product Aggregation"   : "ProductId",
                "Customer Aggregation"  : "CustomerId",
                "Band By For Product"   : "ProductId",
                "Band By For Customer"  : "CustomerId",
                "Column chart axis type": "linear",
                "Currency"              : "EUR",
                "General Filter"        : [],
        ])
        .showEmbedded() // open as modal, embedded
Example 3:
You can pass values from the current line item to the dashboard, allowing the dashboard to display context-specific insights for that item. This is especially useful when working with CLIC modules, such as Quotes, where each line item may represent a different product or configuration.
// Get the currently processed line item
def item = api.currentItem()

// Return the dashboard with dynamic parameters
return api.dashboard("ModalDashboard")
    .setParam("Type1", "Q")                          // Set a static parameter (e.g. module type)
    .setParam("TypeId", item.clicId.toString())      // Pass the line item's CLIC ID
    .setParam("SKU", item.sku.toString())            // Pass the line item's SKU
    .showEmbedded()                                  // Show the dashboard embedded
Step 2 – Assign the Logic and Open the Modal
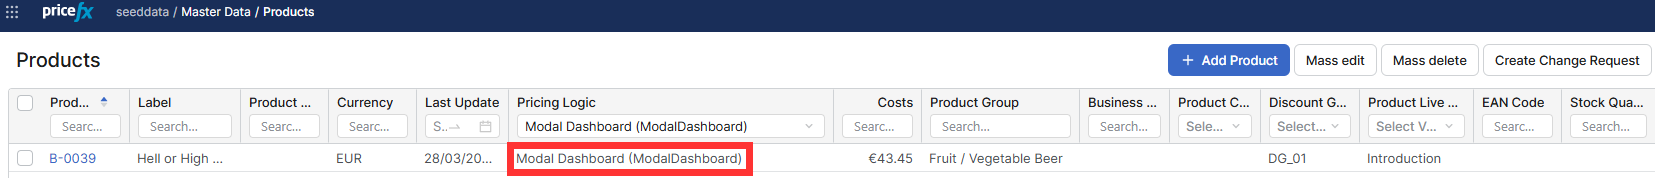
Navigate to Master Data > Products and assign your logic to a desired line item.
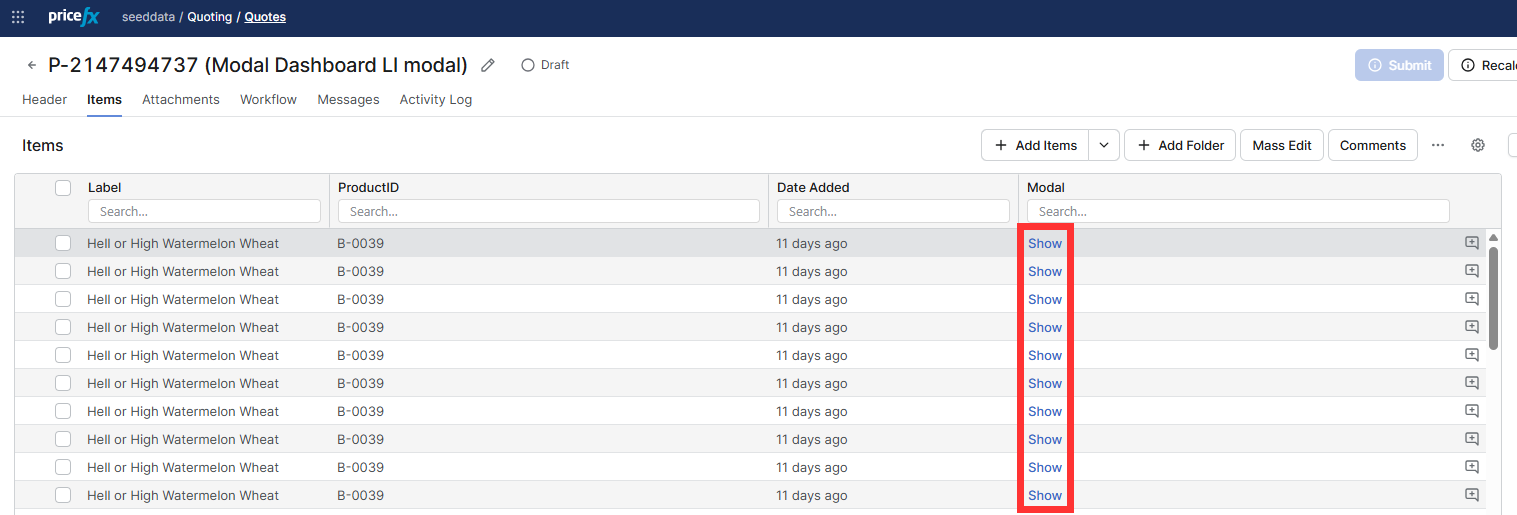
Open the modal based on your logic by clicking “Show“.
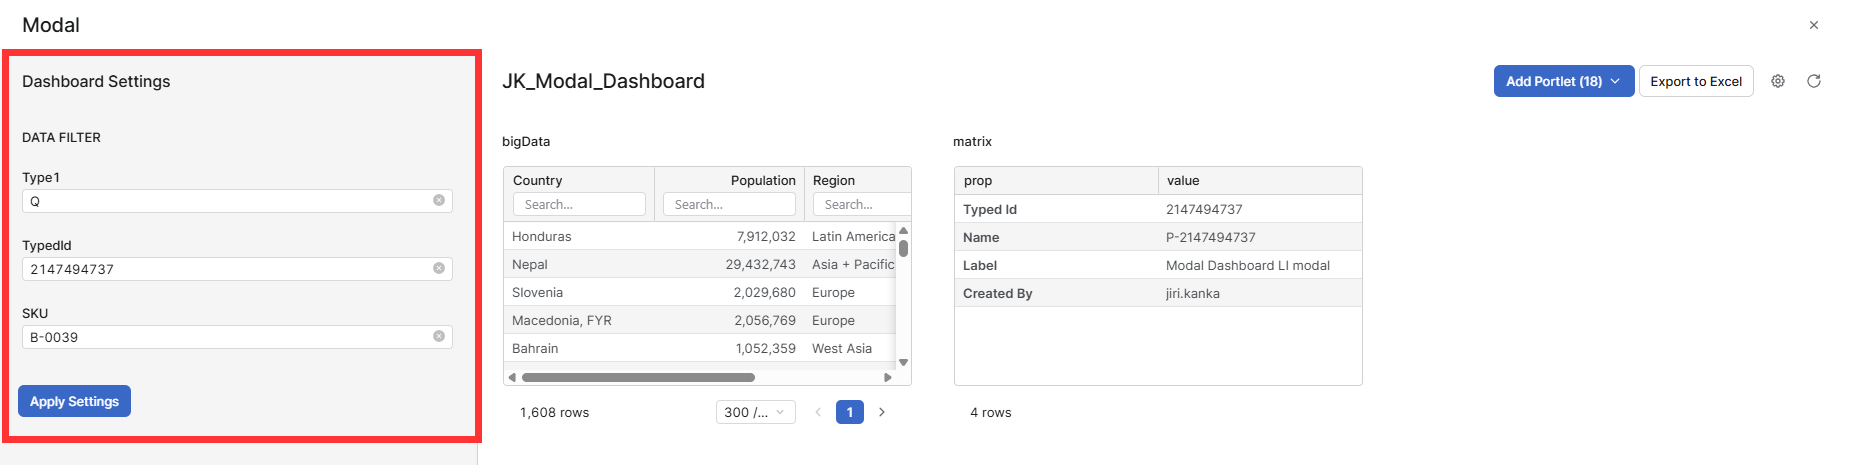
Step 3 – Result
The On-Demand Dashboard opens with the settings and parameters defined in your logic, dynamically adjusted to the selected line item (e.g., SKU, Quote ID).
See Also
.showEmbedded() (Groovy API documentation)