The Quoting dashboard provides an overview of the quote life cycle based on the workflow status (Approved, No Approval Required, Denied).
User Inputs

For this dashboard you can set the following inputs:
-
Customer(s) – Allows you to choose one or more customers for the analysis
-
Product(s) – Allows you to choose one or more products for the analysis
-
Date From/To – Filters data for the analysis according to the given time range. The Submitted date/time is used here, except for No Approval Required which uses the creation date.
-
Period – Allows you to define the data aggregation. Available values are: Month (default), Quarter.
Analysis
The dashboard provides the following portlets:
Portlet 1: Quoted Summary Per Month/Quarter
Shows the totals for invoice price, margin and discount for Approved and No Approval Required quotes for the defined period.
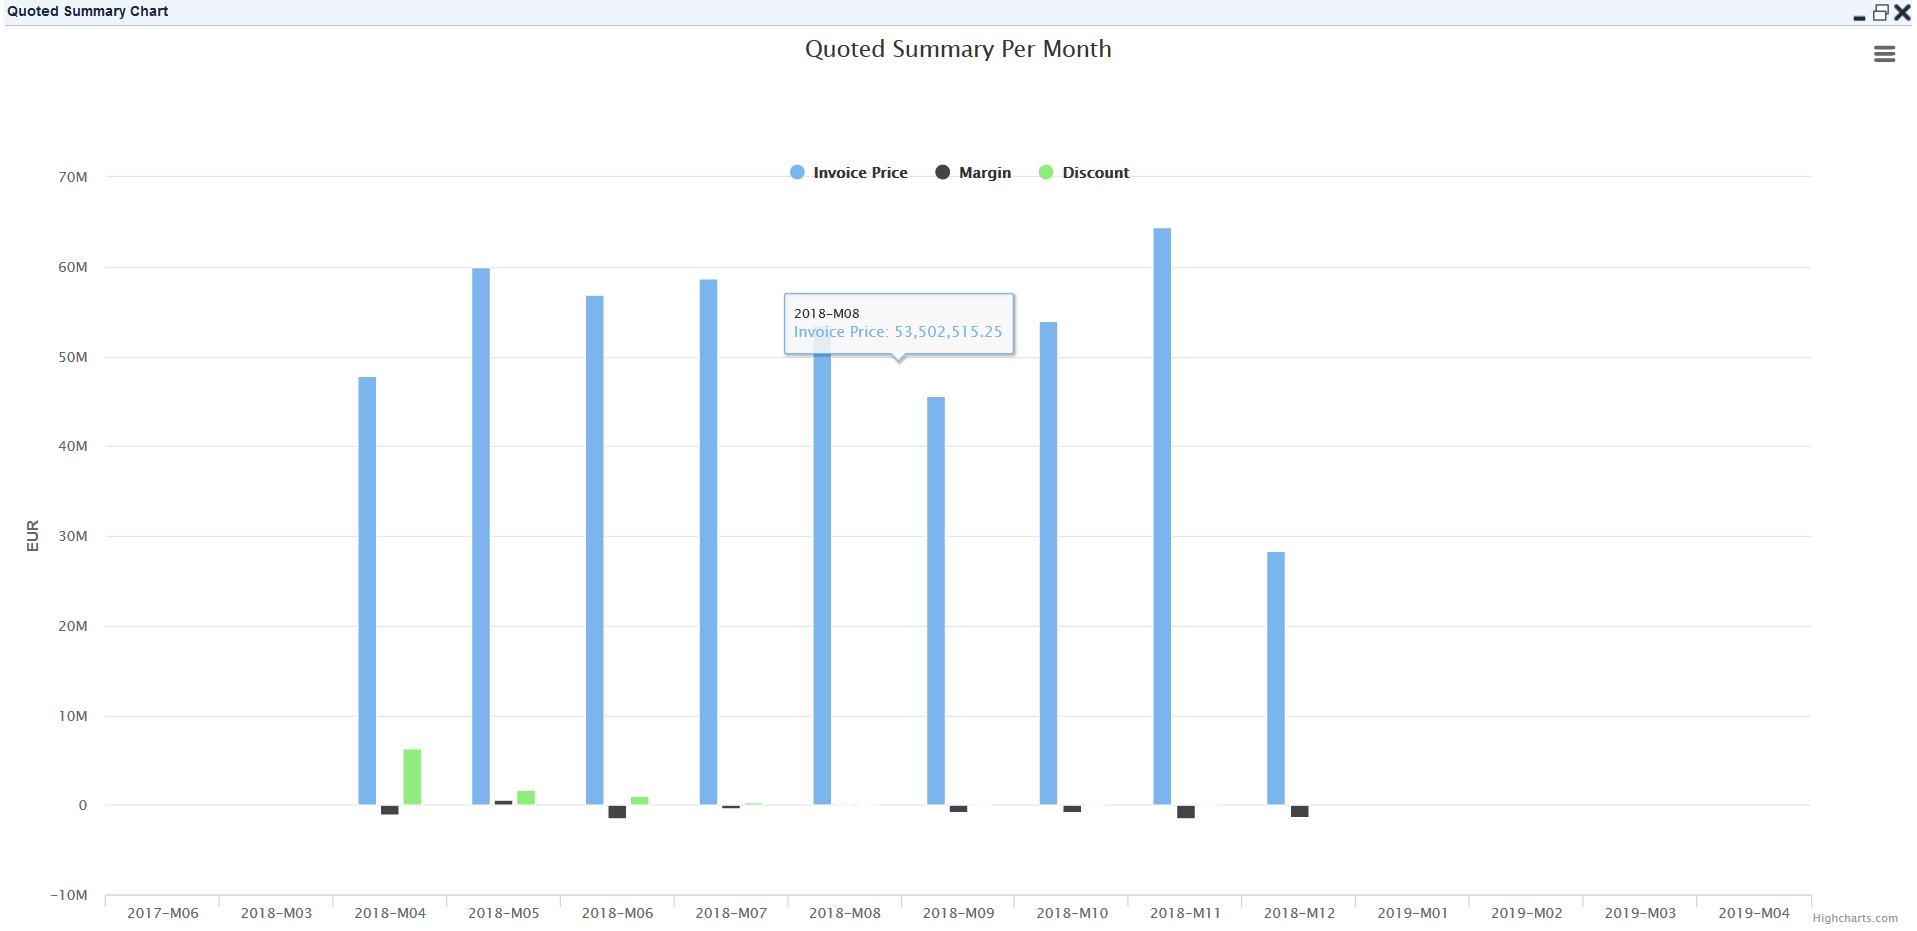
Invoice Price = ∑ (Invoice Price.Quote Line Id * Quantity)
Margin = ∑ (Invoice Price.QuoteLineId * Quantity) - ∑ (Cost.QuoteLineId * Quantity)
If Cost of Quote Line Id is null, it is skipped and not calculated.
Discount
If List Price > Invoice Price, ∑ (List Price.QuoteLineId * Quantity) - ∑ (Invoice Price.QuoteLineId * Quantity), else return 0
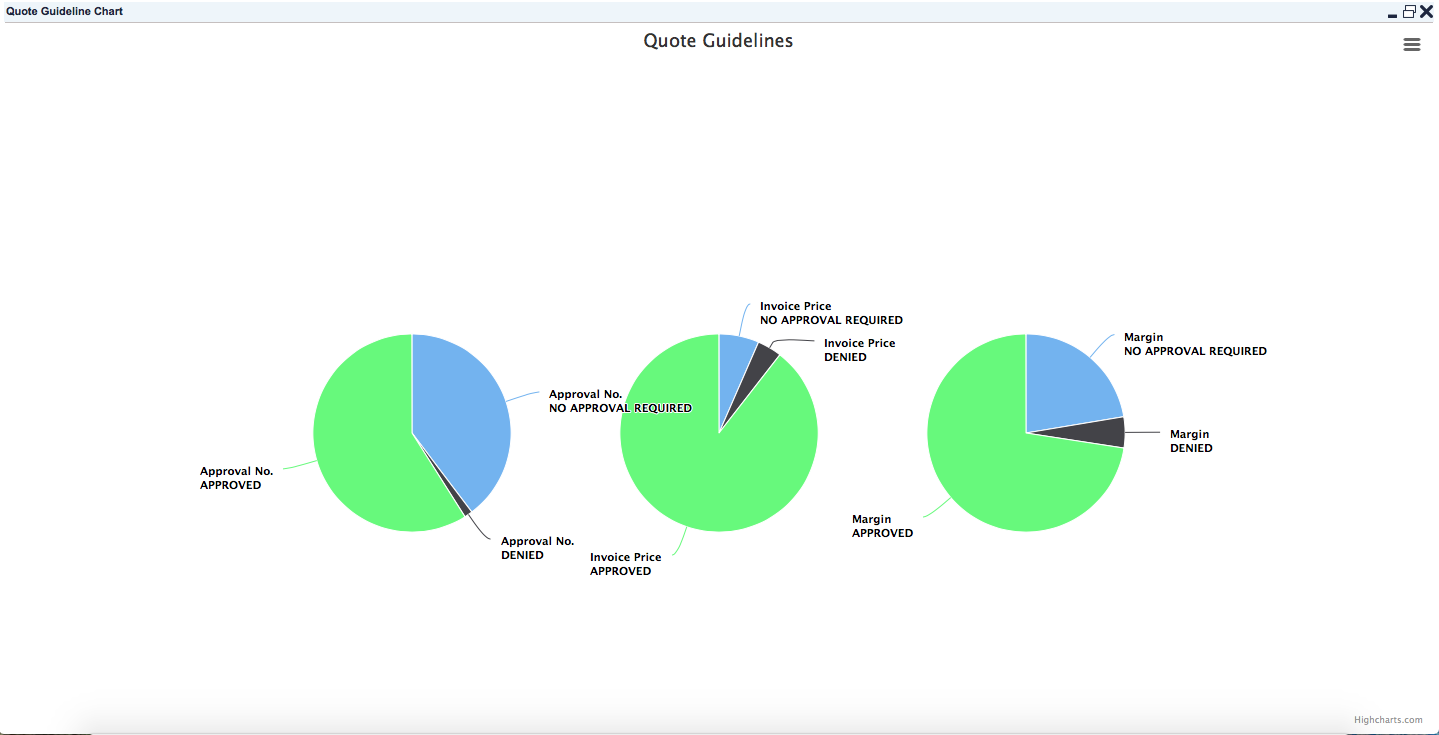
Portlet 2: Quote Guidelines
Provides three pie charts to show the numbers for Approval, Invoice Price, Margin based on the workflow status (Approved, No Approval Required, Denied).
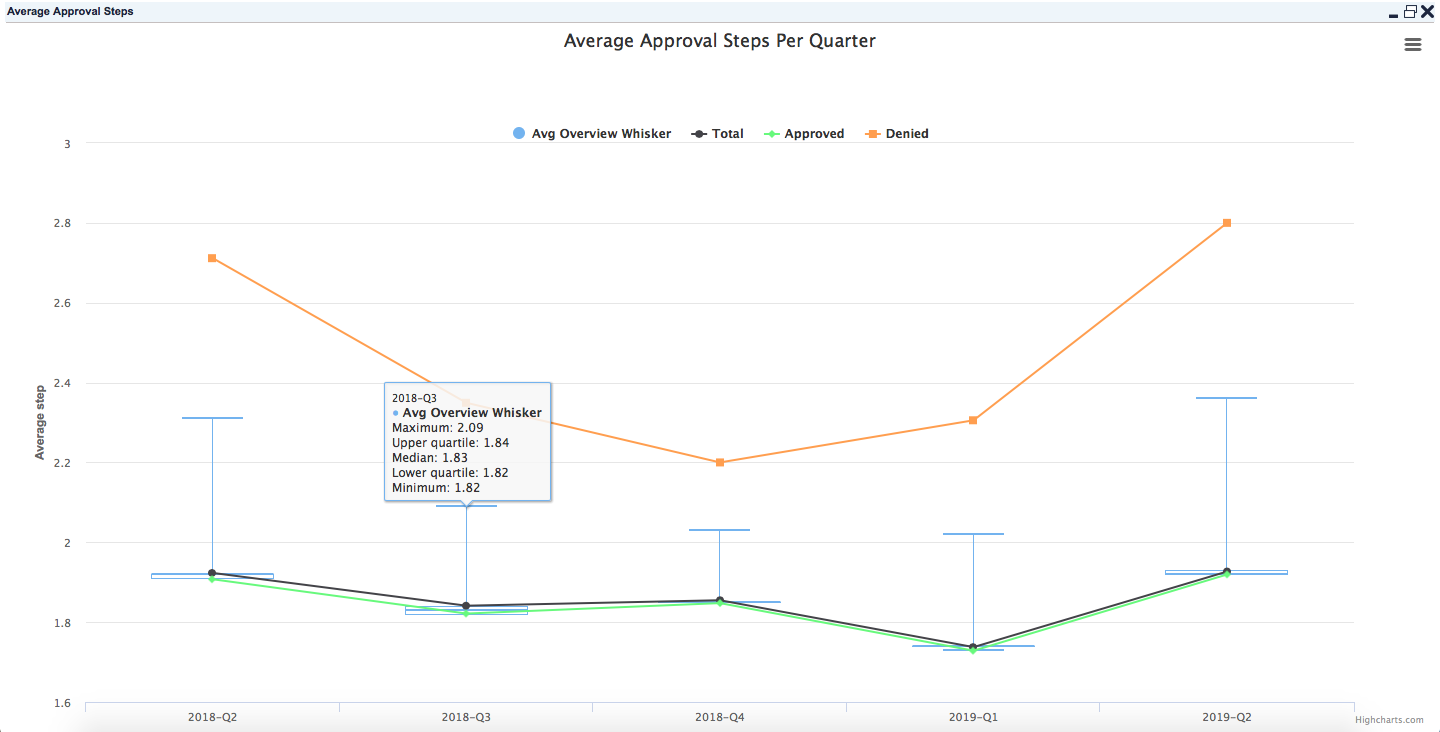
Portlet 3: Average Approval Steps Per Month/Quarter
Shows the average number of approval steps per period for approved and denied quotes.
-
Whiskers added for 5% and 95%
-
Average number of approval steps – Total
-
Average number of approval steps for approved quotes (excluding No Approval Required)
-
Average number of approval steps for denied quotes
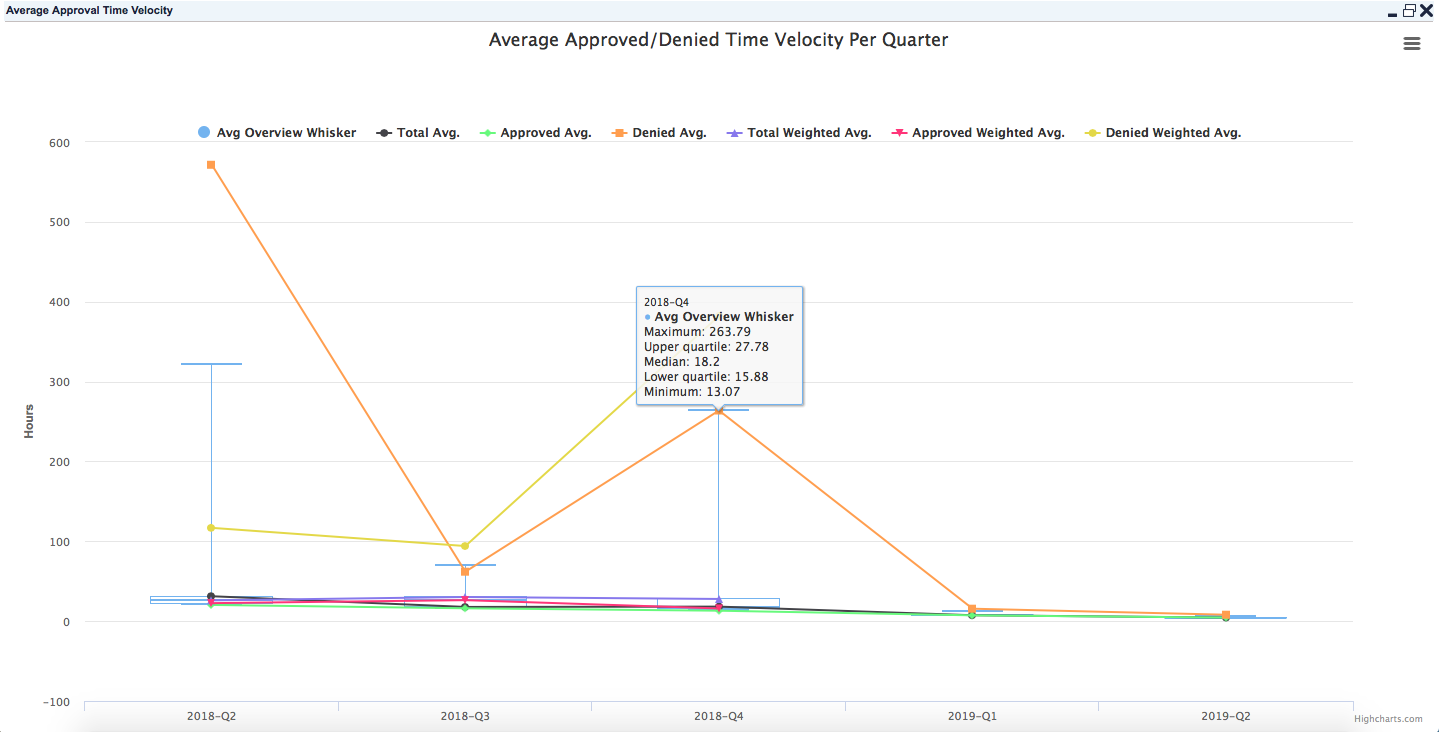
Portlet 4: Average Approved/ Denied Time Velocity Per Month/Quarter
Shows the average time between quote creation and quote approval/denial (quoting velocity) expressed in hours per period.
-
Whiskers added for 5% and 95%
-
Average quoting velocity for all quotes
-
Average quoting velocity for approved quotes (excluding No Approval Required)
-
Average quoting velocity for denied quotes
-
Weighted average (by revenue) quoting velocity for all quotes
-
Weighted average (by revenue) quoting velocity for approved quotes
-
Weighted average (by revenue) quoting velocity denied quotes
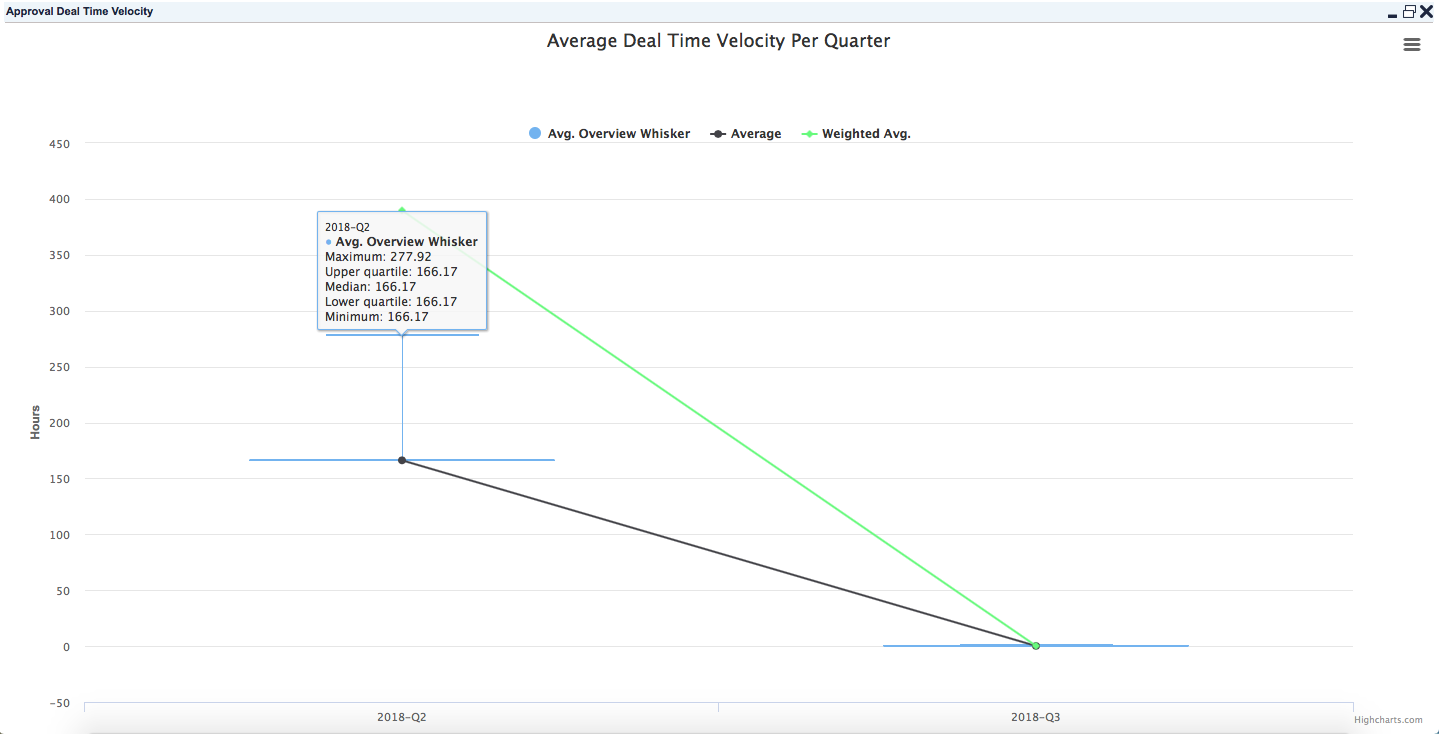
Portlet 5: Average Deal Time Velocity Per Month/Quarter
Shows the average time between quote approval (Approved and No Approval Required) and conversion to deal (deal velocity) expressed in hours per period.
-
Whiskers added for 5% and 95% and weighted average (by revenue) deal velocity.
-
If the workflow status is Approved, Convert to Deal Date Time - Approved Date Time
else -
Convert to Deal Date Time - Creation Date Time (now we do not have data for Submitted Date Time)
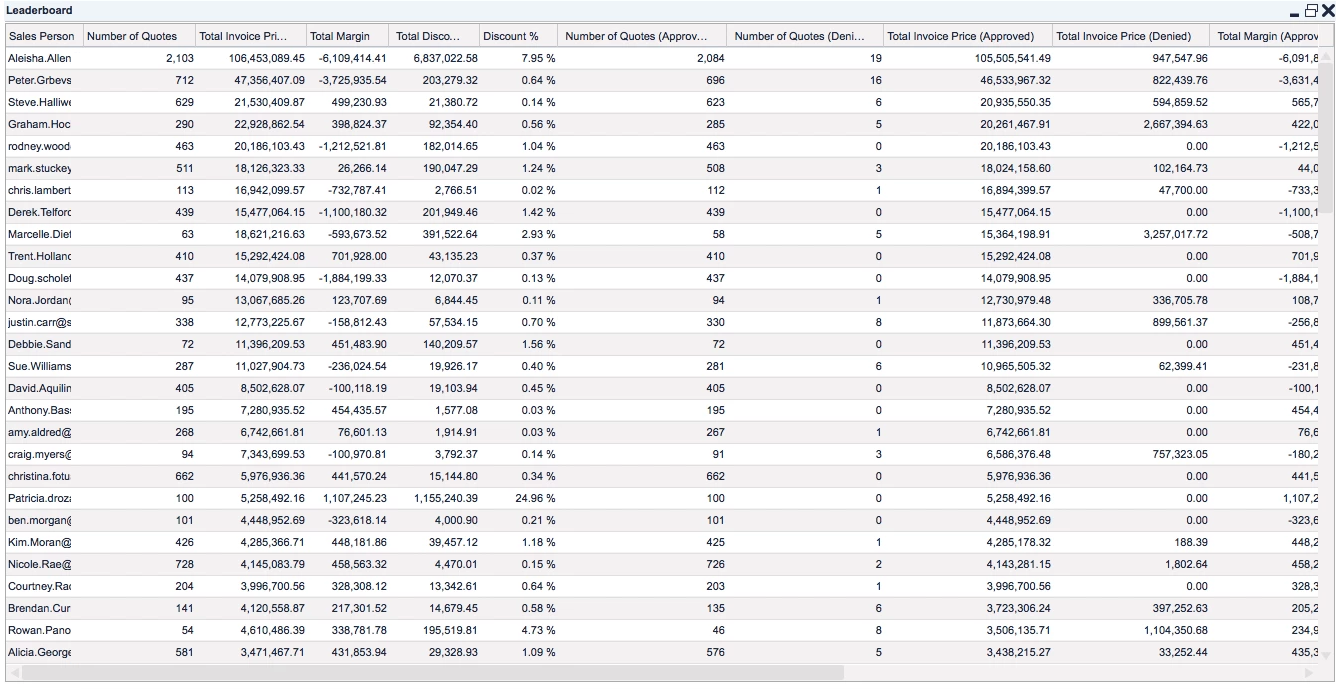
Portlet 6: Leaderboard
Shows a performance table of sales persons based on the workflow status of the quote (Approved, No Approval Required, Denied) with basic KPIs and sorted by Total Invoice Price (Approved):
-
Sales Person
-
Number of Quotes
-
Total Invoice Price
-
Total Margin
-
Total Discount
-
Discount %
-
Number of Quotes (Approved)
-
Total Invoice Price (Approved)
-
Total Margin (Approved)
-
Total Discount (Approved)
-
Discount % (Approved)
-
Number of Quotes (Denied)
-
Total Invoice Price (Denied)
-
Total Margin (Denied)
-
Total Discount (Denied)
-
Discount % (Denied)
Notes:
-
Approved = Approved + No Approval Required
-
Discount % = Total Discount / List Price