Customer Insights Package works based on configuration data which users can adjust to match their business case. These configuration data are stored in Company Parameter tables. In addition, the package uses Company Parameters tables to define currency symbols and Quote Types.
PFXTemplate_CustomerInsights_Configuration
In the 1.10.0 release, the default values for the PFXTemplate_CustomerInsights_Configuration Company Parameter have been updated to better align with the business. This change enables you to work with dashboards without needing further adjustments.
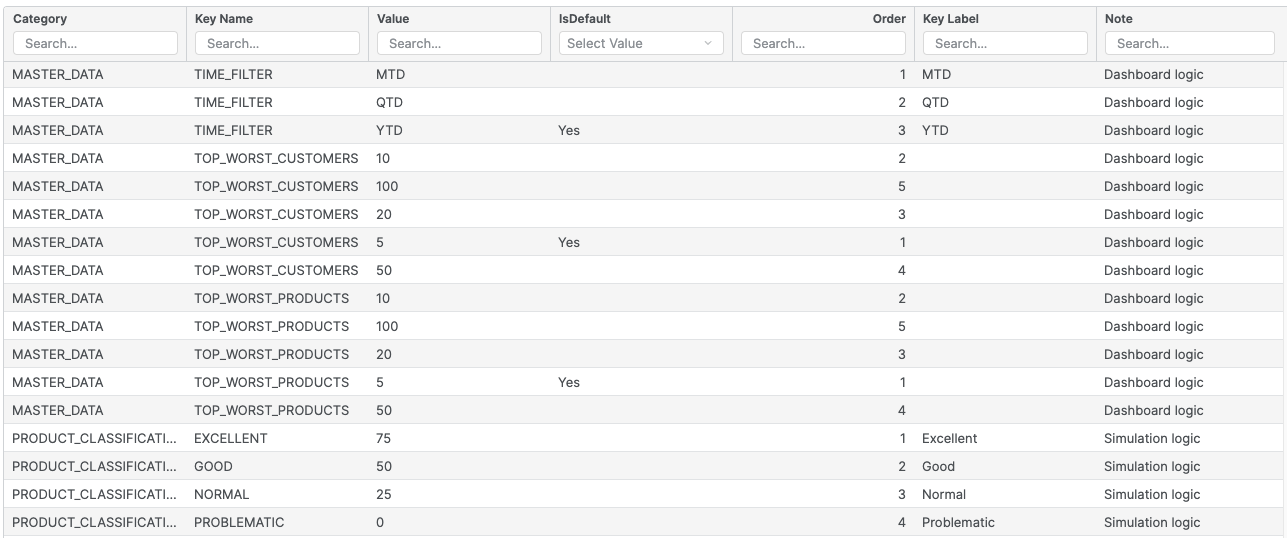
Most parameters used in Customer Insights are saved in this table, including these main columns:
|
Column |
Description |
|---|---|
|
Category |
Category of the configuration. |
|
Key Name |
Key name of the configuration. |
|
Value |
Defines the value corresponding to the key-set. |
|
Is Default |
If set to Yes, the dashboard will use the value of this item as a default value. |
|
Order |
Sets the order of items in the same Category. |
|
Key Label |
Defines a label shown on the chart/input. |
|
Note |
Specifies which logic type is used. |
Dashboard Configuration
Time Filter Selector Input
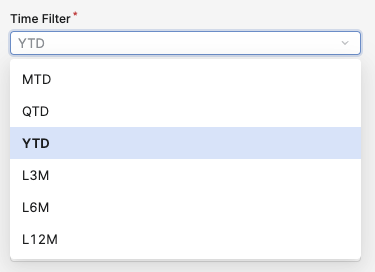
Data for this selector are defined in Category = MASTER_DATA and Key Name = TIME_FILTER.
|
Category |
Key Name |
Value |
IsDefault |
Order |
Key Label |
|---|---|---|---|---|---|
|
MASTER_DATA |
TIME_FILTER |
L12M |
|
6 |
L12M |
|
MASTER_DATA |
TIME_FILTER |
L3M |
|
4 |
L3M |
|
MASTER_DATA |
TIME_FILTER |
L6M |
|
5 |
L6M |
|
MASTER_DATA |
TIME_FILTER |
MTD |
|
1 |
MTD |
|
MASTER_DATA |
TIME_FILTER |
QTD |
|
2 |
QTD |
|
MASTER_DATA |
TIME_FILTER |
YTD |
Yes |
3 |
YTD |
If you want to change the text shown in the Time Filter selector (e.g. MTD → Month To Date), you need to update the value of the column Key Label from MTD to Month To Date. If you clear the value of this column, the Time Filter selector will show the value of the Value column.
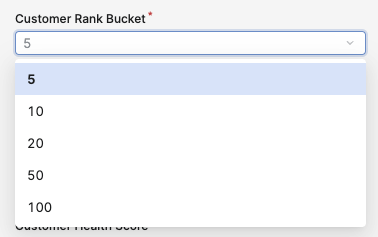
Top/Worst Customers Selector Input

Data for this selector are defined in Category = MASTER_DATA and Key Name = TOP_WORST_CUSTOMERS.
|
Category |
Key Name |
Value |
IsDefault |
Order |
|---|---|---|---|---|
|
MASTER_DATA |
TOP_WORST_CUSTOMERS |
5 |
Yes |
1 |
|
MASTER_DATA |
TOP_WORST_CUSTOMERS |
10 |
|
2 |
|
MASTER_DATA |
TOP_WORST_CUSTOMERS |
20 |
|
3 |
|
MASTER_DATA |
TOP_WORST_CUSTOMERS |
50 |
|
4 |
|
MASTER_DATA |
TOP_WORST_CUSTOMERS |
100 |
|
5 |
If you want to add more values to this list, you need add a new row with same category and key name.
Example
To add a value “200” to the list and put it at the end of the list, you need to add the following:
-
Category=MASTER_DATA -
Key Name=TOP_WORST_CUSTOMERS -
Value=200 -
Order=6
Top/Worst Products Selector Input
Data for this selector are defined in Category = MASTER_DATA and Key Name = TOP_WORST_PRODUCTS.
|
Category |
Key Name |
Value |
IsDefault |
Order |
|---|---|---|---|---|
|
MASTER_DATA |
TOP_WORST_PRODUCTS |
5 |
Yes |
1 |
|
MASTER_DATA |
TOP_WORST_PRODUCTS |
10 |
|
2 |
|
MASTER_DATA |
TOP_WORST_PRODUCTS |
20 |
|
3 |
|
MASTER_DATA |
TOP_WORST_PRODUCTS |
50 |
|
4 |
|
MASTER_DATA |
TOP_WORST_PRODUCTS |
100 |
|
5 |
KPI Selector Input
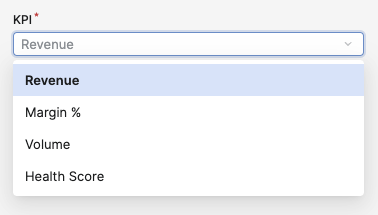
Data for this selector are defined in Category = MASTER_DATA and Key Name = KPI.
|
Category |
Key Name |
Value |
IsDefault |
Order |
Key Label |
|---|---|---|---|---|---|
|
MASTER_DATA |
KPI |
Revenue |
|
1 |
Revenue |
|
MASTER_DATA |
KPI |
Margin% |
|
2 |
Margin % |
|
MASTER_DATA |
KPI |
Volume |
|
3 |
Volume |
|
MASTER_DATA |
KPI |
Health Score |
Yes |
4 |
Health Score |
If you want to change the text shown in the KPI selector (e.g. “Margin %” → “Margin Percent”), you need to update the value of the column Key Label from Margin % to Margin Percent. If you clear the value of this column, the KPI selector will show the value of the Value column.
Display of Trend Columns in Table
In the tables of the dashboard, Trend columns are displayed with three formats based on the setting:
-
Green up arrow ▲
-
Orange horizontal arrow ▷
-
Red down arrow ▼
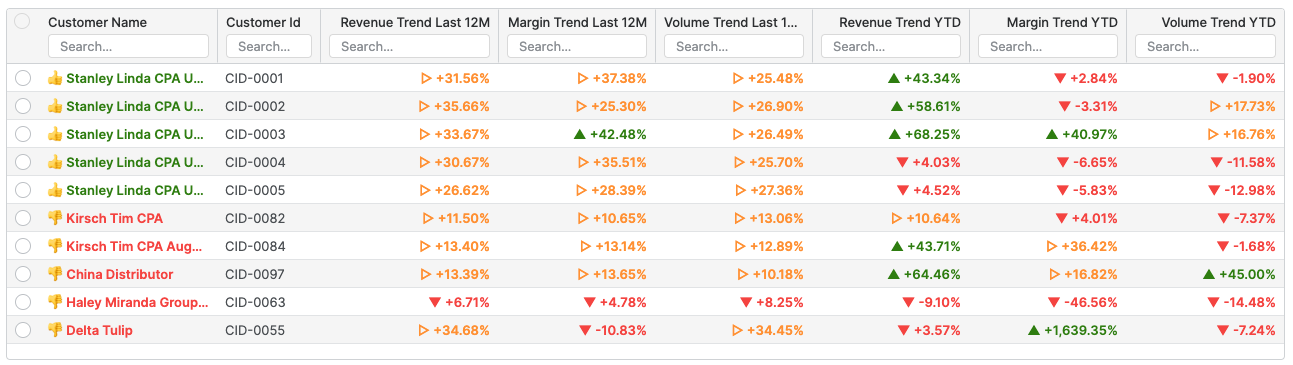
You can define threshold values to match your business case – just update the value of the key name TREND_UPPER and TREND_LOWER:
|
Trend |
Logic |
|---|---|
|
Green and up arrow ▲ |
Trend value >= |
|
Orange and horizontal arrow ▷ |
|
|
Red and down arrow ▼ |
Trend value <= |
|
Category |
Key Name |
Value |
IsDefault |
Order |
|---|---|---|---|---|
|
CONFIGURATION |
TREND_LOWER |
0.0 |
|
|
|
CONFIGURATION |
TREND_UPPER |
0.05 |
|
|
Display of Health Score Columns
This column has the same display format as the trends columns but the threshold is different.
The Health Score column is included in two tables:
-
Customer Health Summary Table (Customer Global View Dashboard)
-
Product Health Summary Table (Customer Product Portfolio View Dashboard)
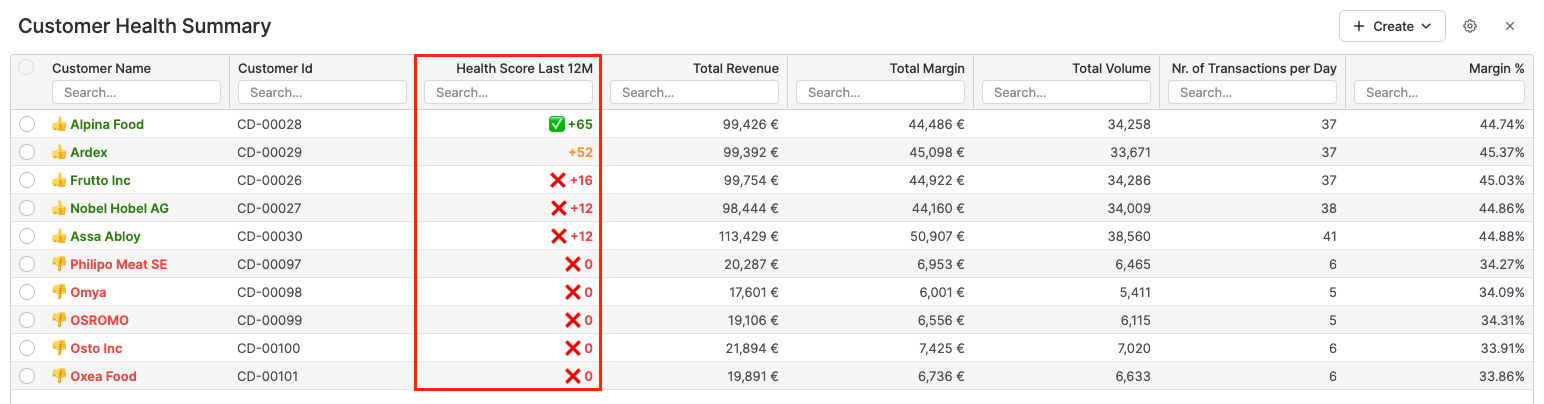
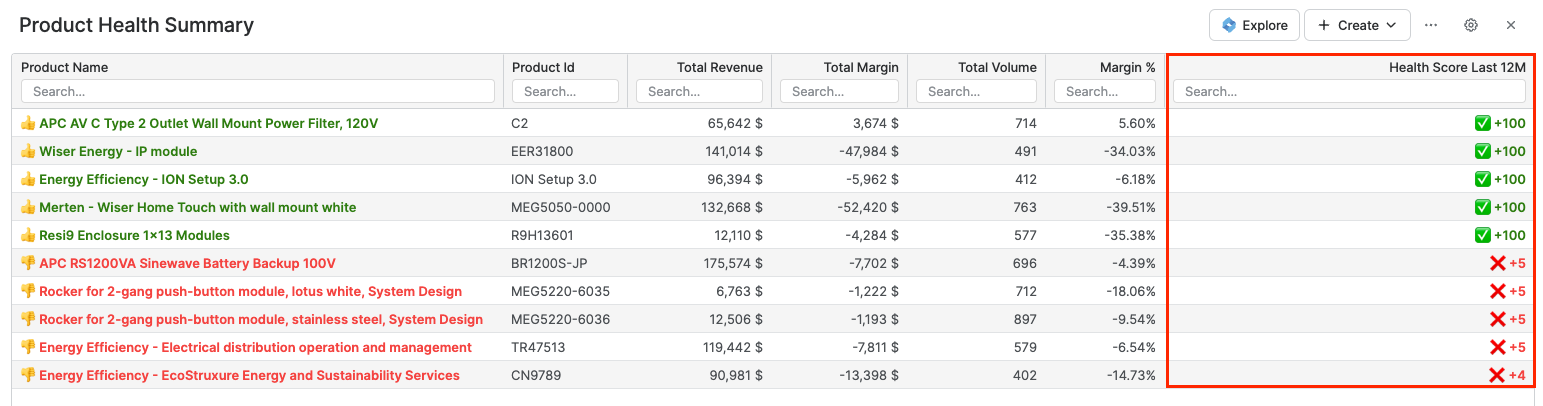
You can define it in Category = CONFIGURATION, the key names are CUSTOMER_HEALTH_SCORE_UPPER and CUSTOMER_HEALTH_SCORE_LOWER:
|
Customer Health |
Logic |
|---|---|
|
Green ✅ ( |
Health Score >= |
|
Orange |
|
|
Red ❌ ( |
Health Score <= |
|
Category |
Key Name |
Value |
IsDefault |
Order |
|---|---|---|---|---|
|
CONFIGURATION |
CUSTOMER_HEALTH_SCORE_LOWER |
40 |
|
|
|
CONFIGURATION |
CUSTOMER_HEALTH_SCORE_UPPER |
60 |
|
|
Revenue and Margin Contribution Chart (Customer Product Portfolio Dashboard)
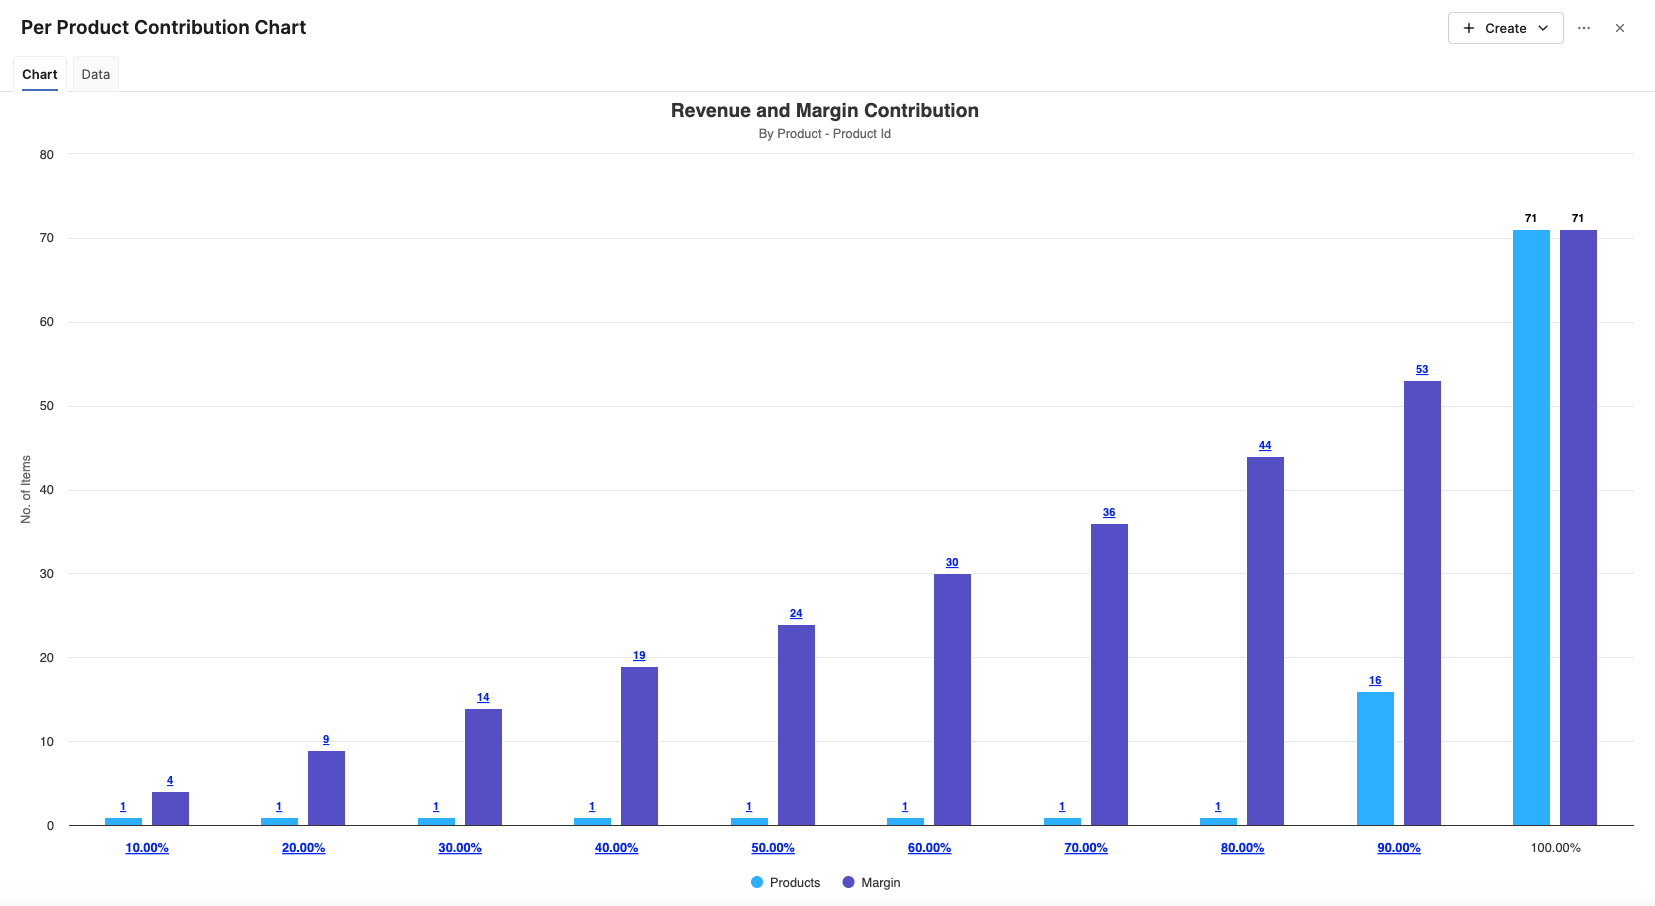
In this chart, you can re-define:
-
Number of buckets – via the
Key Name=NUMBER_OF_BUCKETS -
Percent of the start bucket / percent of the end bucket via the
Key Name=BUCKET_START_PERCENTandBUCKET_END_PERCENT
|
Category |
Key Name |
Value |
Note |
|---|---|---|---|
|
REVENUE_AND_MARGIN_CONTRIBUTION |
BUCKET_END_PERCENT |
100 |
Dashboard logic |
|
REVENUE_AND_MARGIN_CONTRIBUTION |
BUCKET_START_PERCENT |
0 |
Dashboard logic |
|
REVENUE_AND_MARGIN_CONTRIBUTION |
NUMBER_OF_BUCKETS |
10 |
Dashboard logic |
Number of Next months (Customer Detail View Dashboard)
In the Customer Detail View dashboard, we have two charts:
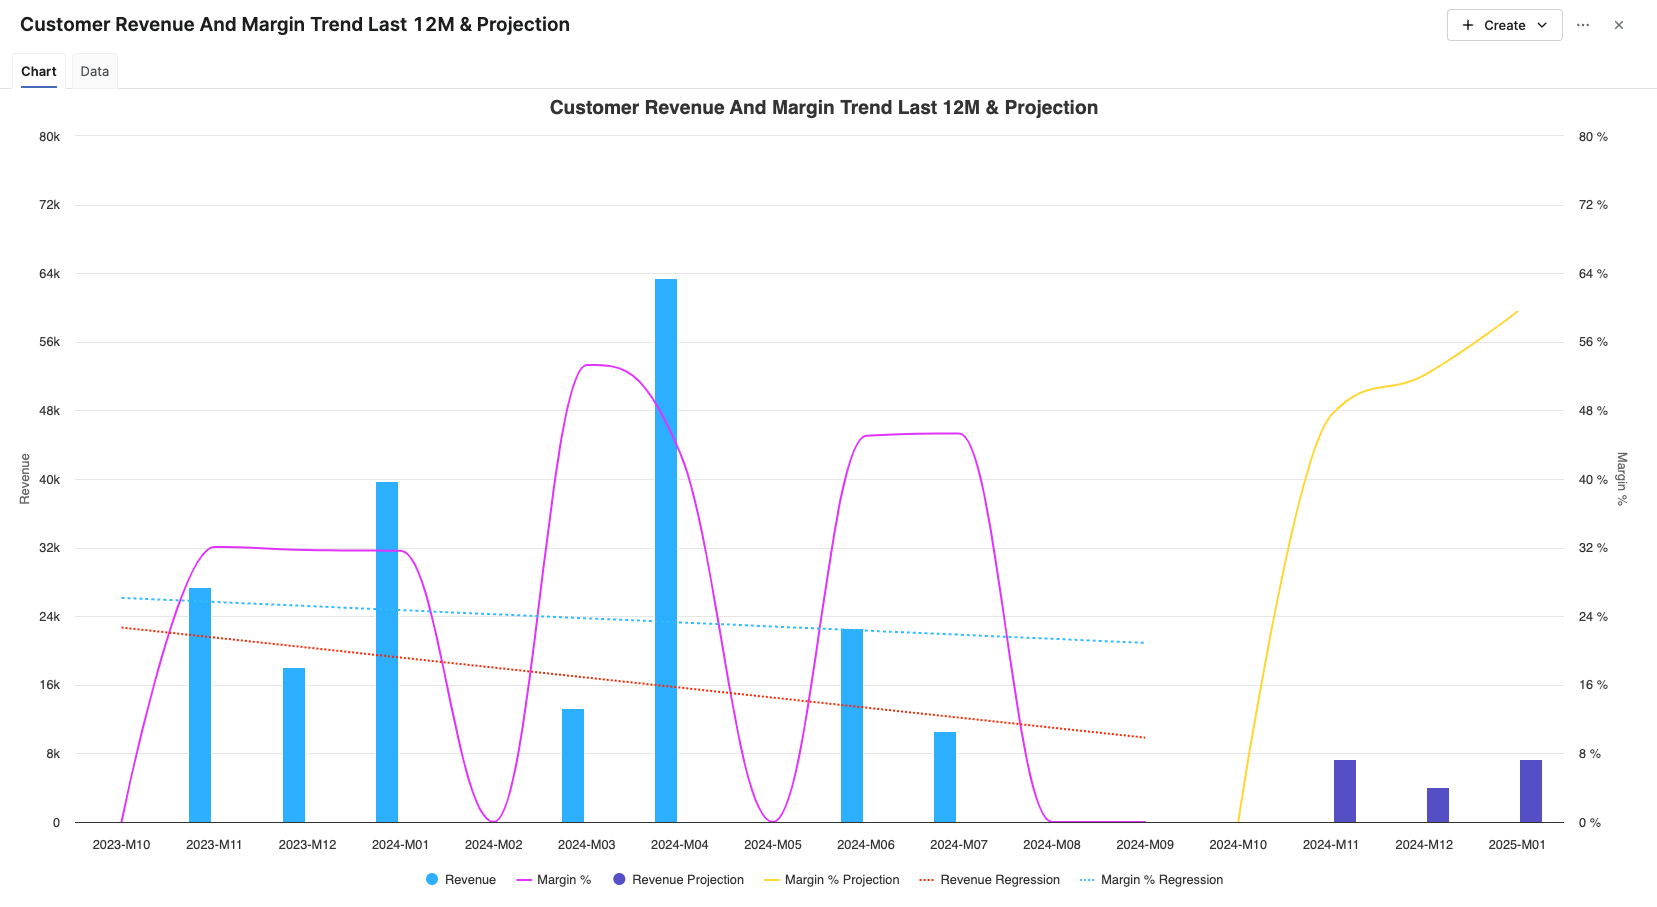
The default number of next months is three. You can update this value in Category = MASTER_DATA and Key Name = NEXT_MONTH_AMOUNT.
|
Category |
Key Name |
Value |
IsDefault |
Order |
Key Label |
Note |
|---|---|---|---|---|---|---|
|
MASTER_DATA |
NEXT_MONTH_AMOUNT |
3 |
|
|
|
Dashboard logic |
Customer Base, Product Base (Core Customers and Products) Selector Input
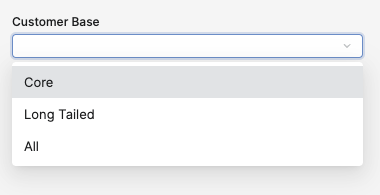
Data for this selector are defined in Category = Configuration and Key Name = CUSTOMER_CORE or PRODUCT_CORE.
The value specifies the cumulative revenue thresholds for the Core vs. Long Tailed definition.
Values range: 0..1 (e.g. 0.8 = 80%).
|
Category |
Key Name |
Value |
|---|---|---|
|
CONFIGURATION |
CUSTOMER_CORE |
0.8 |
|
CONFIGURATION |
PRODUCT_CORE |
0.8 |
Realization Rate for Opportunities
In certain cases, the opportunities in the Customer Insights may exceed realistic expectations. To address this, a Realization Rate has been introduced for each type of opportunity. The Realization Rate is defined in the Company Parameter PFXTemplate_CustomerInsights_Configuration.
-
Pricing Opportunity Realization Rate (
PRICING_OPPORTUNITY_REALIZATION_RATE) -
Cross Sell Realization Rate (
CROSS_SELL_REALIZATION_RATE)CrossSellRealizationRate*(TOTAL_SEG_DATA.revenue - SUM(SEG_DATA.revenunee)) -
Revenue Increase Realization Rate (
REVENUE_INCREASE_REALIZATION_RATE)
|
Category |
Key Name |
Value |
|---|---|---|
|
REALIZATION_RATE |
CROSS_SELL_REALIZATION_RATE |
0.5 |
|
REALIZATION_RATE |
PRICING_OPPORTUNITY_REALIZATION_RATE |
0.5 |
|
REALIZATION_RATE |
REVENUE_INCREASE_REALIZATION_RATE |
0.5 |
Pre-Processing Logic Configuration
Customer Health Score
For more details see Glossary (Customer Insights).
Health Score = Revenue Score * Revenue Weight + Margin Score * Margin Weight
Revenue Weight + Margin Weight = 1
Revenue Score / Margin Score is based on the defined table (the Trend value is the revenue/margin trend last 12M):
|
Trend |
Health Score |
|---|---|
|
>25% |
100 |
|
15% - 25% |
75 |
|
5% - 15% |
60 |
|
-5% - 5% |
50 |
|
-5% - -15% |
40 |
|
-15% - -25% |
25 |
|
< -25% |
0 |
You can change the threshold trends value in the CP as shown below:
|
Category |
Key Name |
Value |
IsDefault |
Order |
|---|---|---|---|---|
|
SCORE_CLASSIFICATION |
100 |
0.2 |
|
1 |
|
SCORE_CLASSIFICATION |
99 |
0.195 |
|
2 |
|
SCORE_CLASSIFICATION |
98 |
0.19 |
|
3 |
|
SCORE_CLASSIFICATION |
97 |
0.185 |
|
4 |
|
SCORE_CLASSIFICATION |
96 |
0.18 |
|
5 |
|
SCORE_CLASSIFICATION |
95 |
0.175 |
|
6 |
|
SCORE_CLASSIFICATION |
94 |
0.17 |
|
7 |
You can change the Revenue Weight and Margin Weight values in the Company Parameter.
-
If you set just the value of Revenue Weight, the system will calculate Margin Weight = (1 - Revenue Weight) automatically.
-
If you set just the value of Margin Weight, the system will calculate Revenue Weight = (1 - Margin Weight) automatically.
-
If you do not set either of these values, the default value is: Revenue Weight = Margin Weight = 0.5.
|
Category |
Key Name |
Value |
IsDefault |
Order |
|---|---|---|---|---|
|
CONFIGURATION |
REVENUE_WEIGHT |
0.5 |
|
|
|
CONFIGURATION |
MARGIN_WEIGHT |
0.5 |
|
|
Customer Revenue Classification
The simulation logic uses this setting to identify the customer classification based on the contribution and cumulative revenue contribution of each customer.
You can change the threshold value and label (show on the dashboard) in the PP as shown below:
|
Category |
Key Name |
Value |
IsDefault |
Order |
Key Label |
Note |
|---|---|---|---|---|---|---|
|
CUSTOMER_CLASSIFICATION_REVENUE |
A |
20 |
|
1 |
A |
Dataload logic |
|
CUSTOMER_CLASSIFICATION_REVENUE |
B |
40 |
|
2 |
B |
Dataload logic |
|
CUSTOMER_CLASSIFICATION_REVENUE |
C |
60 |
|
3 |
C |
Dataload logic |
|
CUSTOMER_CLASSIFICATION_REVENUE |
D |
80 |
|
4 |
D |
Dataload logic |
|
CUSTOMER_CLASSIFICATION_REVENUE |
E |
100 |
|
5 |
E |
Dataload logic |
Customer Health Score Classification
This classification is based on the customer health score – the simulation logic assigns customers to different classes based on Health Score.
You can change the threshold value and label (shown on the dashboard) in the PP as shown below:
|
Category |
Key Name |
Value |
IsDefault |
Order |
Key Label |
Note |
|---|---|---|---|---|---|---|
|
CUSTOMER_CLASSIFICATION_HEALTH_SCORE |
EXCELLENT |
75 |
|
1 |
Excellent |
Dataload logic |
|
CUSTOMER_CLASSIFICATION_HEALTH_SCORE |
GOOD |
60 |
|
2 |
Good |
Dataload logic |
|
CUSTOMER_CLASSIFICATION_HEALTH_SCORE |
MEDIOCRE |
30 |
|
4 |
Mediocre |
Dataload logic |
|
CUSTOMER_CLASSIFICATION_HEALTH_SCORE |
NORMAL |
40 |
|
3 |
Normal |
Dataload logic |
|
CUSTOMER_CLASSIFICATION_HEALTH_SCORE |
PROBLEMATIC |
10 |
|
5 |
Problematic |
Dataload logic |
Product Quantity Classification
The simulation logic uses this setting to identify the product classification based on the contribution and cumulative volume contribution of each product.
You define the threshold value in this CP, for example:
-
Very High Volume <= 10%
-
High Volume <= 20%
-
Normal Volume <= 75%
-
Low Volume = rest
You must update the threshold value and label (shown on the dashboard) in the CP as shown below:
|
Category |
Key Name |
Value |
IsDefault |
Order |
Key Label |
Note |
|---|---|---|---|---|---|---|
|
PRODUCT_CLASSIFICATION_QUANTITY |
VERY_HIGH |
10 |
|
1 |
Very High |
Dataload logic |
|
PRODUCT_CLASSIFICATION_QUANTITY |
HIGH |
20 |
|
2 |
High |
Dataload logic |
|
PRODUCT_CLASSIFICATION_QUANTITY |
NORMAL |
75 |
|
3 |
Normal |
Dataload logic |
|
PRODUCT_CLASSIFICATION_QUANTITY |
LOW |
100 |
|
4 |
Low |
Dataload logic |
Commodity vs. Specialty Product Classification
The simulation logic uses this setting to identify if a product is Commodity or Specialty Product.
It is defined based on an average margin achieved by the product.
-
Speciality >= 30%
-
Commodity = rest
You can update the threshold value and label (shown on the dashboard) in the CP as shown below:
|
Category |
Key Name |
Value |
IsDefault |
Order |
Key Label |
Note |
|---|---|---|---|---|---|---|
|
PRODUCT_CLASSIFICATION_MARGIN_PERCENT |
SPECIALITY |
30 |
|
1 |
Speciality |
Dataload logic |
|
PRODUCT_CLASSIFICATION_MARGIN_PERCENT |
COMMODITY |
0 |
|
2 |
Commodity |
Dataload logic |
Inactive Customer Classification
There is an option to define the name and value of the key which identifies active Customers in Customer Master (e.g., Customer Class = C -> active).
Definition
-
Category=CUSTOMER_MASTER_ACTIVE_KEY -
Fields=KEY_NAME, KEY_VALUE
|
Category |
Key Name |
Value |
IsDefault |
Order |
Key Label |
|---|---|---|---|---|---|
|
CUSTOMER_MASTER_ACTIVE_KEY |
KEY_VALUE |
C |
|
|
|
|
CUSTOMER_MASTER_ACTIVE_KEY |
KEY_NAME |
attribute3 |
|
|
Customer Class |
PFXTemplate_CustomerInsights_Customer_Segment
This table is used to define the customer segmentation. Customer segments can be obtained from multi data source types such as: Data Source, Customer Master, Customer Extensions. You can define it in this table.
You can add more customer attributes to the table if they are not present yet. Set the value of the Is Active column to YES, if you want to add this attribute into the segmentation processing and exclude the field with isCustomerId = YES. The field set to Is Customer Id = YES will not join into the segment data, the system uses it as a key to find data.
Main Columns
|
Column |
Description |
|---|---|
|
Source Type |
Data Source types from which we get data for the customer segments. They include:
|
|
Source Name |
Data source name. |
|
Source Field |
Source Field in the Data Source. |
|
Field Label |
Label of the field in the Data Source. |
|
Is Active |
If set to |
|
Is Customer Id |
If this field is customer ID in a Data Source, set the value to |
For the field you want to be a key to find data in DMDS, you need to set IsActive = YES and IsCustomerId = YES.
Example
We define that a customer segment will be obtained from the Data Source named 'Customer’ with these parameters:
Case 1: Segment data query from one source
Customer Type = active
Region = active
3 Customer Types = {Enduser, Industry, Restaurant}
4 Regions = {America, Oceania, Asia, Europe}
=> We will have 3*4 = 12 Customer segments = {Enduser_America, Enduser_Oceania,…..}
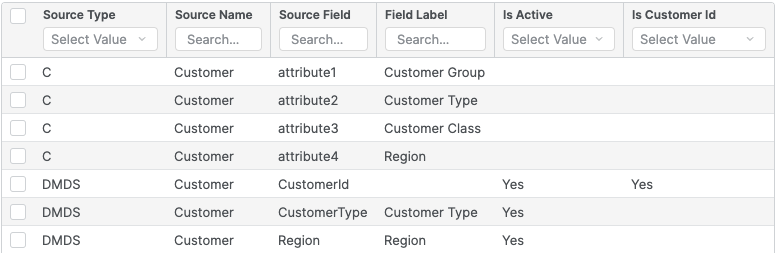
If the customer segment is queried from a Data Source, we must add the customer Id field name in this source and set the value to YES in the Is Customer Id column.
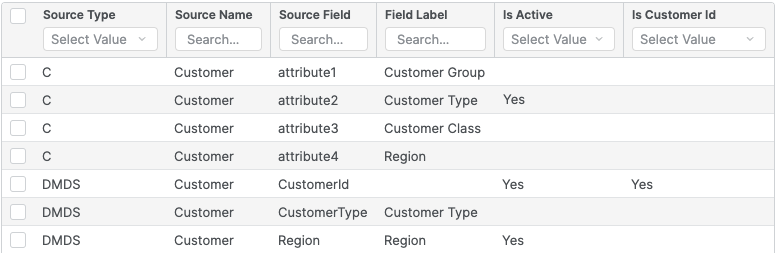
Case 2: Segment data query from two sources
Customer Type: get from Customer Master
Region: get from DMDS “Customer”
You need to create a configuration like this:
-
When querying segment data from multiple sources, the system will take time to process (query and combine). You should consider this before processing.
-
If the segment data is large and complex for combination, you should create a DMDS to build the customer segment data first, then use it in this configuration for Customer Insights Package.
CurrencySymbols
This is a Company Parameter of Sales Insights Package and it should be deployed by this package. Customer Insights re-uses it to show the currency symbol in charts. If your currency is missing, you can add it to this table.
|
Name |
Value |
|---|---|
|
AUD |
$ |
|
EUR |
€ |
|
GBP |
£ |
|
HKD |
$ |
|
JPY |
¥ |
|
NZD |
$ |
|
USD |
$ |
CI_QuoteType_Mapping
This table is used to define the Quote Type on each portlet of the dashboard. When a user selects multiple products and clicks the Create Quote button on a portlet, a new Quote with this Quote Type mapping will be created.
Currently, we support creating a new quote from 3 portlets of the Customer Products Portfolio dashboard, so this table has just 3 rows:
|
Dashboard Name |
Portlet Name |
Quote Type |
|---|---|---|
|
CustomerInsights_CustomerProductsPortfolio |
Pricing Opportunity |
__DEFAULT__ |
|
CustomerInsights_CustomerProductsPortfolio |
Selling Opportunity |
__DEFAULT__ |
|
CustomerInsights_CustomerProductsPortfolio |
Trends |
__DEFAULT__ |
If you want to change Quote Type, you need to update the column Quote Type of this table from __DEFAULT__ to your Quote Type name.