The Agent Assessment Overview Dashboard gives users a concise snapshot of active Agents, Total Actions, and Total Expected Impact, with visuals highlighting action status and the top agents by cumulative impact.
Set Up Filters
|
Input |
Options |
Description |
|---|---|---|
|
Select Agents |
|
Filter that allows you to specify particular Agents. By default, the filter is empty, which means the dashboard displays data for all active Agents (Agents with active Actions). |
|
Currency |
|
Allows you to choose the currency used in the dashboard. The exchange rate for the selected currency is fetched from system the |
|
Impact Metric |
|
Allows you to switch the currently displayed metric within the Expected Impact by Agent portlet. |
|
Action Status |
|
Filters Actions based on their current status. |
|
Assigned To |
|
Filters Actions according to their designated assignee. |
|
Due Date |
|
Allows you to set up a date range for the Action's Due Date (Start Date > End Date). |
Data
Data for all the portlets is read from the Action Items with input filters applied.
Please note that deleting an Agent does not remove the Actions generated by that Agent. These Actions will still be displayed in the dashboard. Unwanted Actions can be located under Actions and deleted as needed. Alternatively, the Action Status input in the dashboard allows you to filter Actions by a specific status (such as DONE, OPEN, REJECTED, etc.).
Analyze Results
The dashboard provides the following summaries.
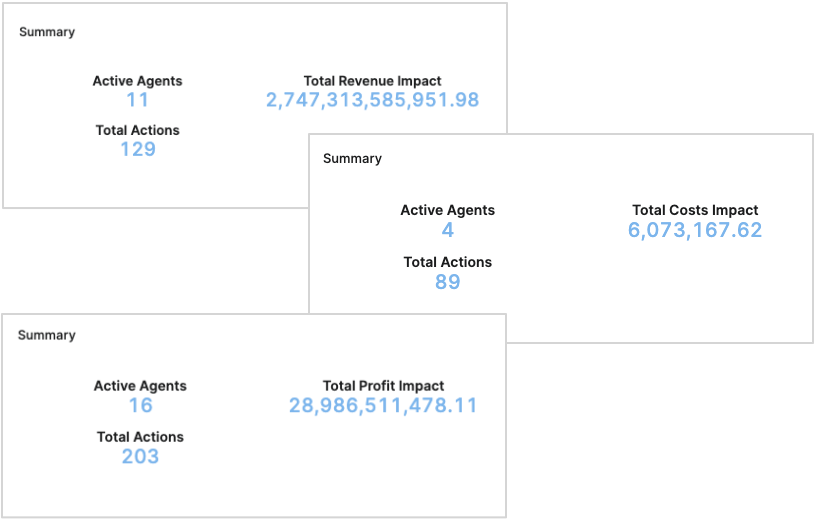
Summary
The Summary portlet provides a concise snapshot of the dashboard’s key KPIs and updates dynamically based on the selected Impact Metric.
-
Active Agents – Counts the unique Agents that have at least one retrieved Action Item in the current filter context. This represents Agents with active Actions.
-
Total Impact – Displays a dynamic label (for example, “Total Revenue Impact”) that matches the currently selected Impact Metric and shows the aggregated impact value across the retrieved Action Items.
-
Total Actions – Shows the number of Action Items returned by the current filters.
Changing the Impact Metric updates both the label and the computed total so that the Summary reflects the chosen metric.
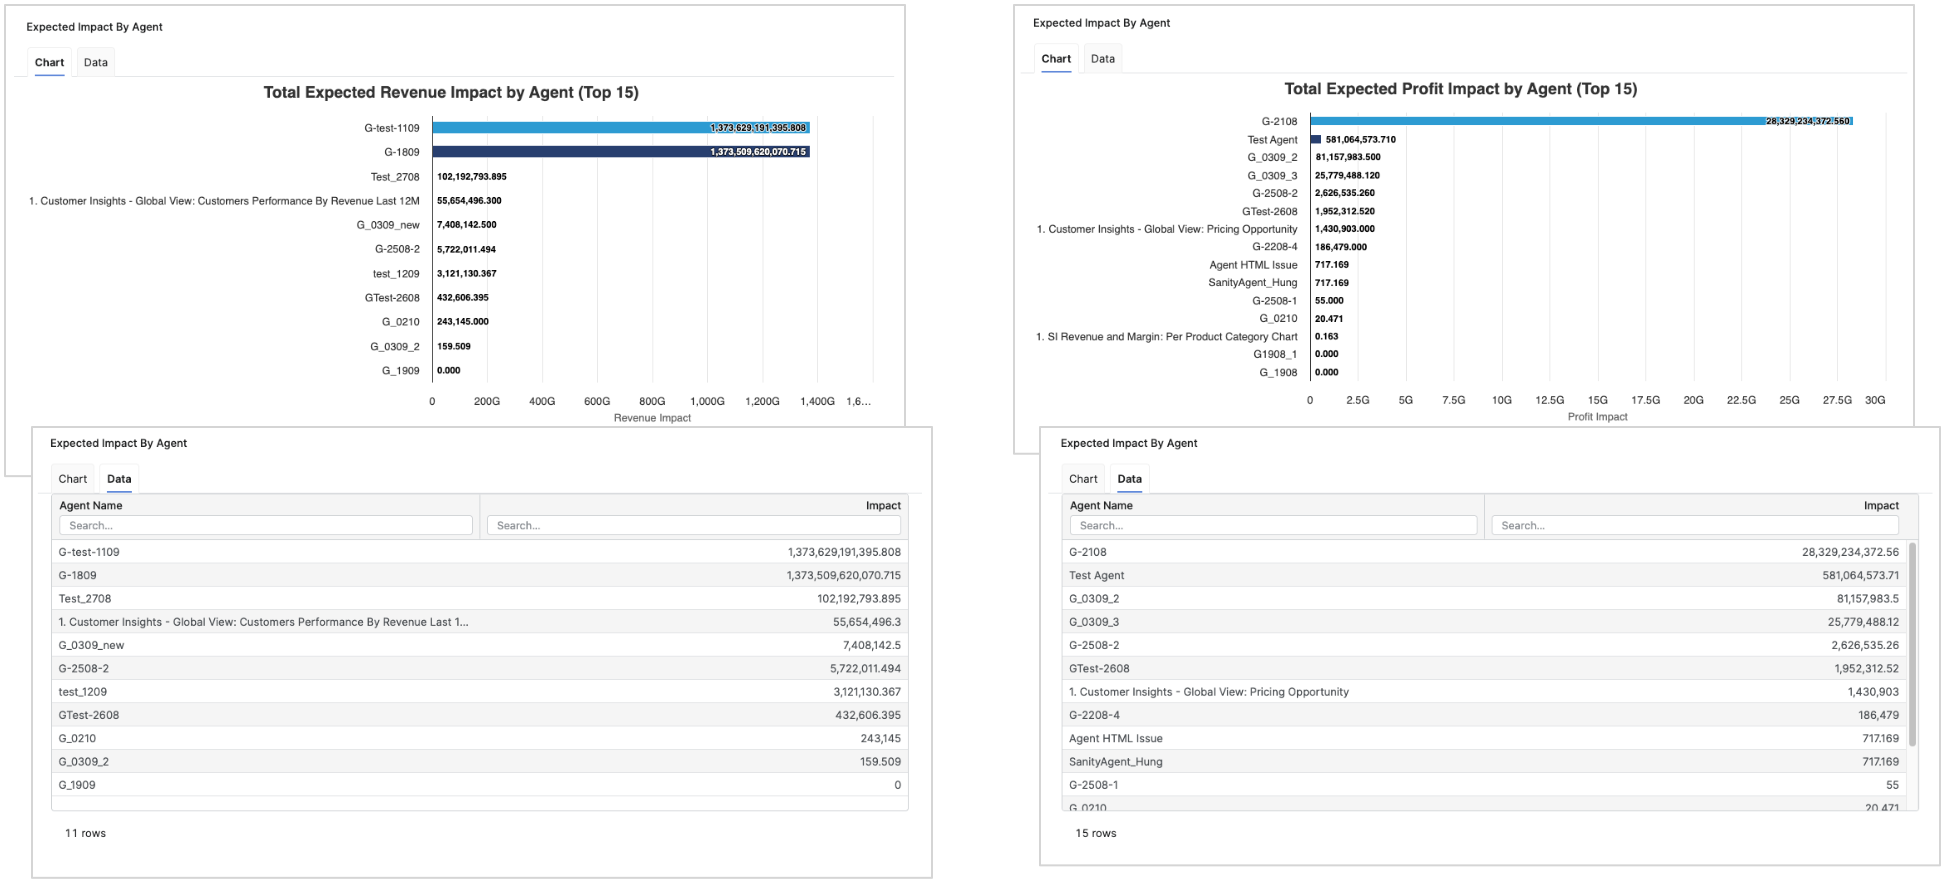
Expected Impact By Agent
The Expected Impact By Agent portlet highlights which Agents contribute the most cumulative impact, based on the selected Impact Metric, and respects all dashboard filters.
-
Bar Chart – Displays one bar per Agent (originator), showing the sum of the selected the Impact Metric over their retrieved Action Items. The chart title reflects the chosen metric (e.g., “Total Expected Revenue Impact by Agent”). Bars are ordered descending so that the Agents with the highest cumulative impact appear at the top (chart shows the top Agents first, e.g., Top 15).
-
Data Tab – Provides a table with two columns. Agent Name and Impact, including simple search inputs for each column. Values match the cumulative impact seen in the chart.
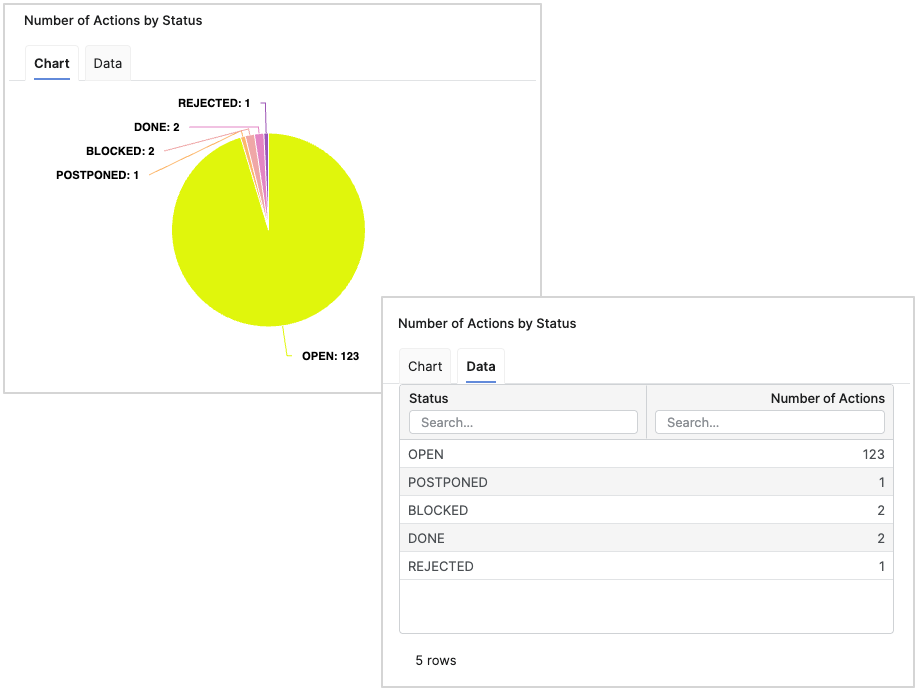
Number of Actions by Status
The Number of Actions by Status portlet summarizes how the retrieved Action Items are distributed across their Status values, with a pie chart and a data table view that respect the dashboard’s active filters.
-
Pie Chart – Visualizes all retrieved Action Items grouped by their Status, with labels showing the count per slice.
-
Data Tab – Provides a table with two columns. Status and Number of Actions, including simple search fields to filter rows.
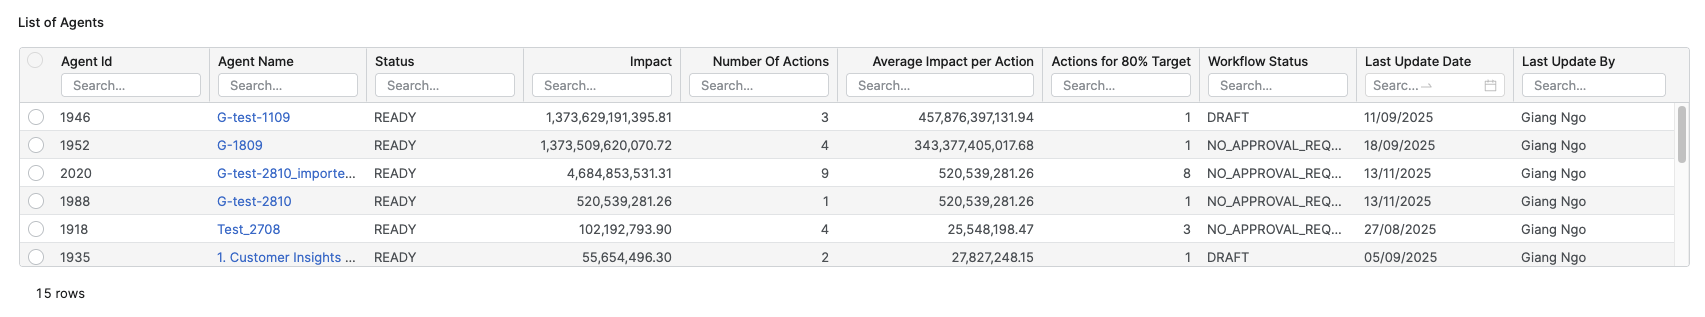
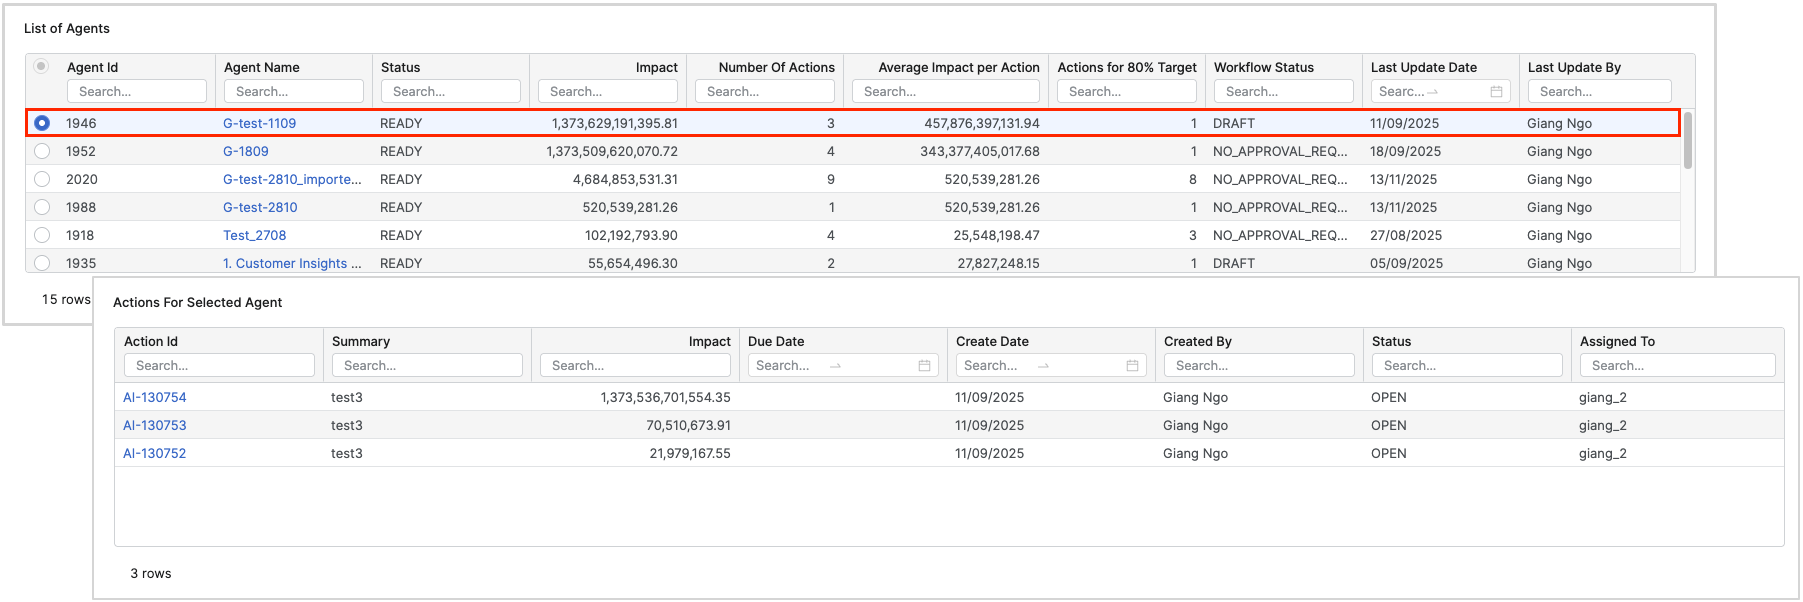
List of Agents
The List of Agents portlet presents one row per Agent with key operational and impact metrics, and supports drill-through into related details and model objects. It respects all dashboard filters and is sourced from retrieved Action Items.
-
Row per Agent (originator) – This column view allows quick comparison across Agents.
-
Actions for 80% Target – Computed using a cumulative approach (sort each agent’s actions from highest to lowest impact, then count actions cumulatively until reaching 80% of the agent’s total impact).
-
Link to a Model Object – In the Agent Name column; clicking the link opens the model object (MO) in a new browser tab for deeper inspection.
-
Average Impact Per Action – Average Impact Per Action is computed with the following formula.
Average Impact Per Action = Impact / Number of Actions -
Row Click Behavior – Selecting any row opens the additional Actions For Selected Agent and Prioritization Chart portlets, including the calculated metric.
|
Column |
Description |
|---|---|
|
Agent Id |
ID of the Agent. |
|
Agent Name |
Clickable Agent Name linking to the Agent’s model object, opens in a new tab. |
|
Status |
Current workflow status of the Agent record. |
|
Impact |
The cumulative impact for the Agent (based on the selected Impact Metric). |
|
Number Of Actions |
Count of actions associated with the Agent in the retrieved dataset. |
|
Average Impact per Action |
Impact divided by number of Actions. |
|
Actions for 80% Target |
Number of top-impact Actions required to cumulatively reach 80% of the Agent’s total impact. |
|
Workflow Status |
Workflow state for the Agent record. |
|
Last Update Date |
Timestamp of the most recent update to the Agent record. |
|
Last Update By |
Name of the user who last updated the Agent record. |
Actions For Selected Agent
The Actions For Selected Agent portlet lists all the Action Items for the Agent currently selected in the List of Agents table and provides a quick link to the detailed review experience for each Action.
-
Row per Action Item for the selected agent – Displays only the Actions belonging to the Agent highlighted in the List of Agents table.
-
Clickable Action Id – The Action Id column contains link, clicking an id opens the Action Review Dashboard in a new browser tab with the particular Action.
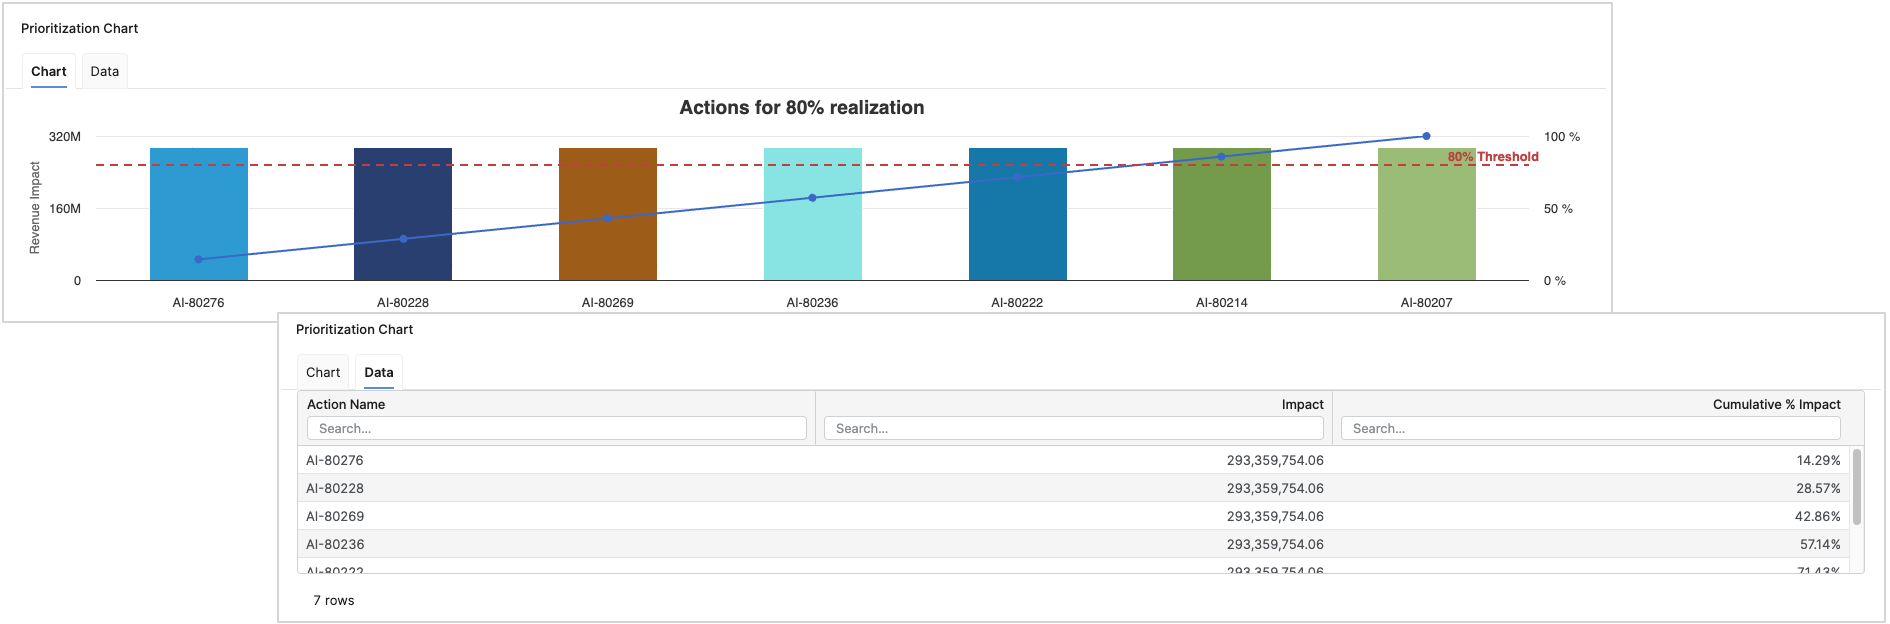
Prioritization Chart
The Prioritization Chart portlet visualizes which individual Actions drive the most impact and how quickly their cumulative effect approaches the 80% realization threshold.
-
Column for Each Action Item – Vertical bars show each Action’s name and its impact value, enabling direct comparison across Actions.
-
The Left Y-axis – This axis displays the Impact values.
-
The Right Y-axis – This axis shows 0 – 100% cumulative percentage. A cumulative line overlays the bars to indicate progress toward total impact.
-
80% Threshold Line – A dashed plot line marks the 80% threshold, highlighting how many top Actions are needed to reach 80% of total impact.
-
Sorted by Biggest Impact – Actions are ordered descending by impact so the most impactful items appear first, aligning with the cumulative line’s rise toward the threshold.
Demo Video
See Also