In this use case scenario, we are looking to improve sales team effectiveness and confirm governance and policy compliance. Note that in this situation, part of the flow includes analytics which rely heavily on quality data.
LEARN MORE: To understand the importance of quality data, data readiness and how you can get the best data for your project, click here.
Good to know: Some of our screen may differ as we are in a demo environment.
Situation description
For the purposes of this tutorial, we will look at the application from a sales manager and a large global distributor perspective. In the current state, sales leaders have limited ability to align with pricing policies and coach their sales team members on margin centric sales metrics. Enter Pricefx! Our solution allows you to gain detailed visibility into things like win loss, governance and compliance, and other critical KPIs, resulting in sales and margin improvement and higher rates of team retention and satisfaction based on improved confidence and goal achievement.
Workflow
Let's see how Sales leaders can use PriceFx for team performance management.
Step 1: Dashboards
Starting off on the Pricefx home page, you can see that we're filtered to a typical Sales Account Executive for Sales Manager view, showing Pending Approvals, Quotes and Actionable Insights dashboards. In this case, you can explore sales insights, rebate management, customer insights and other dashboards, but for the purposes of this demo, we'll focus on those that are most aligned with quoting.
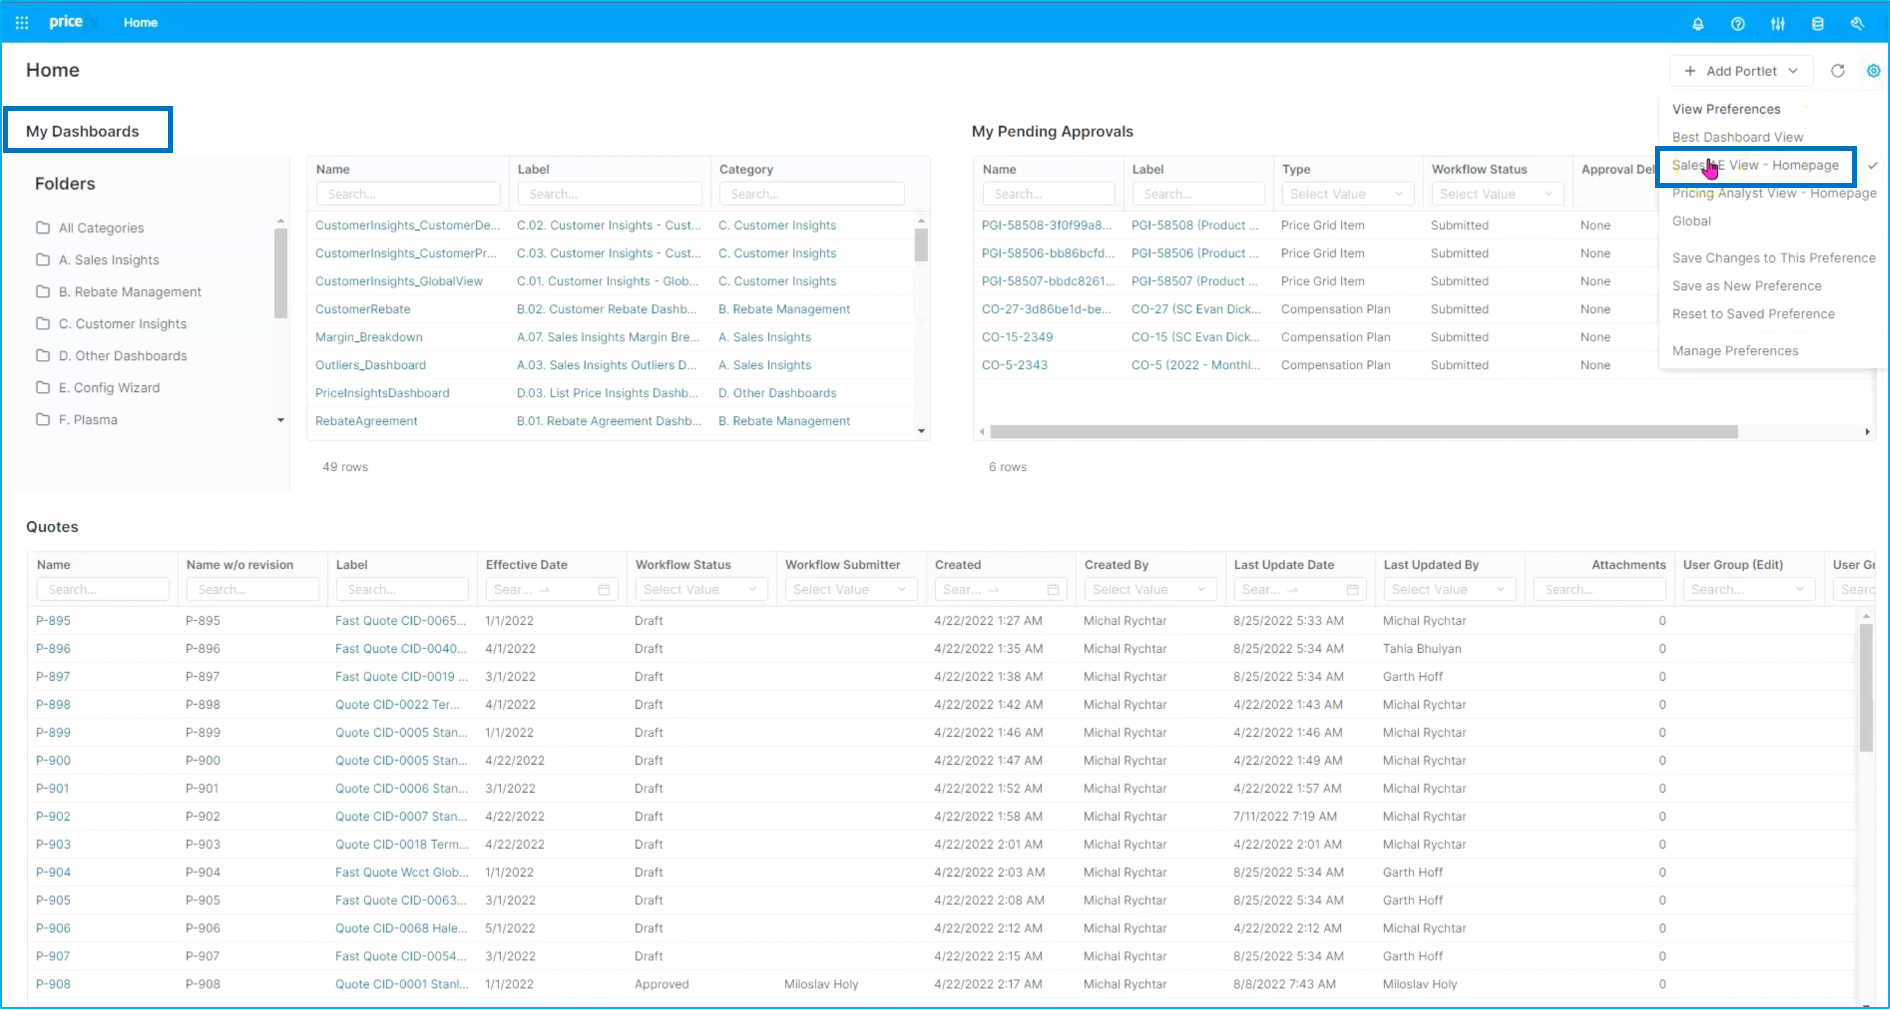
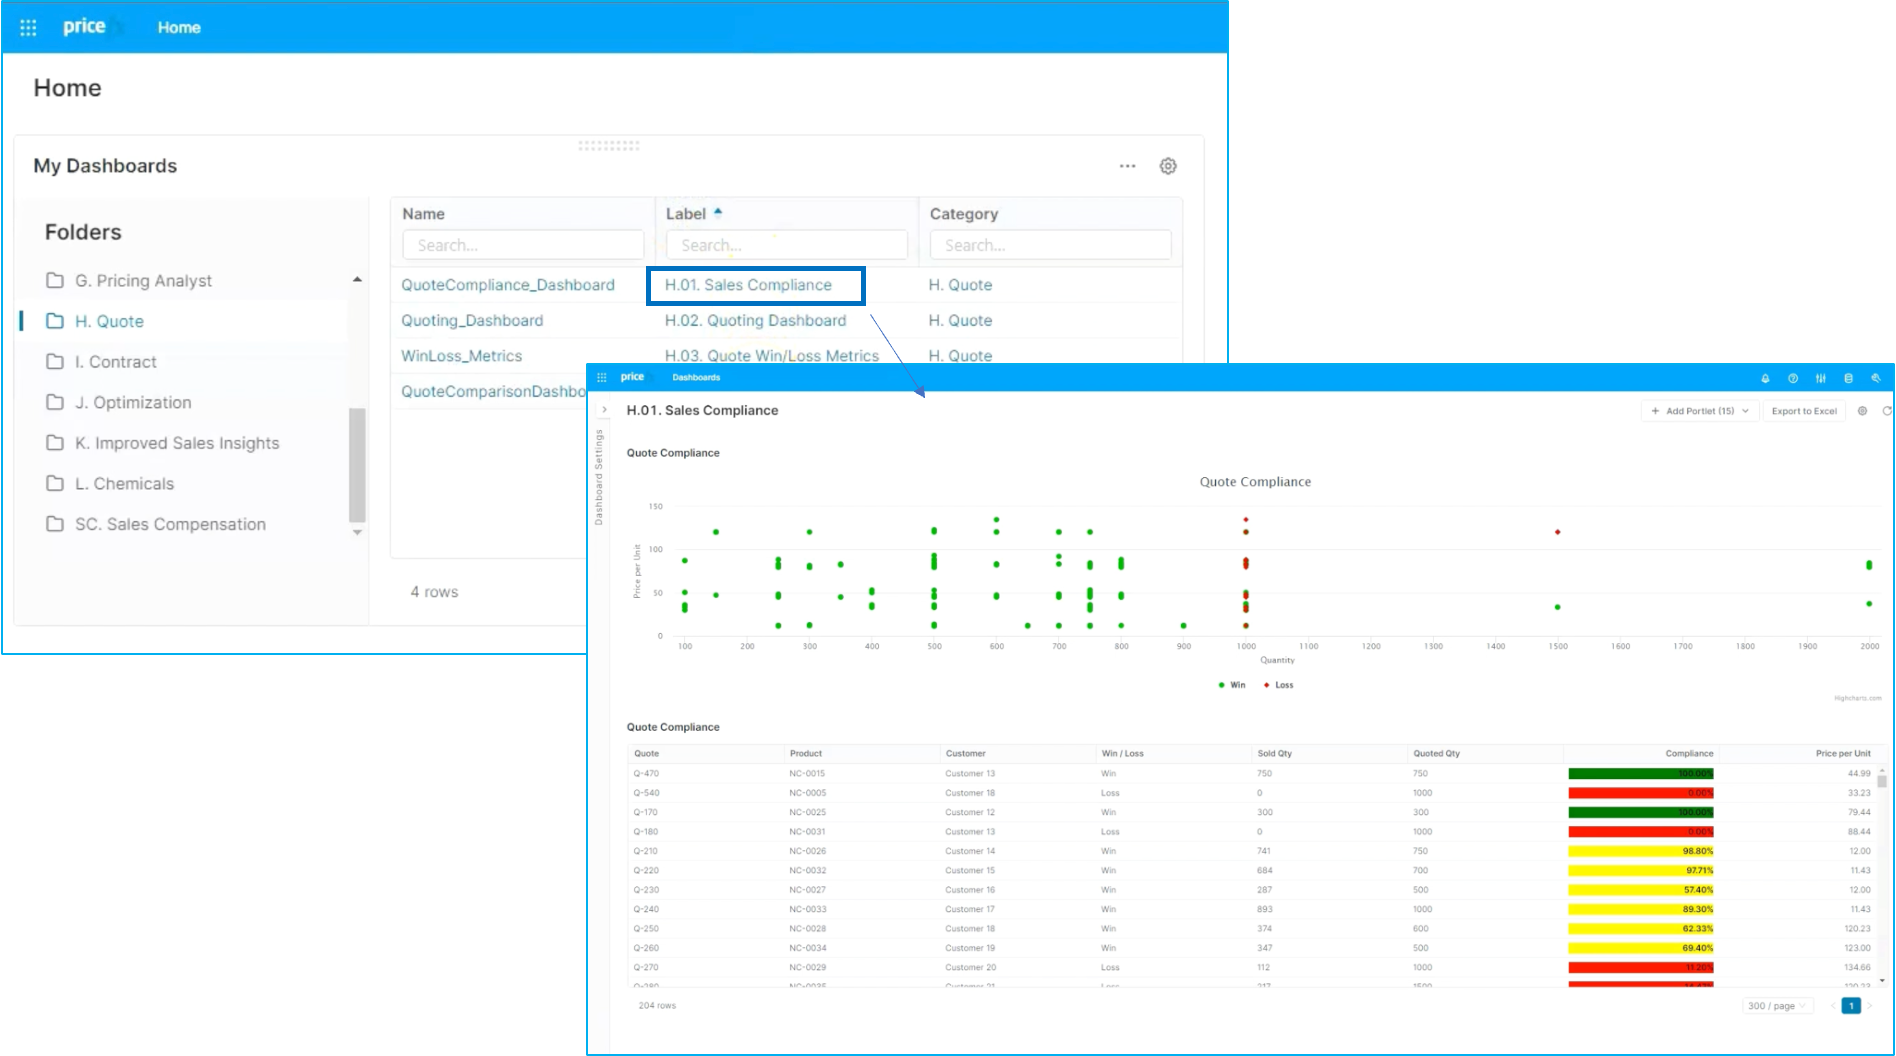
There are a couple of different dashboards here that focus on compliance. We'll start off by looking at the sales compliance dashboard.
Step 2: Sales compliance dashboard
In this case, we can see price per unit against quantity with an overlay of win/loss data, as well as quote compliance detail that goes to the individual quote ID level. You can also see information on product, customer, win/loss, quantity and additional detail.
Step 3: Quote Win/Loss Metric Dashboard
Another useful view is the Quote Win Loss Metric dashboard. This gives you traditional time series views of win/loss data by region while allowing you to drill down into more detail or into a singular view. You can also see win/loss data by sales representative; this allows you to identify individual reps where performance improvement is required. You can also monitor that improvement actually occurs.
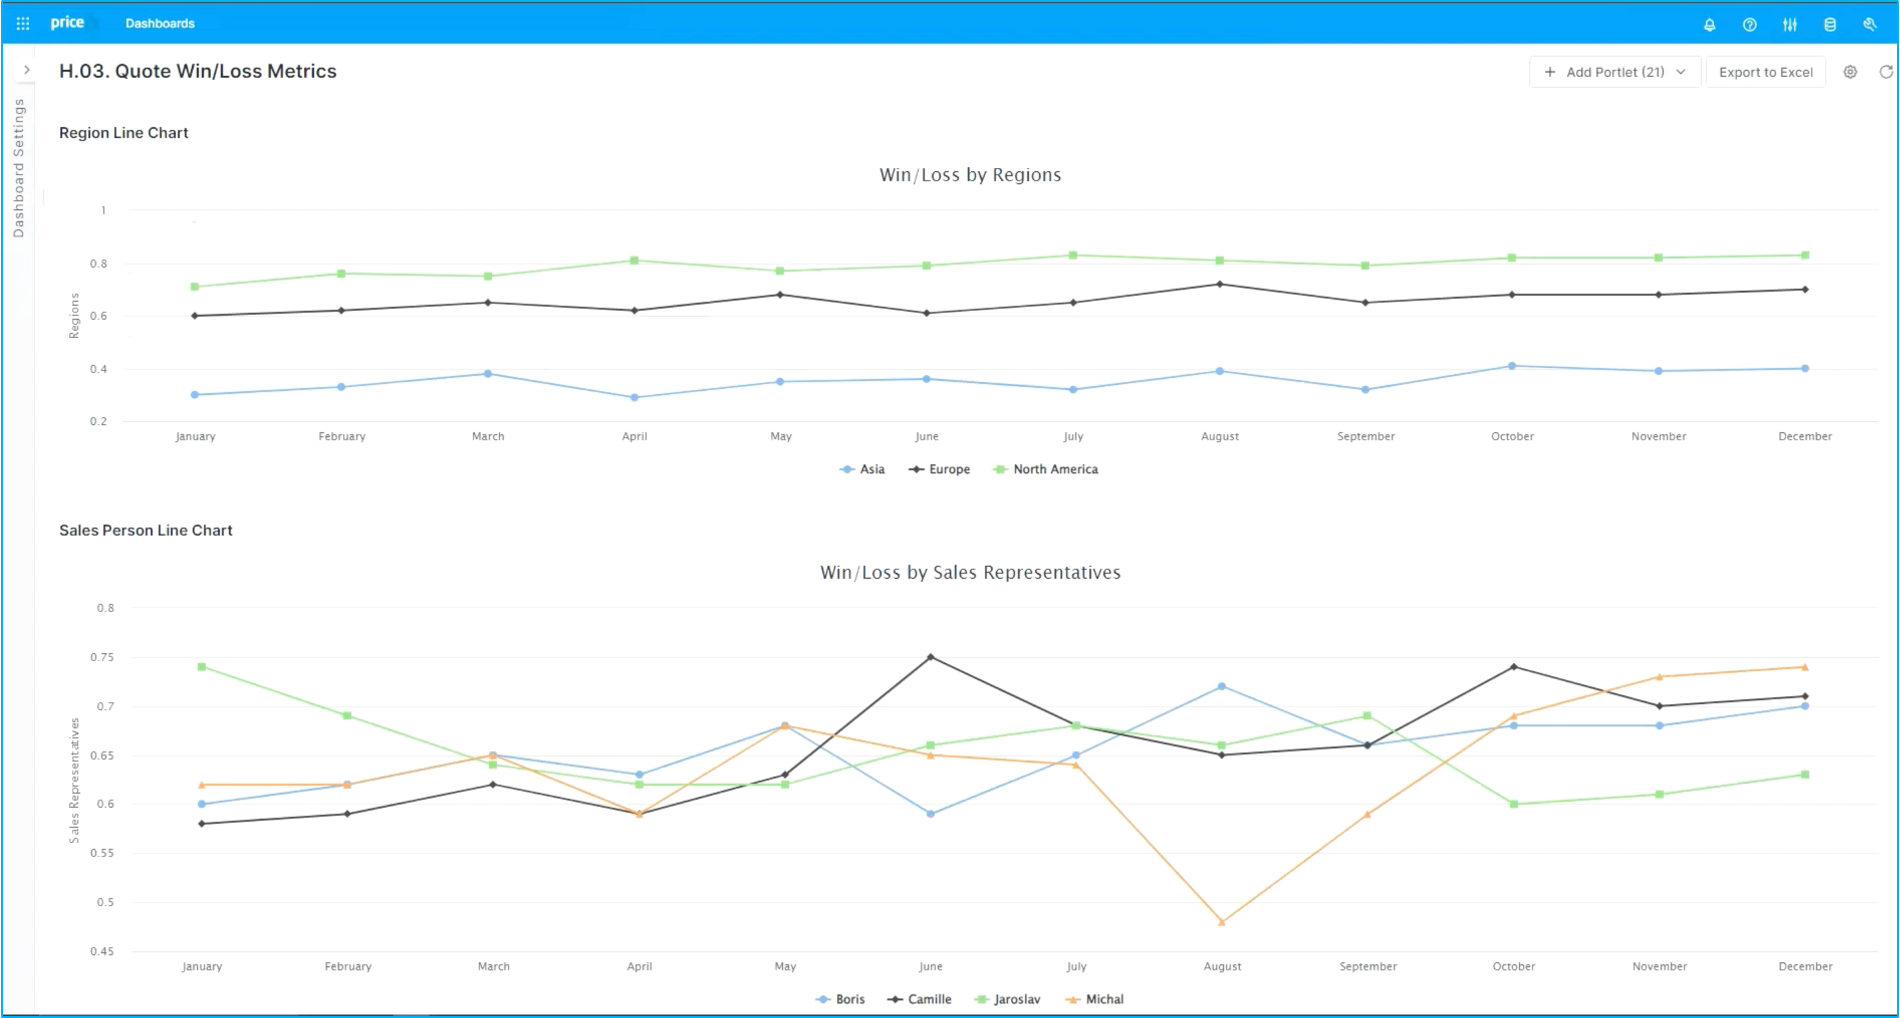
Also going down to more of a product centric view where you can see win/loss by product and product category. Again, you can drill down into additional quotes detail.
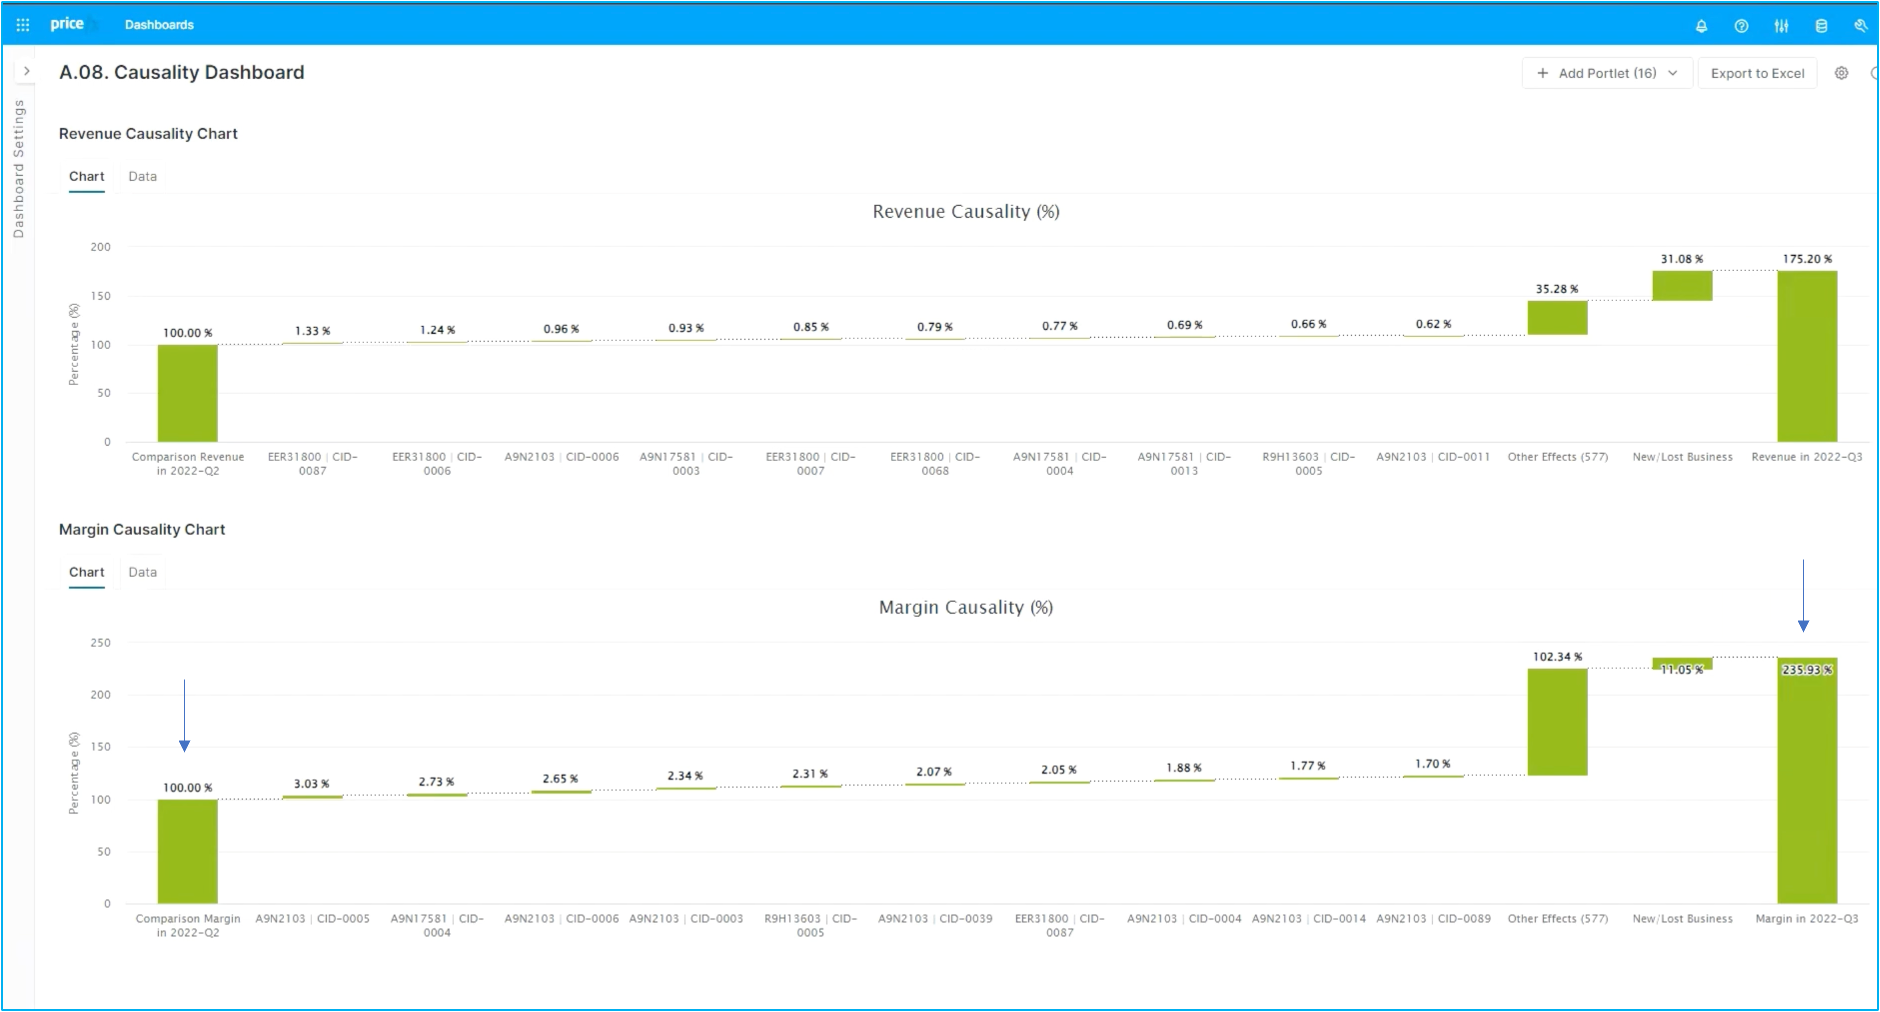
Step 3: Price waterfall dashboard
Let’s move on to other dashboards, in particular to the price waterfall. This is another useful sales insight that can give us visibility into discounting behavior in terms of on invoice discounting as well as off invoice discounting, rebates and buying group type activity, as well as payment terms.
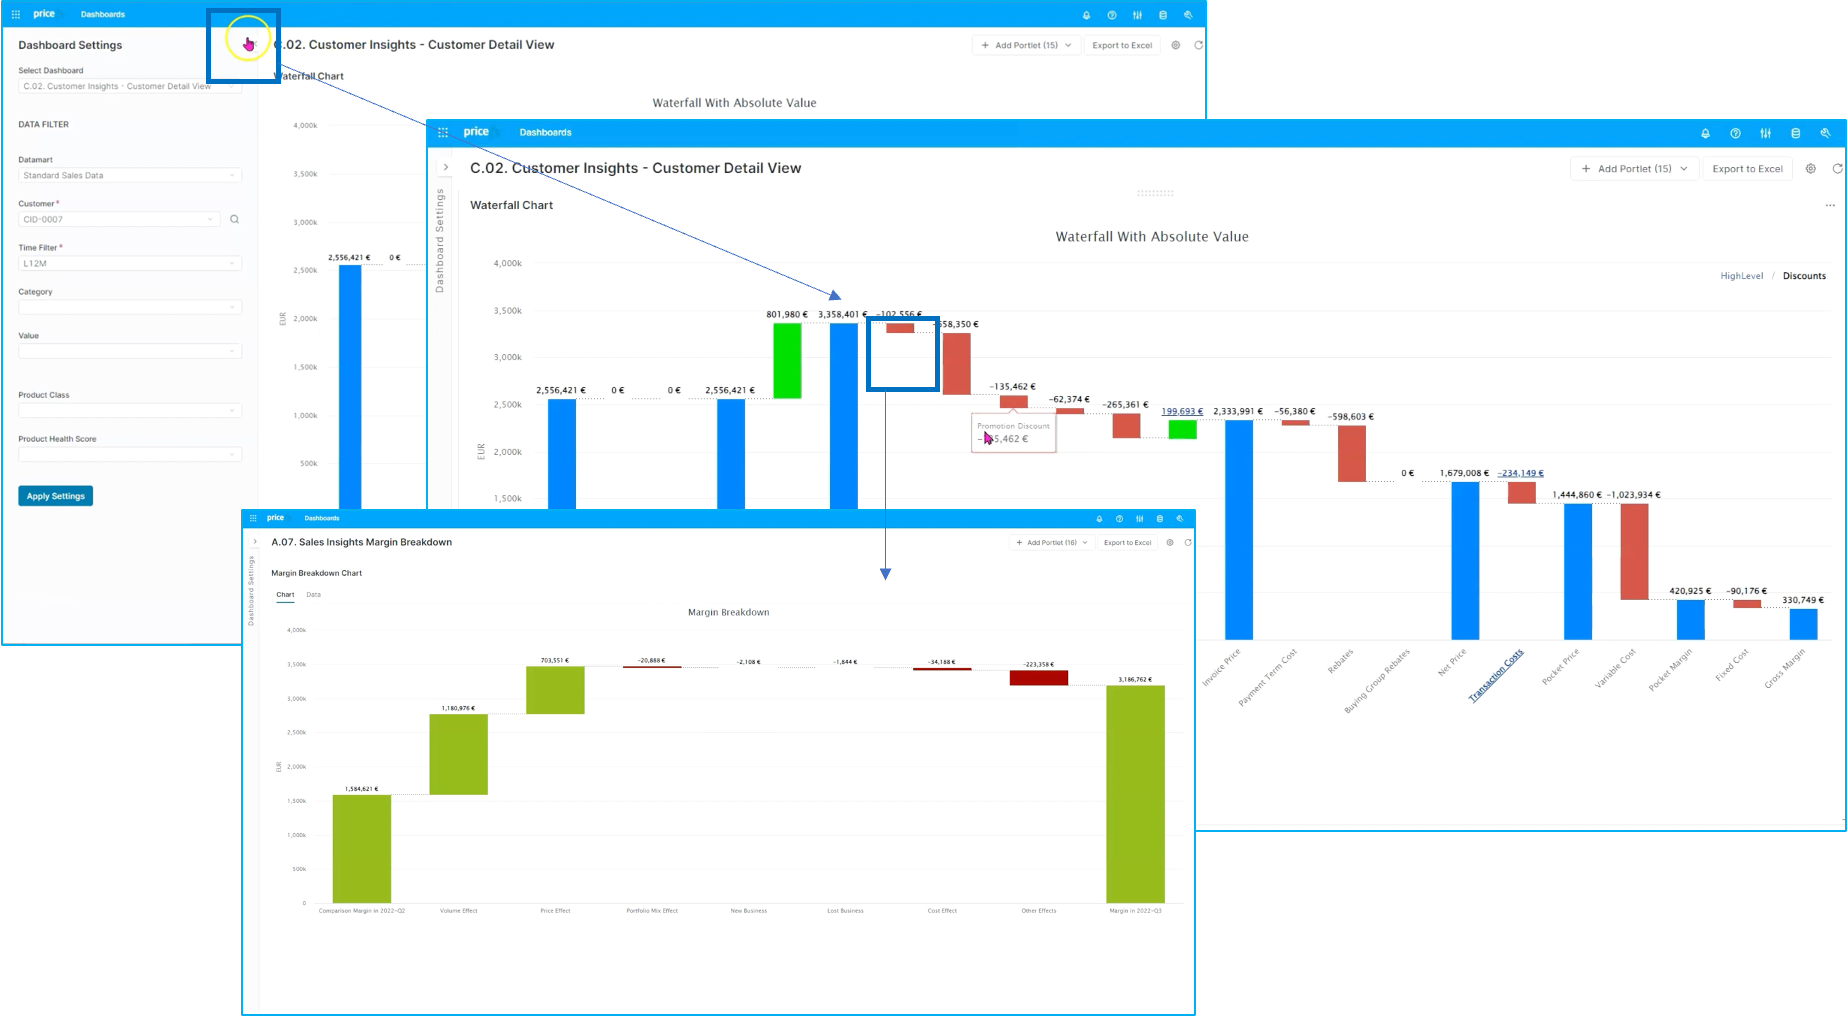
For the costs in this case, you can see specifically the cumulative impact of all the invoice discounting, and in particular, those negotiated discounts. As we're making pricing changes, the sales organization could understand how this flows down into margin in terms of volume, price and portfolio effect over time, as well as see the specific causality from a revenue and margin perspective, again giving context into which product and customer combinations are most responsible for improvements in price and margin.
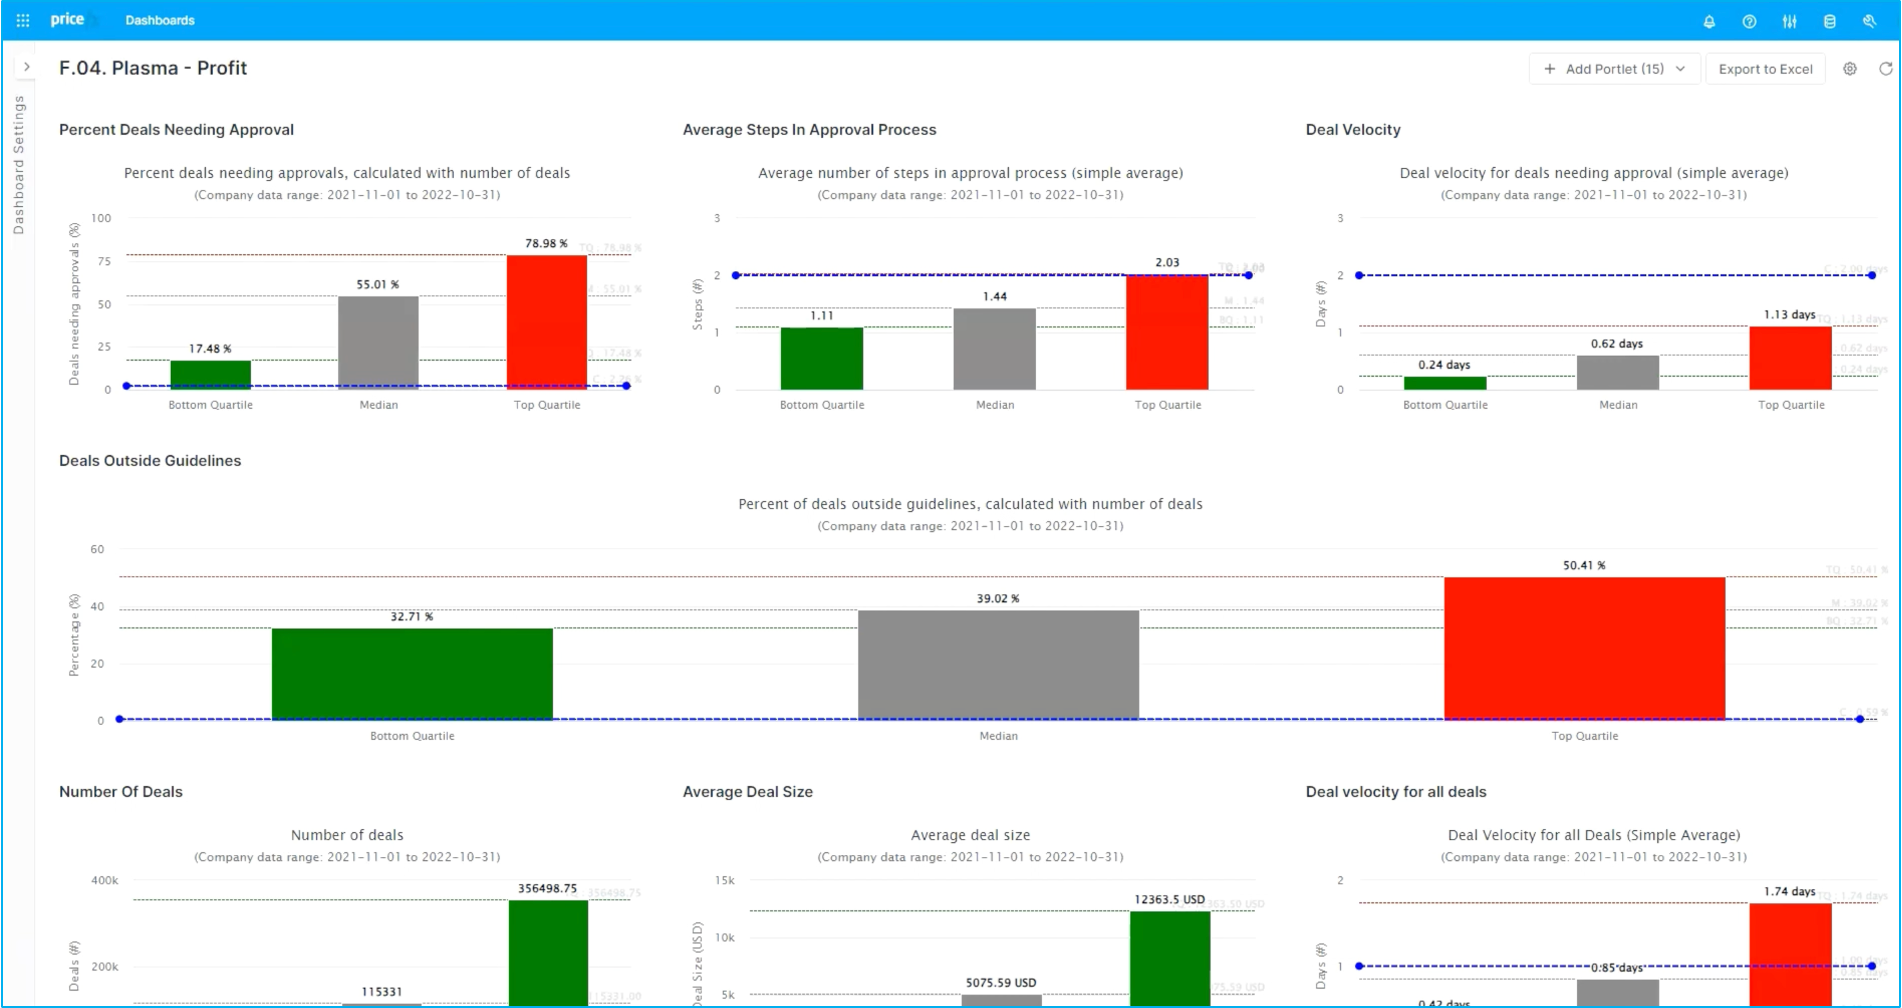
Step 4: Pricefx Plasma
Last but not least will take a look at PriceFx Plasma. This is the KPIs and benchmarking service. That's a unique capability within PriceFx's specifically for pricing management and sales management teams. We're looking specifically at our profit dashboard, one of three or four different dashboards that are specific to the Plasma.
LEARN MORE: To see why and how Plasma can kick up your pricing game and what it entails, click here.
This detail shows you information around approvals, processes, deal velocity, quote, guideline, compliance, deal size, and deal velocity among other KPI's. As an example, we could take a look at Average steps in deal.
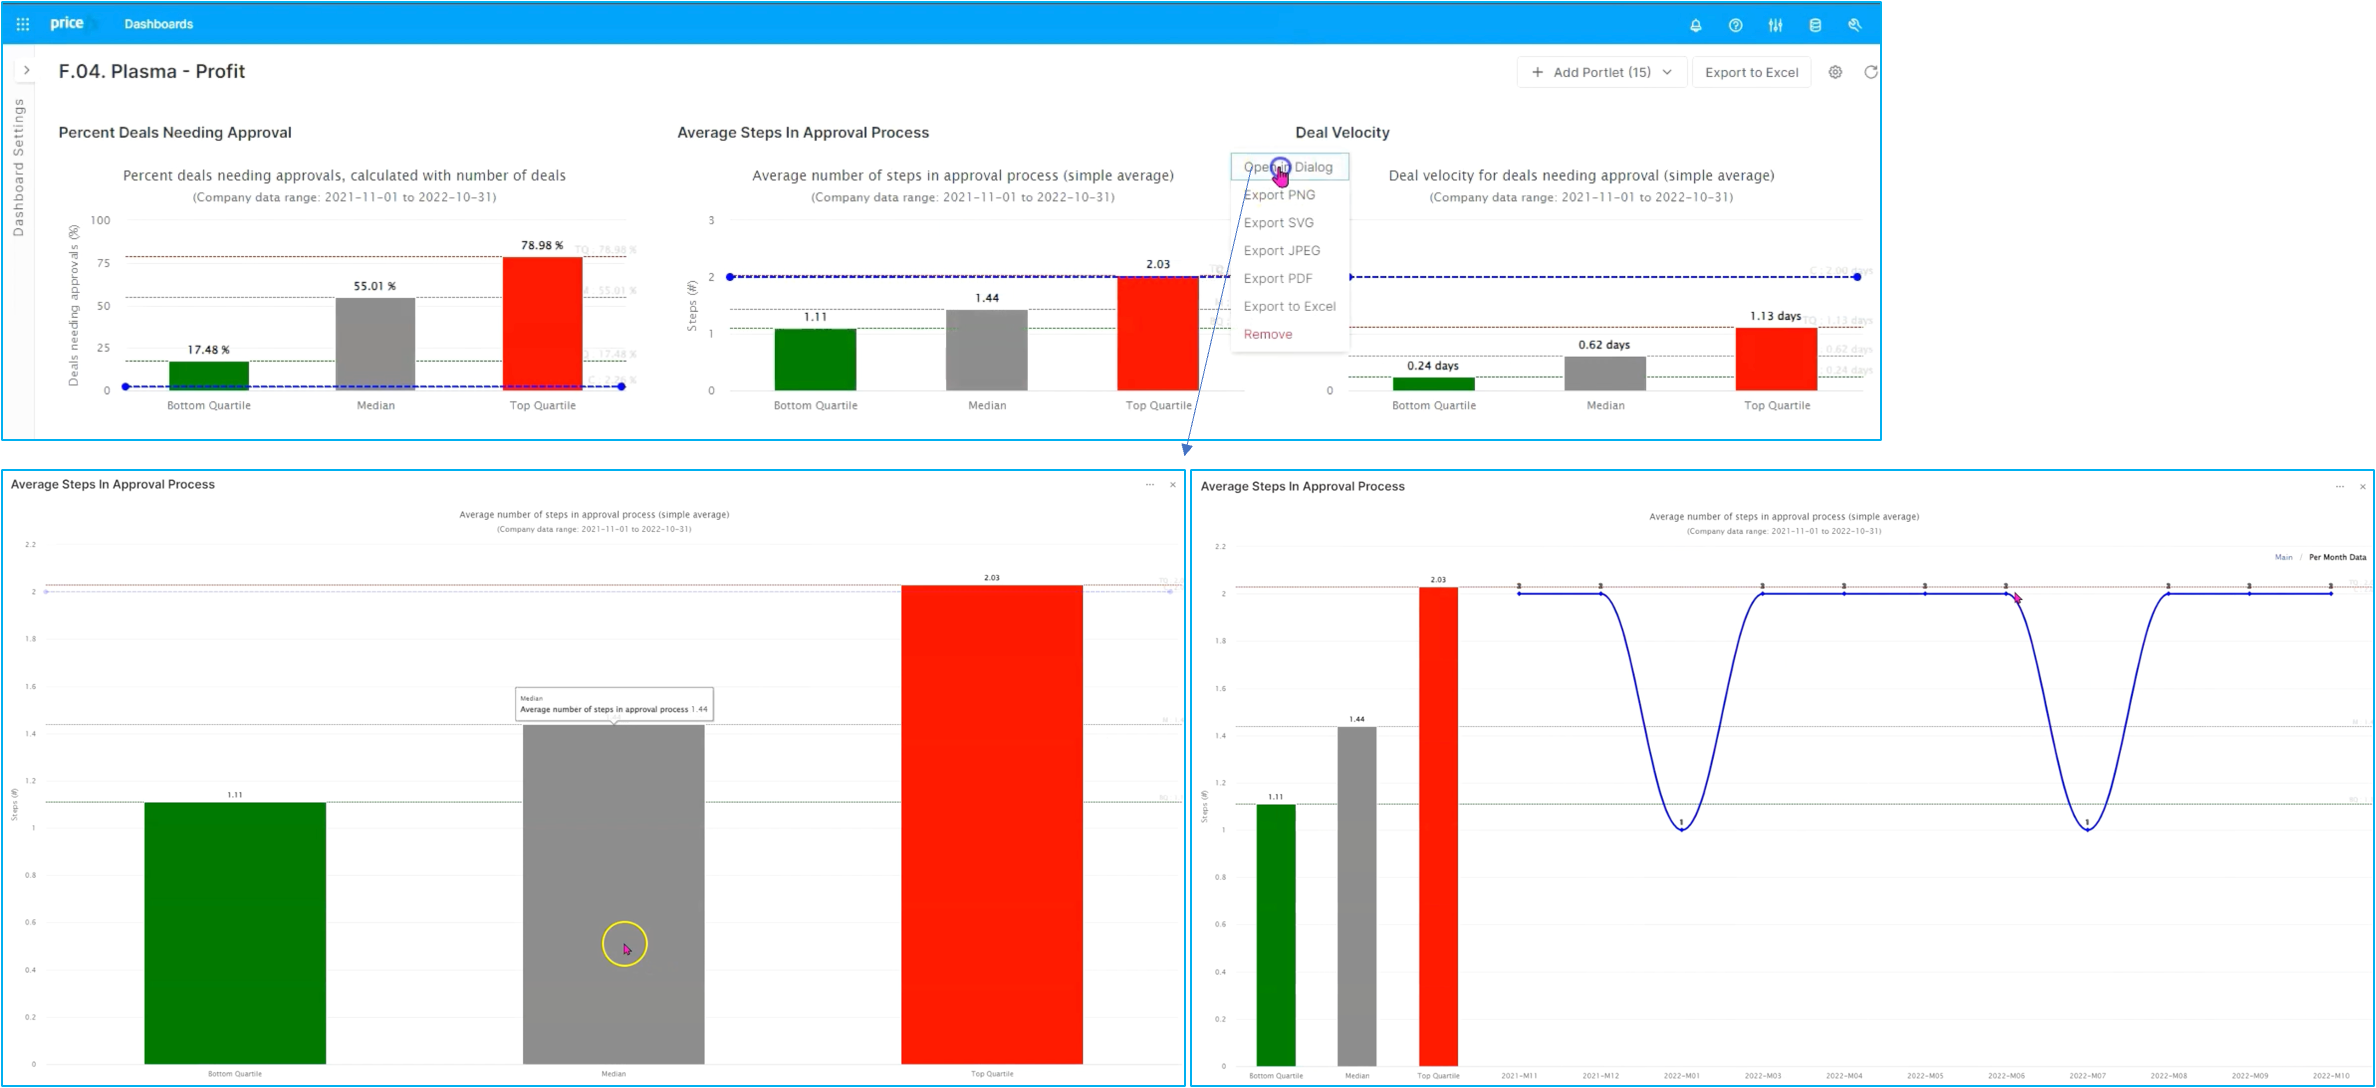
In this case, we can see how our performance is from highest performance (in green) of 1 to 1 1/2 steps to worst performance (in red) around two or more steps in the approval process. And we can also see how we as an individual company are performing over the last several months.
From this perspective, we can see how we're improving or we're keeping a steady state, but also have a view of how we're comparing to best in class from the sales organization perspective.
Improved sales team effectiveness and strategic alignment is essential for team retention and driving profitability and growth. You can see that with Pricefx, you have all the visibility into KPIs to help you easily manage performance. This concludes the performance management flow in our solution.