In this use case you are looking at how you can have complete visibility of supplier cost updates, cost trends and business impact to improve your margin.
Good to know: Some of our screen may look differently as we are in a demo environment.
Situation description
For the purposes of this step-by-step tutorial, we will assume you are a Director of supplier costing at a large global distributor. In your current states, you have limited visibility into the potential impact of supplier cost changes, and manual and disconnected data and processes. Pricefx allows you to leverage existing costing data and improve processes including real time supplier updates, impact analysis, alerts, trending and other actionable insights resulting in improved margin due to faster and more accurate cost allocation processes and overall improved supplier relationships.
Workflow
Let's see how you can improve margins with improved cost visibility, workflows in Pricefx.
Step 1: Dashboards - Supplier Cost Summary
Starting off on the home page, let’s have a look at My Dashboard section. For our purposes, we'll focus on costing. You will see that dashboards that can be used for cost management workflows and support of strategic pricing and mass price changes have been configured.
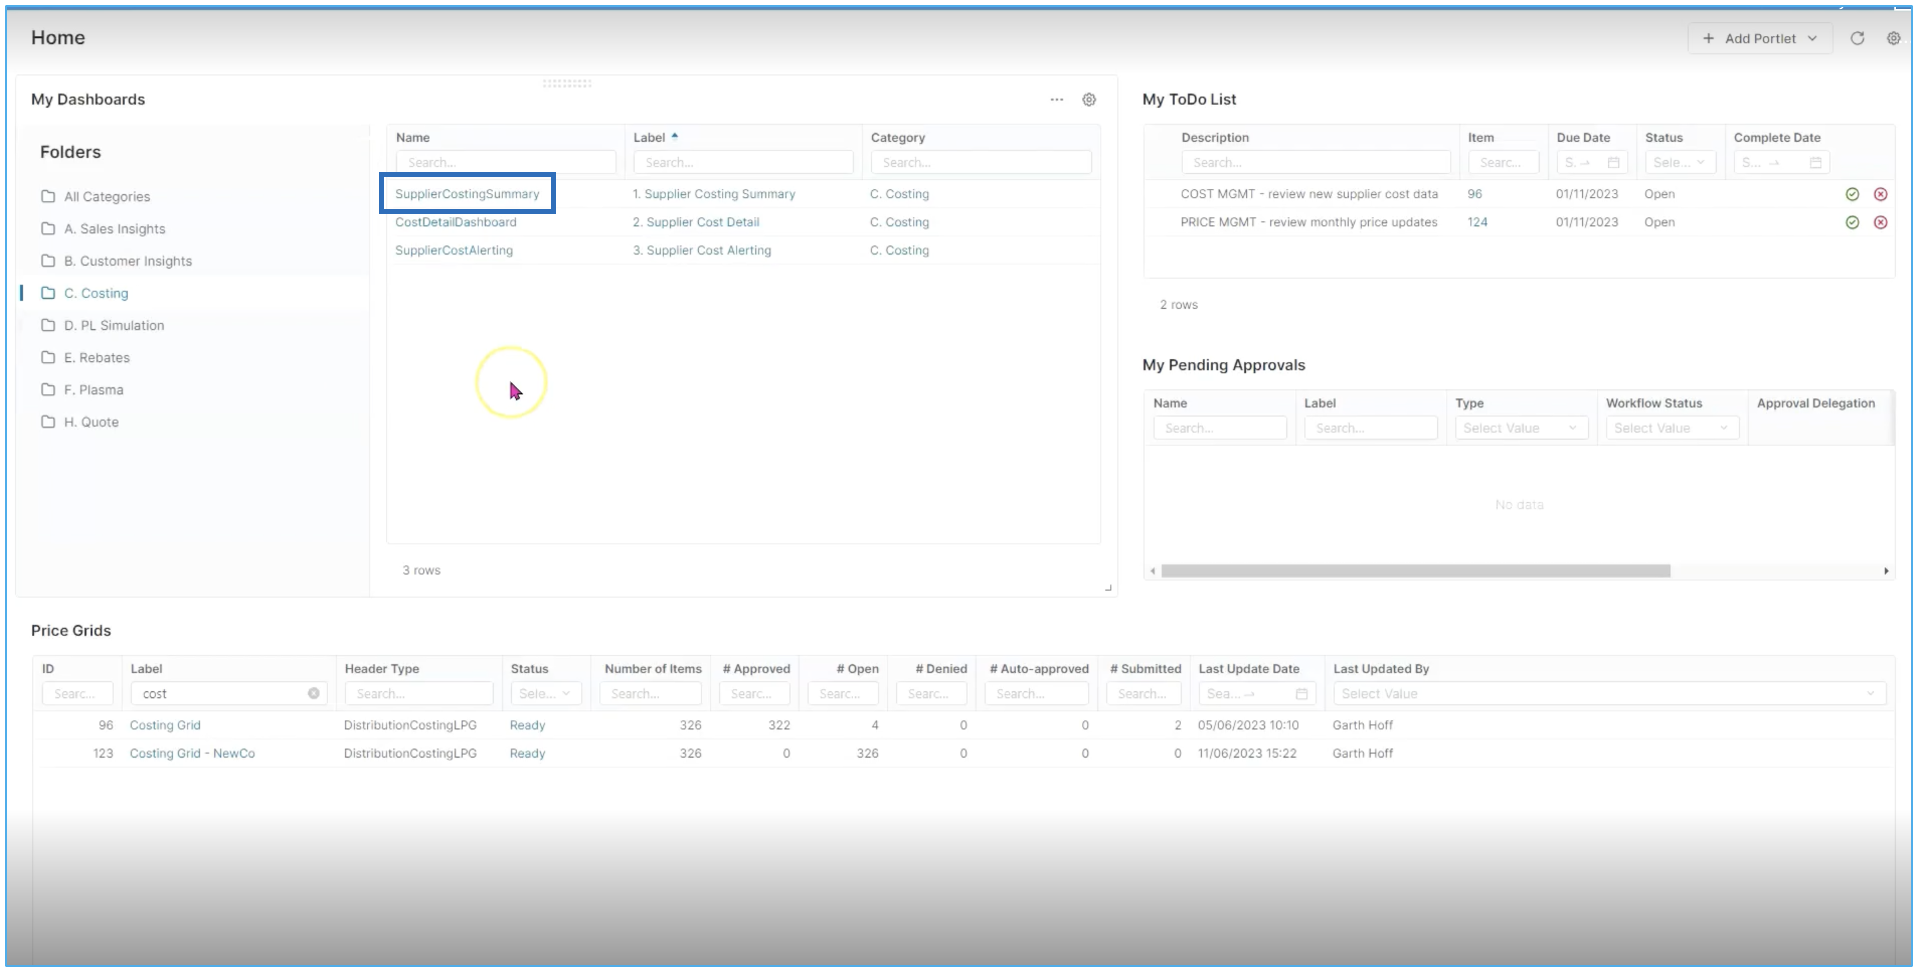
Starting with the first dashboard, Supplier Cost summary, you have a detailed view. Here you can drill down into more information around category summary and business unit category.
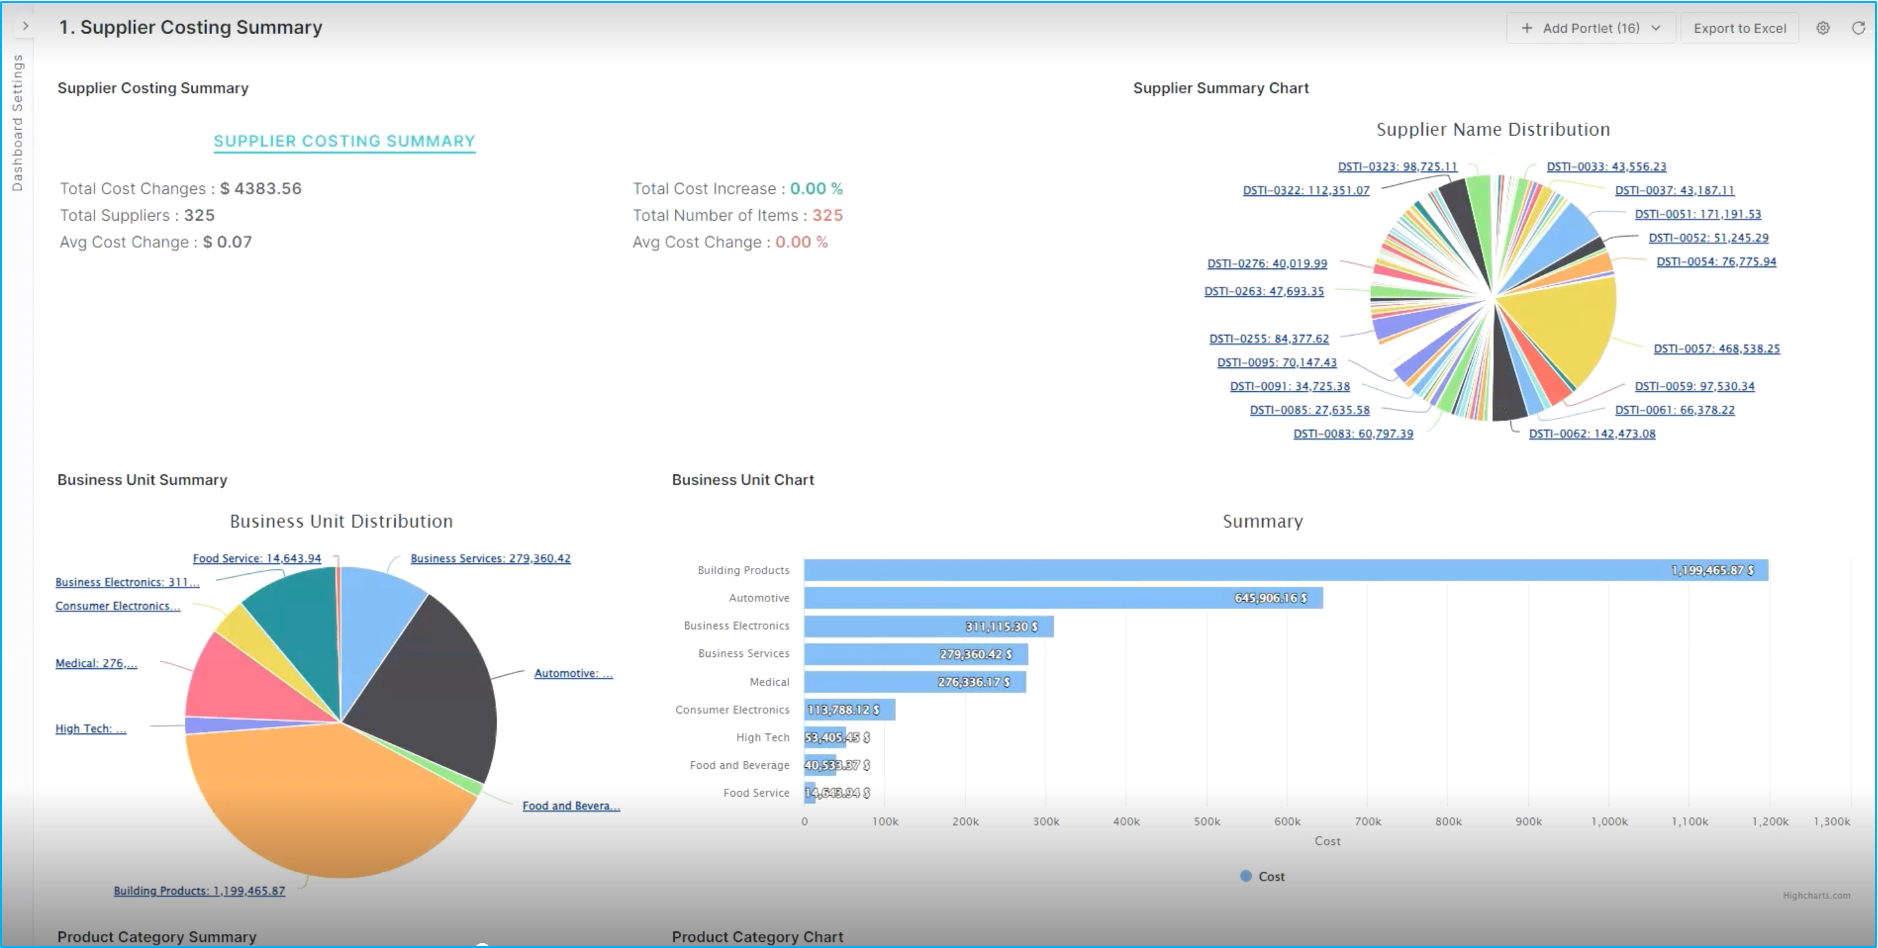
Starting at the top, you see supplier costing summaries as well as supplier summary charts, displaying the largest and most impactful suppliers in your supply chain. If you scroll down, you can see detailed views around the business unit summary, for instance some of the largest business units around building products. This will allow understanding the underlying costing details in terms of product categories and SKUs.
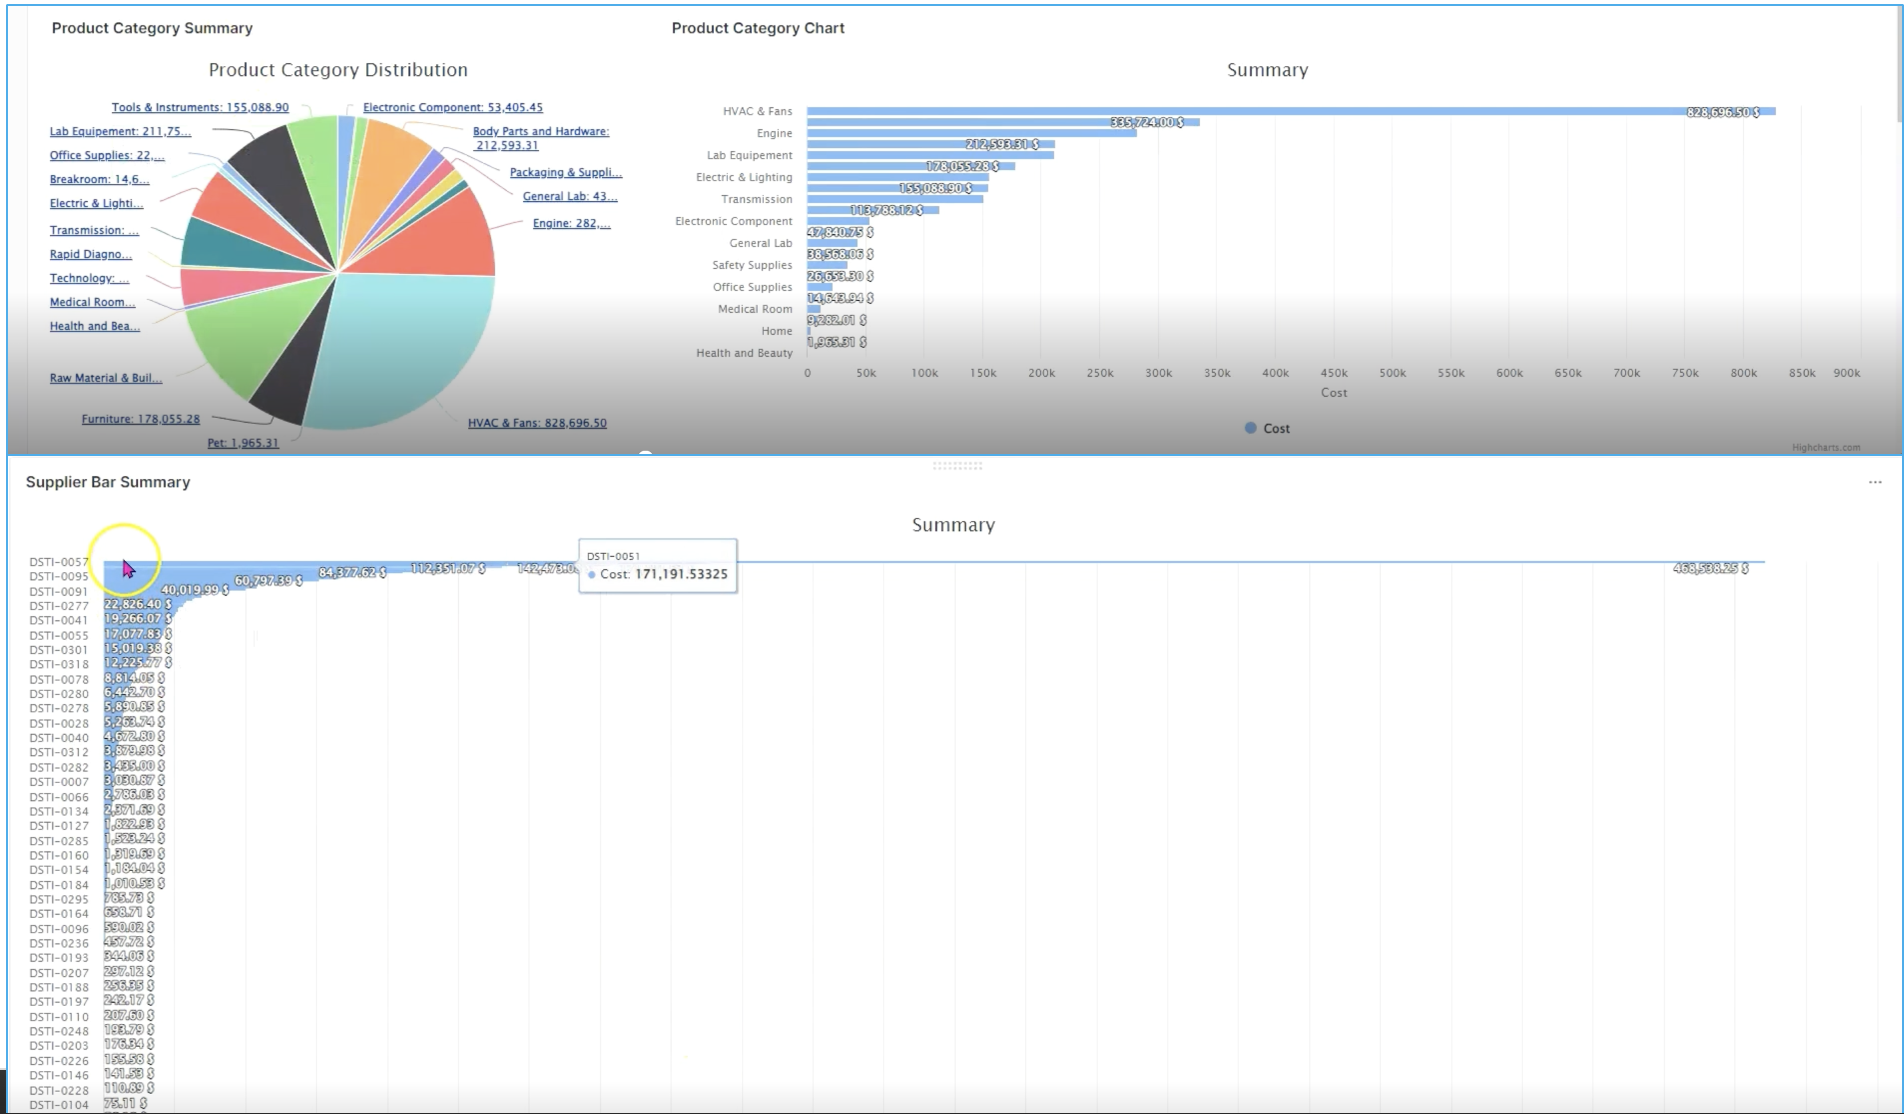
If you look at individual categories, you can drill down into those largest visibility into what's happening around costing. All the way down to the individual supplier chart. From largest to smallest. In this case, we'll filter down into a single business unit or product category.
Step 2: Business Units
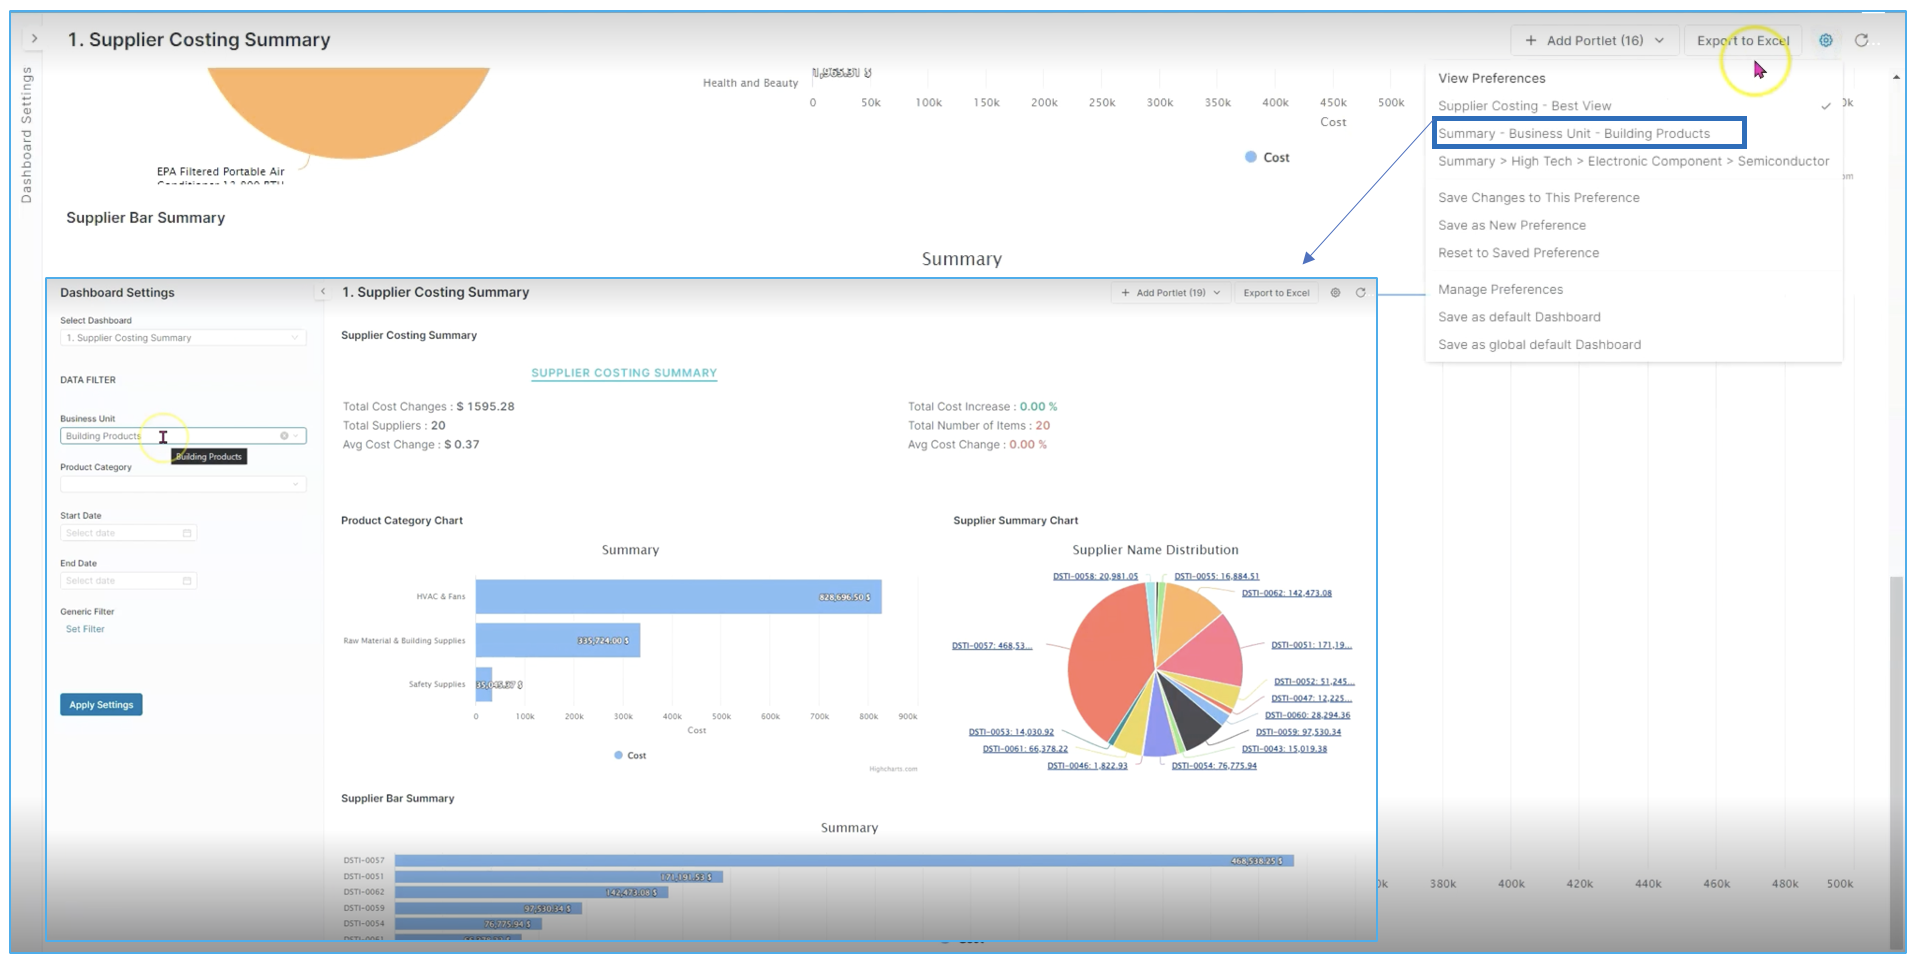
For this tutorial we selected a saved view that focuses on specifically on the Building Products (see above) business unit and we'll see a lot of the same information. But in this case, we'll only see the individual product categories and the building products area, which again gives us the ability to understand the root causes of cost change and variability from our highest cost change suppliers down to our lowest, or at least significant cost change suppliers.
Step 3: Supplier Cost Detail
Next, let's take a look at our supplier cost detail. We'll go into much more information here around things like business unit detail and supplier cost detail. For example, you can filter on average cost change per unit in order to see which one is the highest, which is building products. You can see that we have already filtered down to finding the individual supplier that has the highest average cost change per unit.
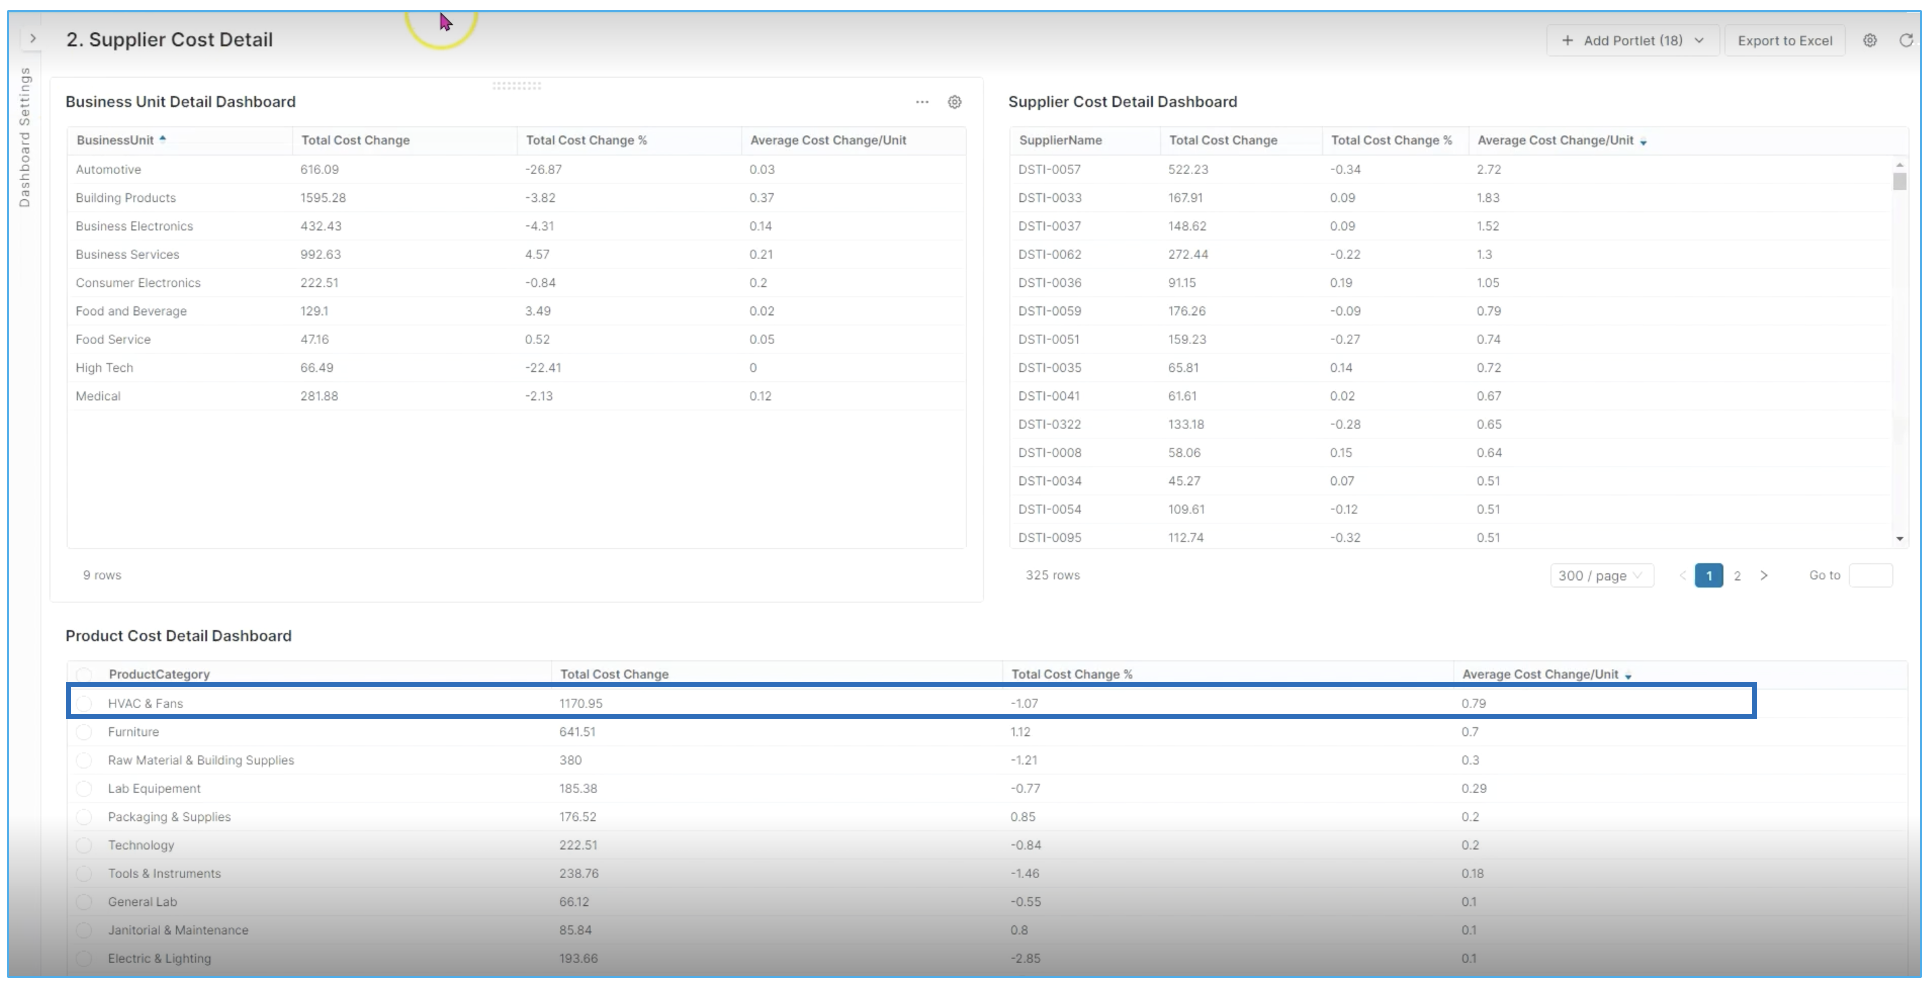
So this information alone gives some actionable insights that we can consider. But knowing that building products is a pretty significant one to look at.
We'll drill down into HVAC and fans for example. Again, one with a very high average cost unit change. And then we can drill down into the individual products again from highest to lowest based on category of maybe most recent change. Highest total change or again maybe percentage or unit cost change to understand which one of those individual skews is most leveraged in terms of the cost changes that we have to think about as we apply these for pricing strategy.
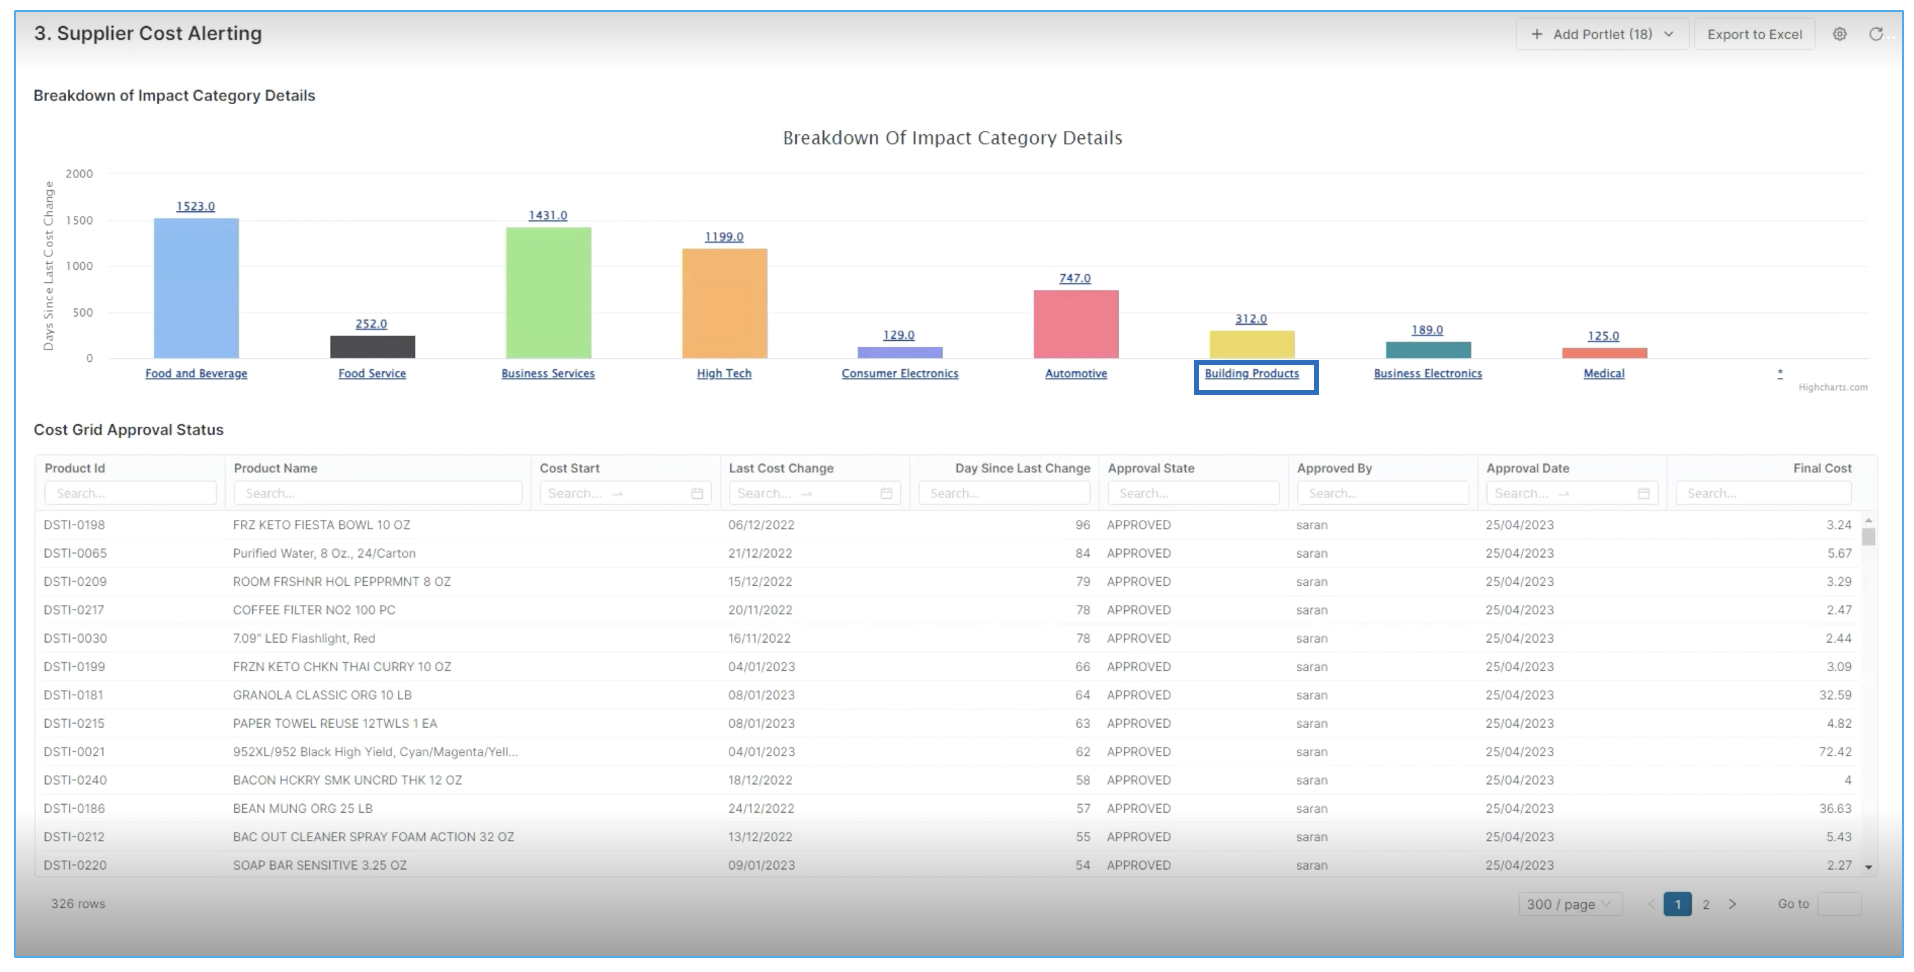
Step 4: Supplier Alerting
Next we look at supplier alerting and in this case we can get a lot more context into which individual products by supplier are driving change from a costing perspective. In this case, we filtered down into our Building Products view.
To get to Supplier Cost Alerting, navigate back to Dashboards ➡️ Supplier Cost Alerting, the drill down into a specific category details.
Again this is just a saved view where we filtered only for Building Products business unit. You can also see that we can either select multi business units or maybe a single business unit, multi supplier or single supplier costing grid in order to get the correct information that we're looking for. So in this case, again, we're looking for just the individual building products, suppliers and products that have the highest impact from a costing perspective, which gives us a bit more information to move on, including details like approval state.
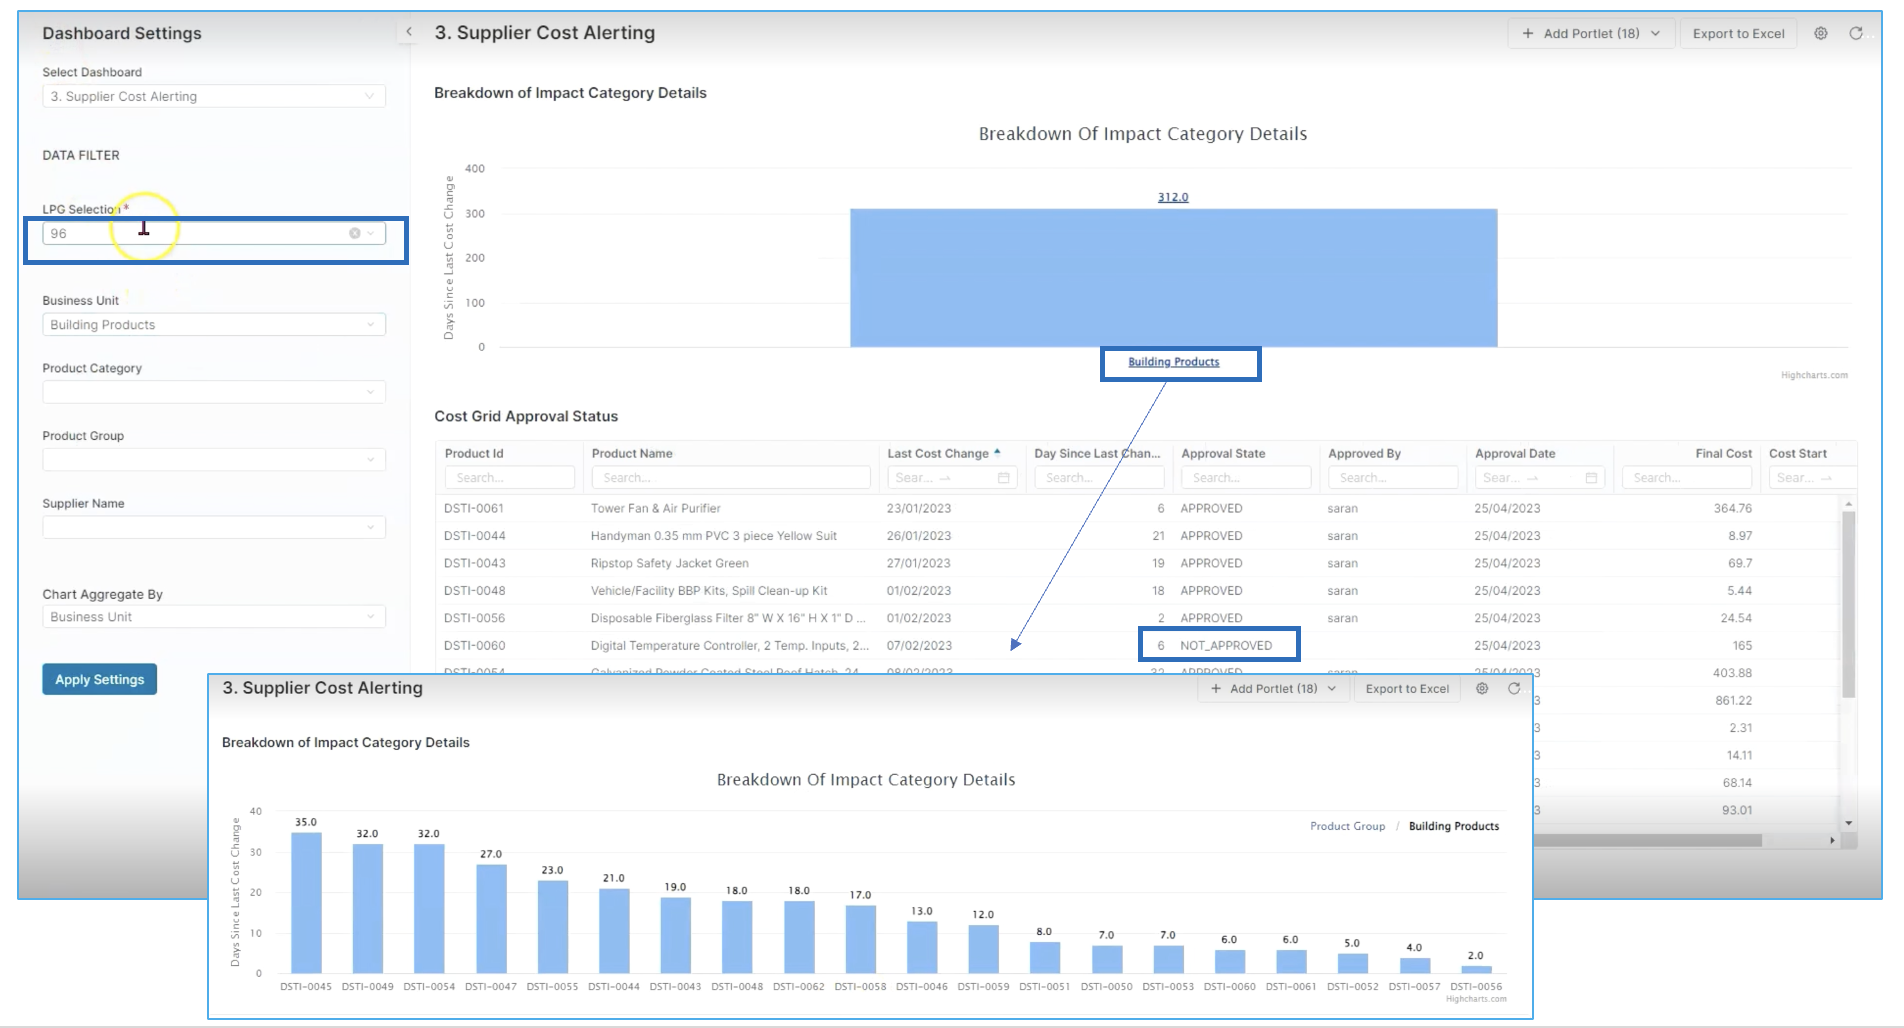
In this case, we have one individual SKU which has not gone through the costing approval. This might be creating margin compression and it is something that should be taken into account.
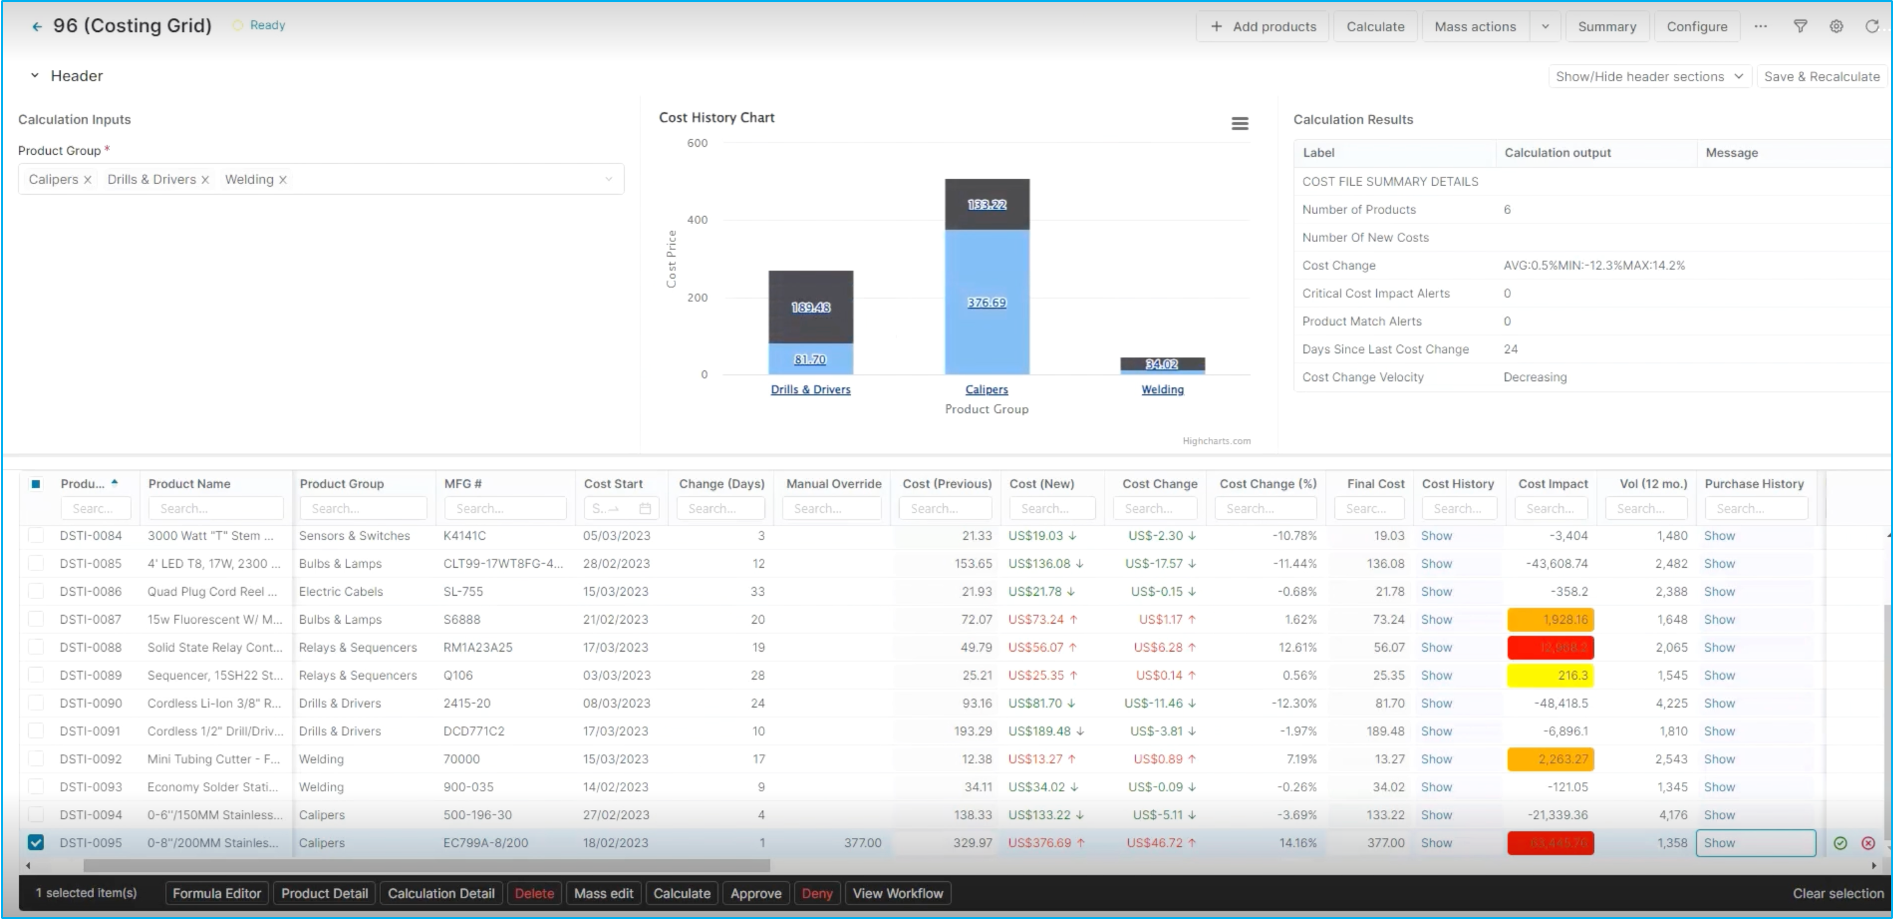
Step 5: Costing Grids
So as we go into our costing grids and as you're approving entire cost changes or you're looking at individual line items that have probably not been approved yet, you can see what the actual cost change is. You can also see if there's impact alerting. Moreover, there's quite a bit of contextual decision support, in costing history or purchase history on a product category chart allowing to vizualize the interaction between individual skews and potentially suppliers.
You can see all this information by clicking on the Show buttons.
Good to know: the Costing grids are available in Price Setting ➡️ Live Price Grids.
That is a quick overview of the flow for improved supplier cost visibility in Pricefx.
LEARN MORE: Check out how to Automate supplier costs with the help of Pricefx in the distribution industry, here.