In this case, we want to improve price realization by simulating the impact of mass price changes.
Good to know: Some of our screens may differ as we are in a demo environment.
Situation description
For this flow, we will assume the role of a pricing manager. In the current sample situation, we have limited ability to preview or simulate the impact of a pricing strategy change due to time consuming and manual processes. However, with PriceFx, simulations are automated and easy to execute. Even a configurable what if scenario workflow, resulting in improved understanding of the effects of your strategy changes and the elimination of manual errors, is as easy as 1,2,3.
Workflow
Let's take a look at a simulation in PriceFx.
Step 1: Price Setting Wizard - Calculation Type
WE will start in the Global Independent Price list which contains a mix of all of the products that are distributed. Here you can perform a simulation directly from this price list by using the price setting wizard located in the header of the price list.
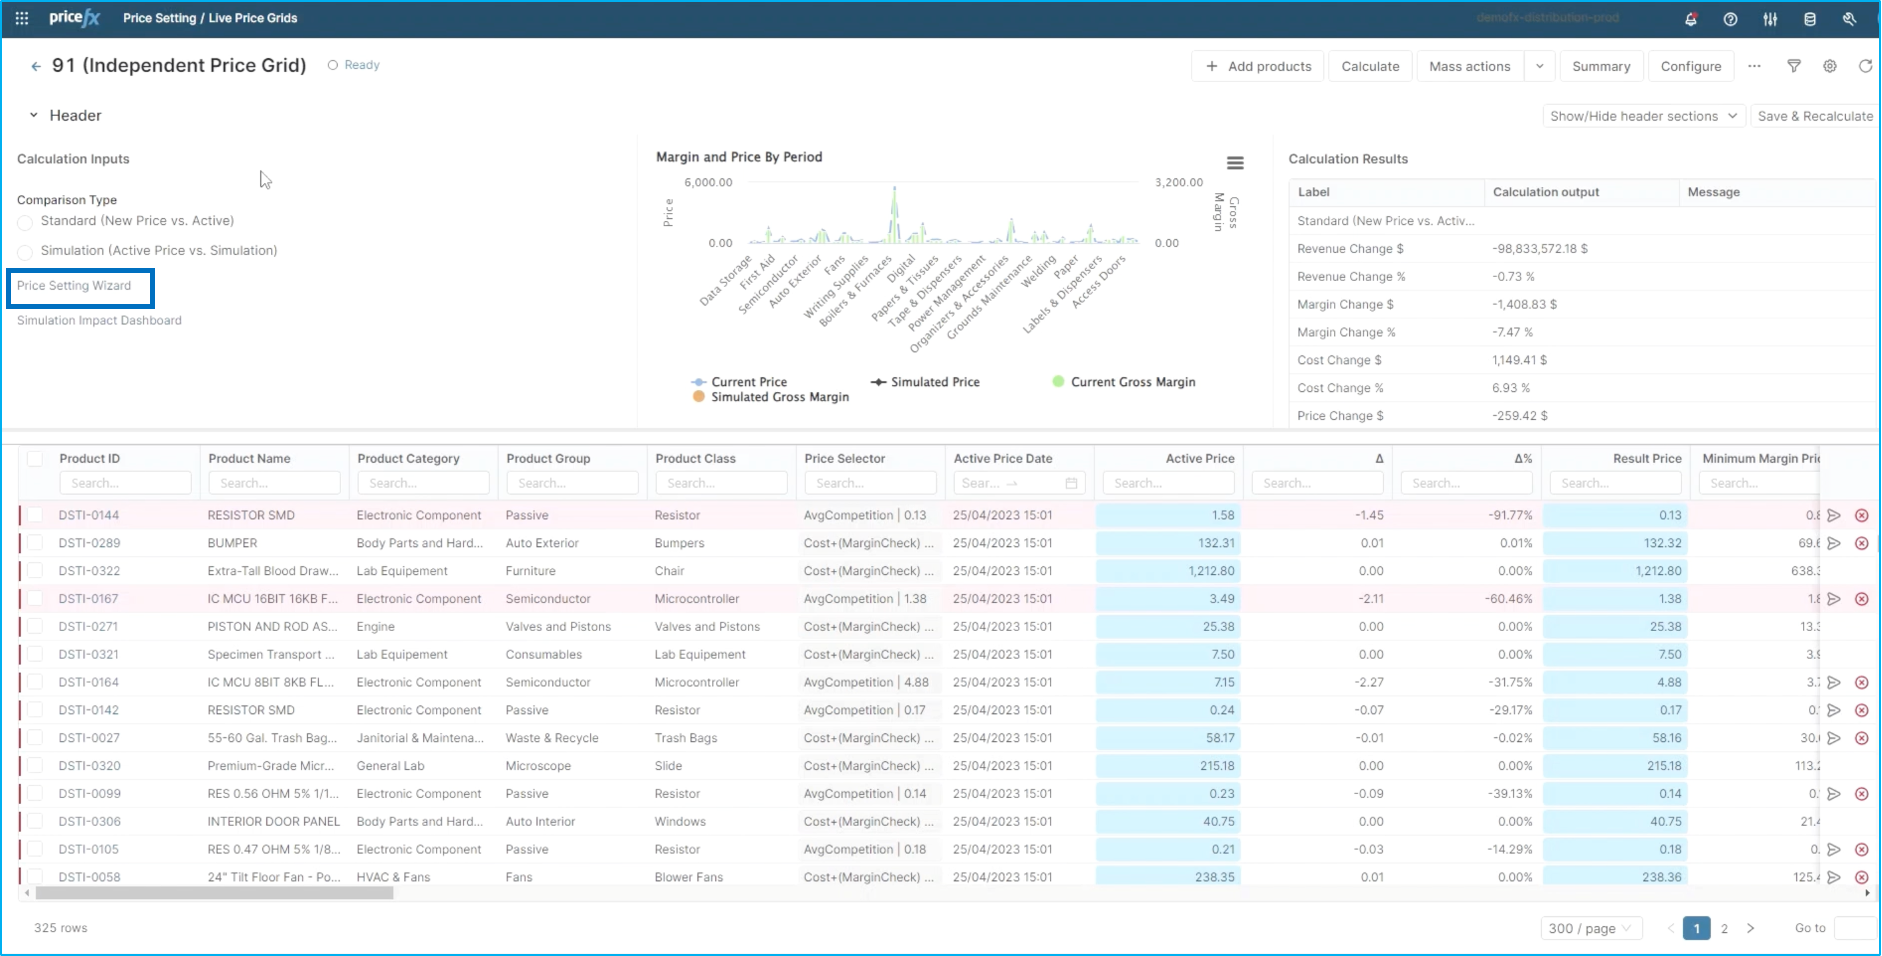
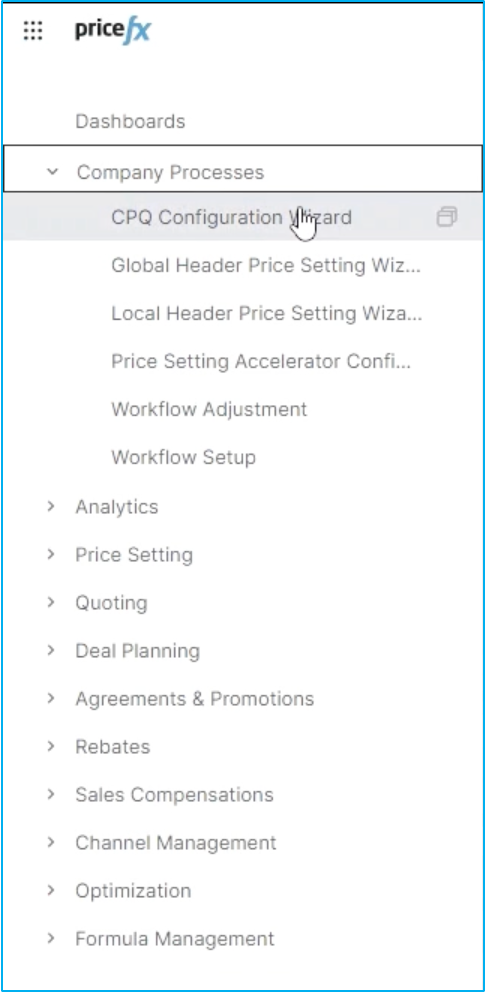
However, you can also access this wizard in the company processes in the main menu. To do so, go to Pricefx :options: ➡️ Company Processes ➡️ Configuration wizard.
By clicking on the Price Setting Wizard, you will be guided through a step by step process to run this simulation.
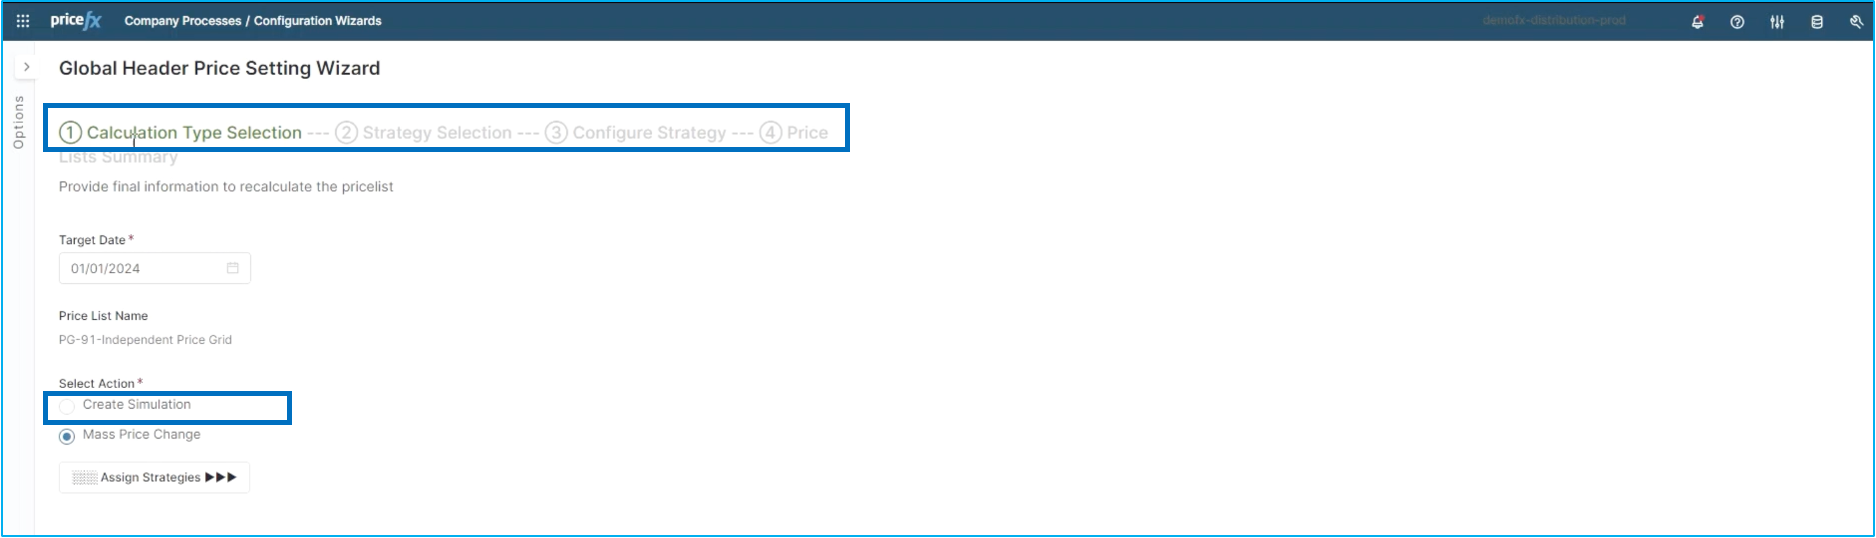
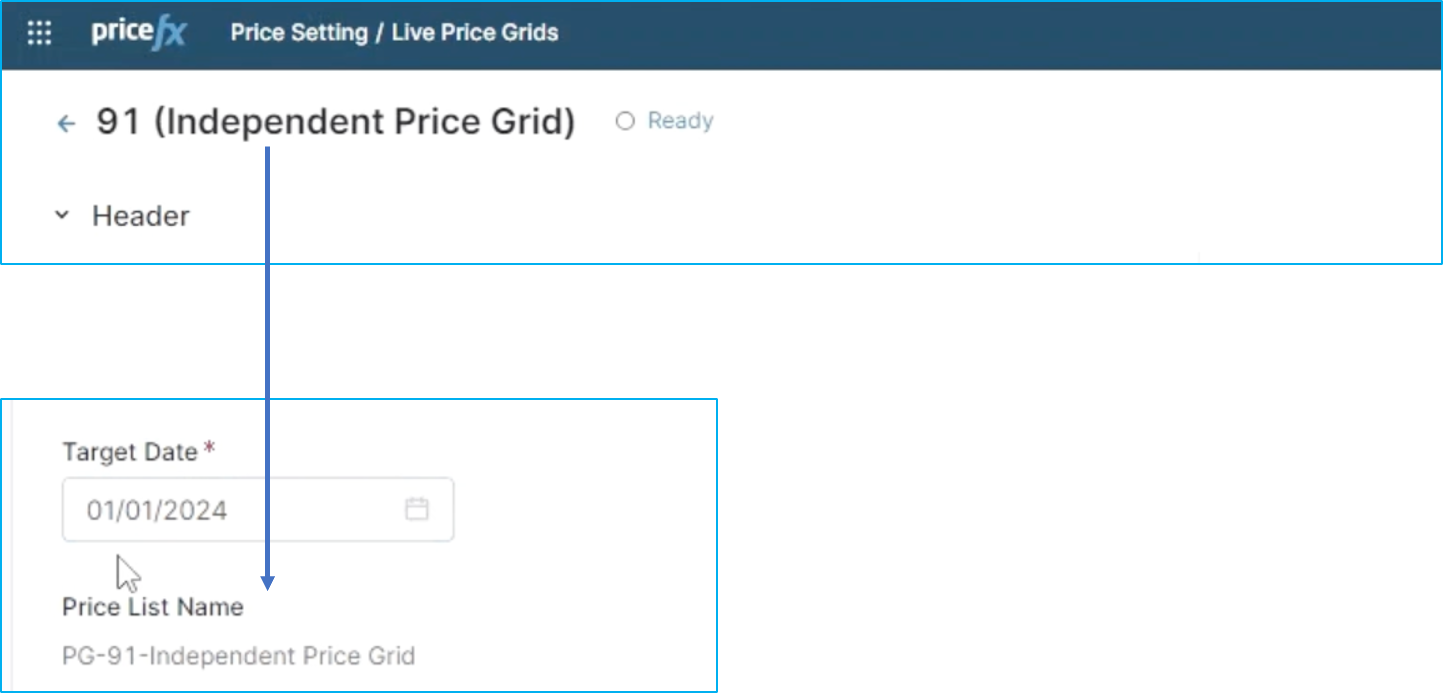
You can choose a target date for the simulation to take effect. In this instance we will select January 1st, 2024.
You can see that the simulation is happening on that independent Price Grid you have seen at the beginning of the flow.
Click on Adjust Strategies, to move on to the next step.
Step 2: Strategy Selection
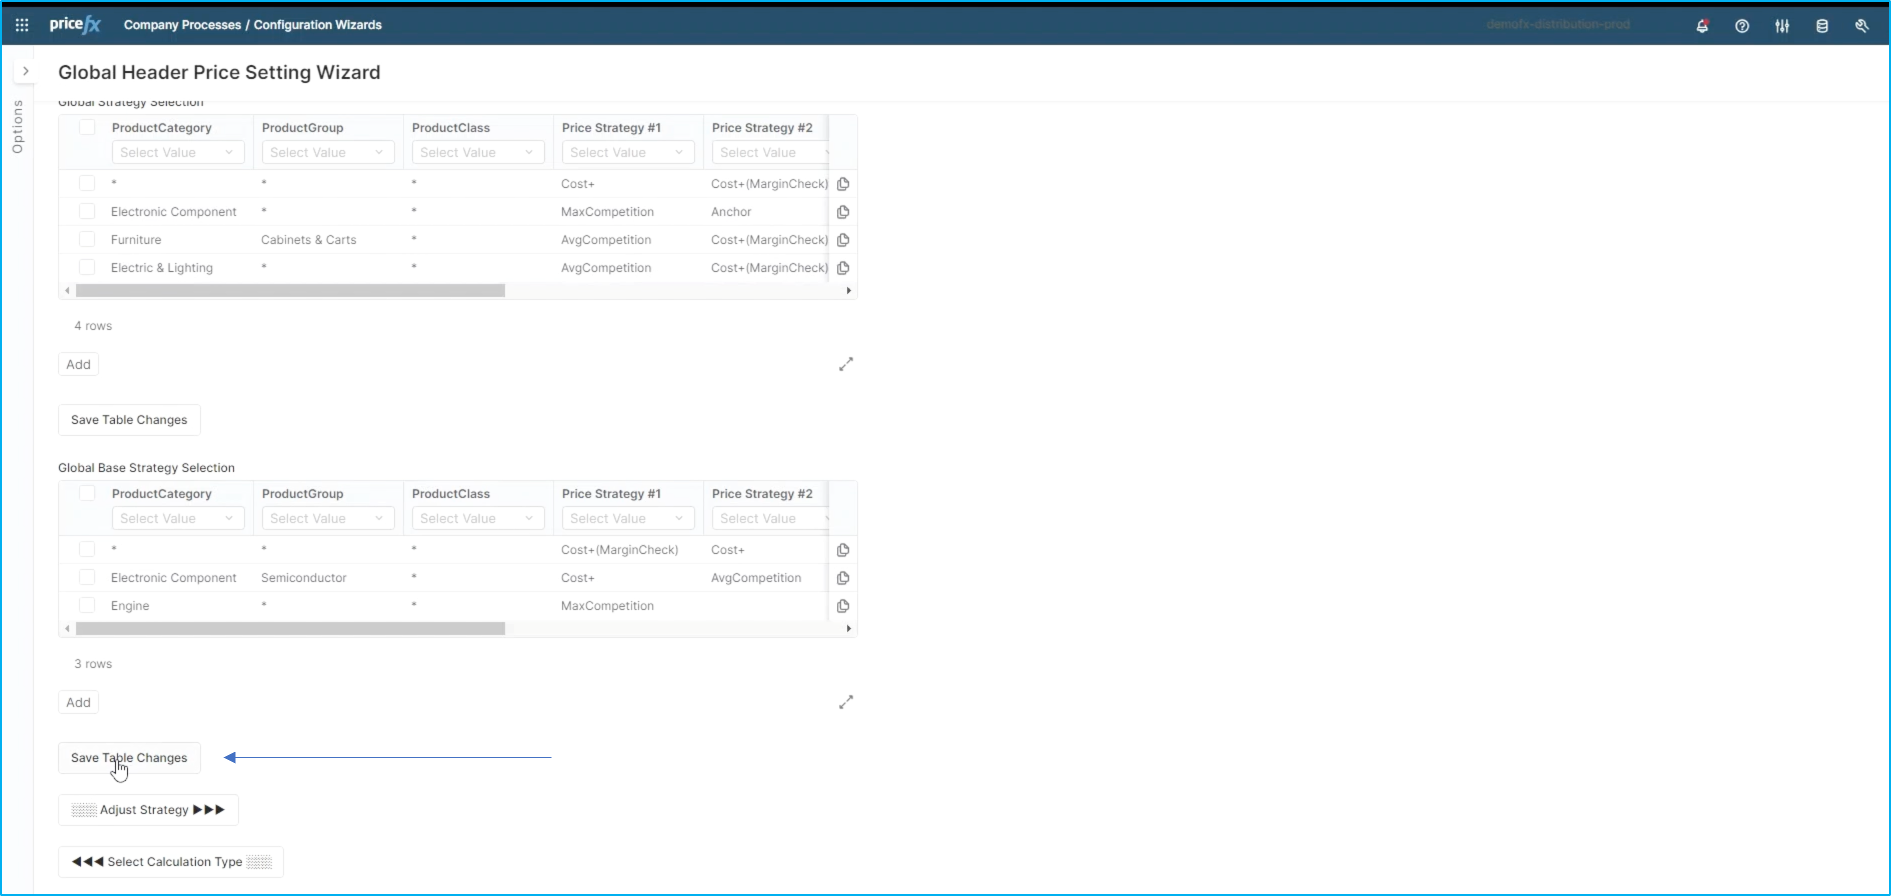
In this step you can choose your new pricing strategies. You can see here I have my global strategies in a table for this simulation.
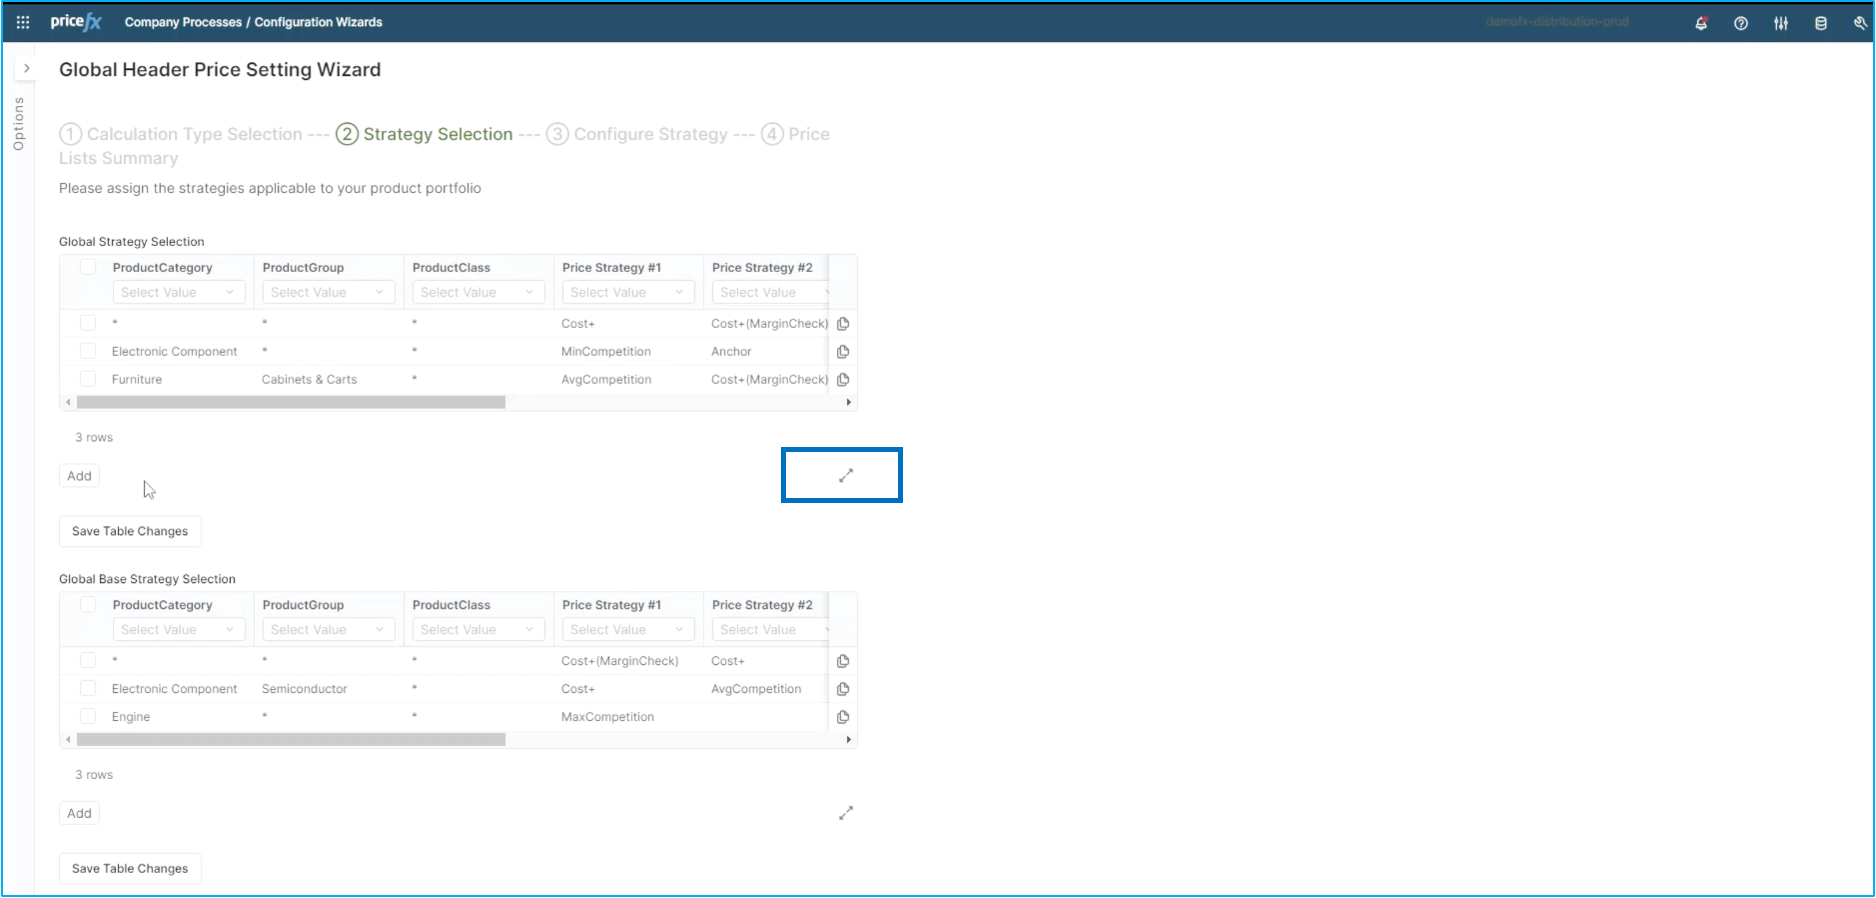
If you click on the expand button, you will get a detailed table containing your existing strategies and products. We will employ a 2-step process in this scenario: we will add a product category for this, and make a change to one of the strategies that already exists.
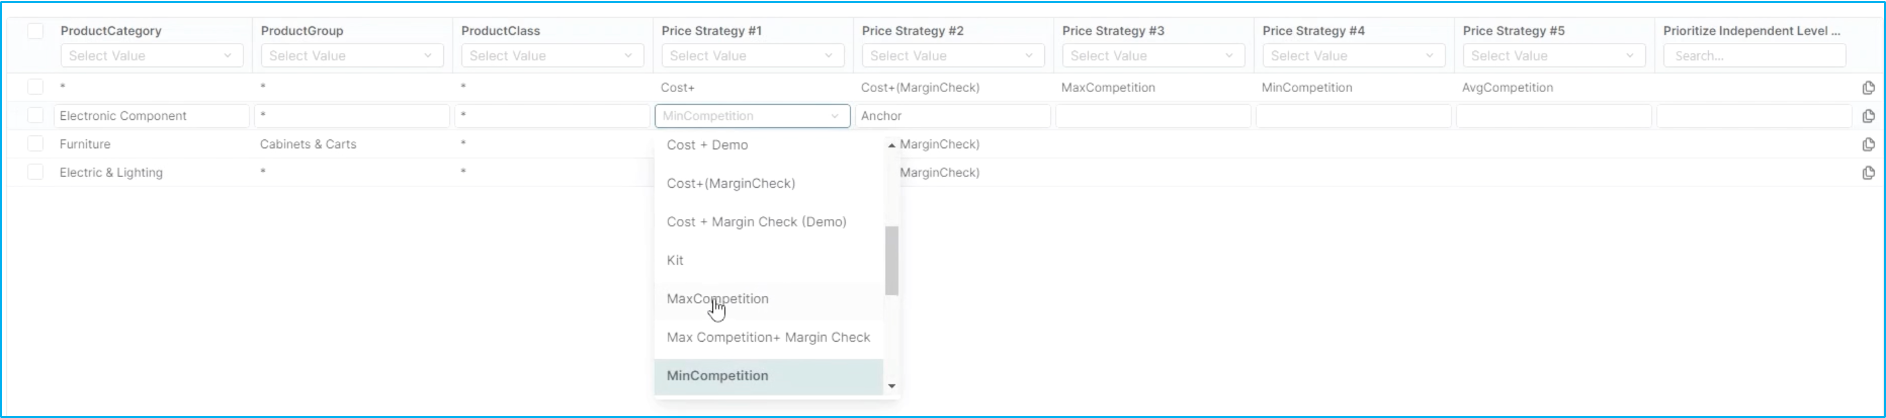
Let's first add a category. Click on Add in the bottom right corner. Using this drop down menu, you can choose the category you want to add a pricing strategy for. In this case, we will add a strategy for Electric and Lighting.
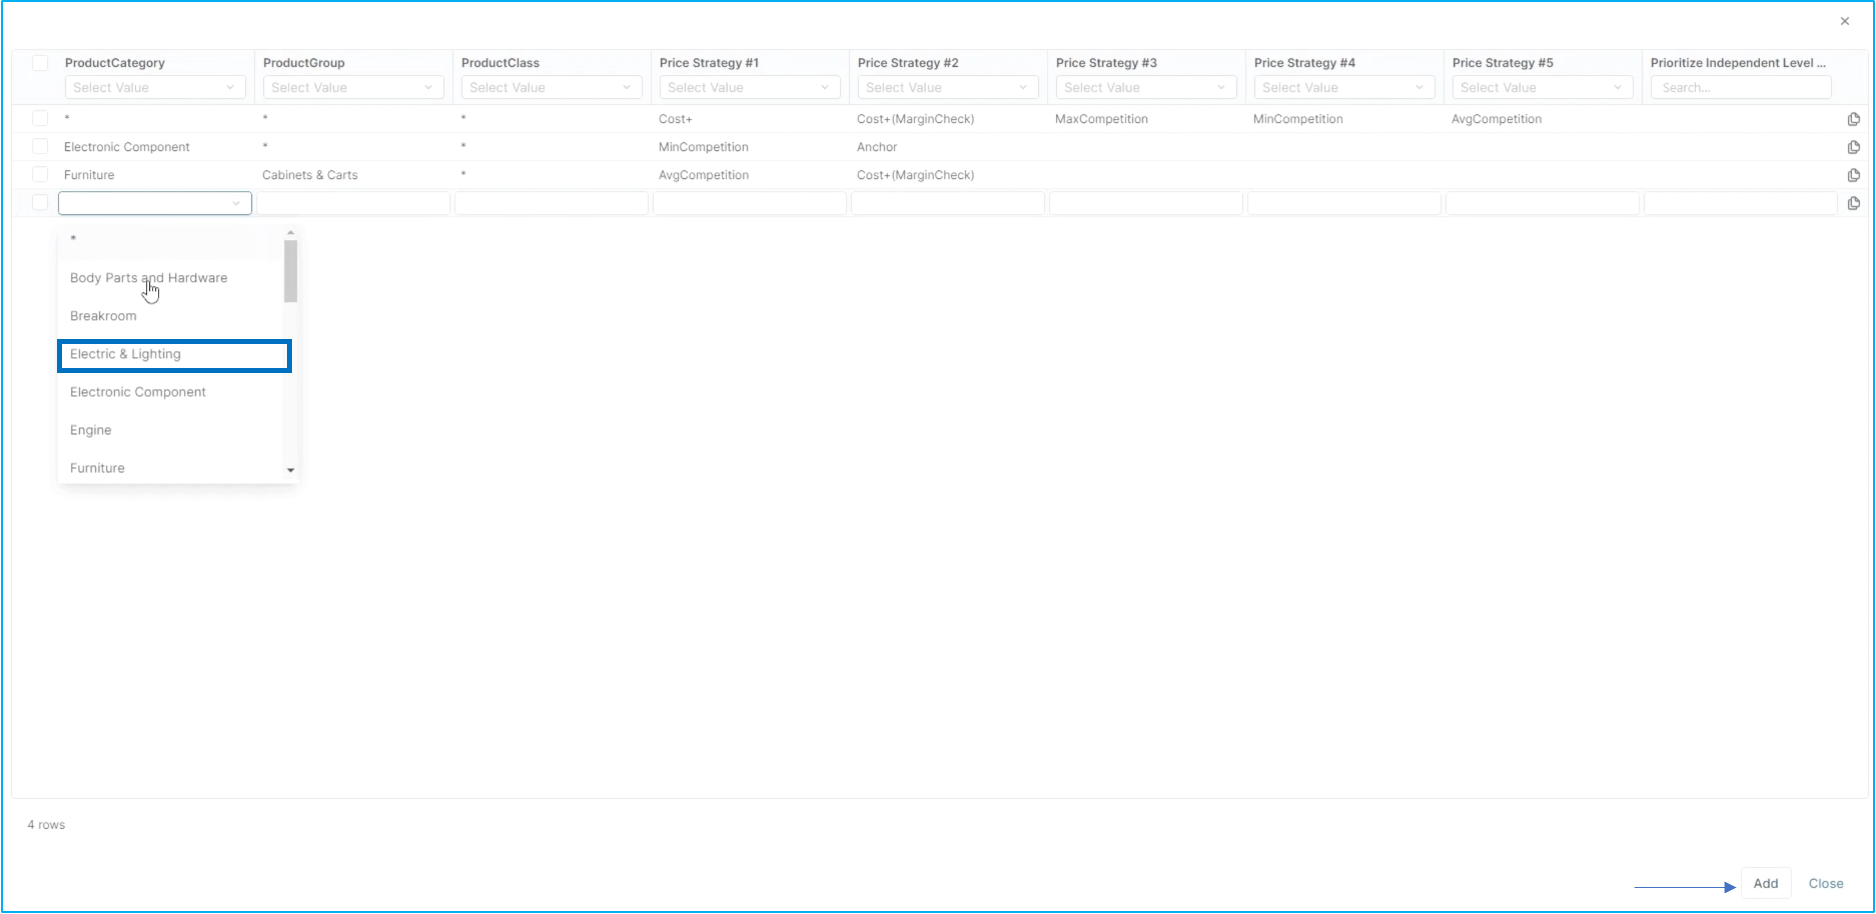
For this use case, we will use the strategy for all products in the group and all product classes. To select all, click on the ✴️ in the drop down menus.
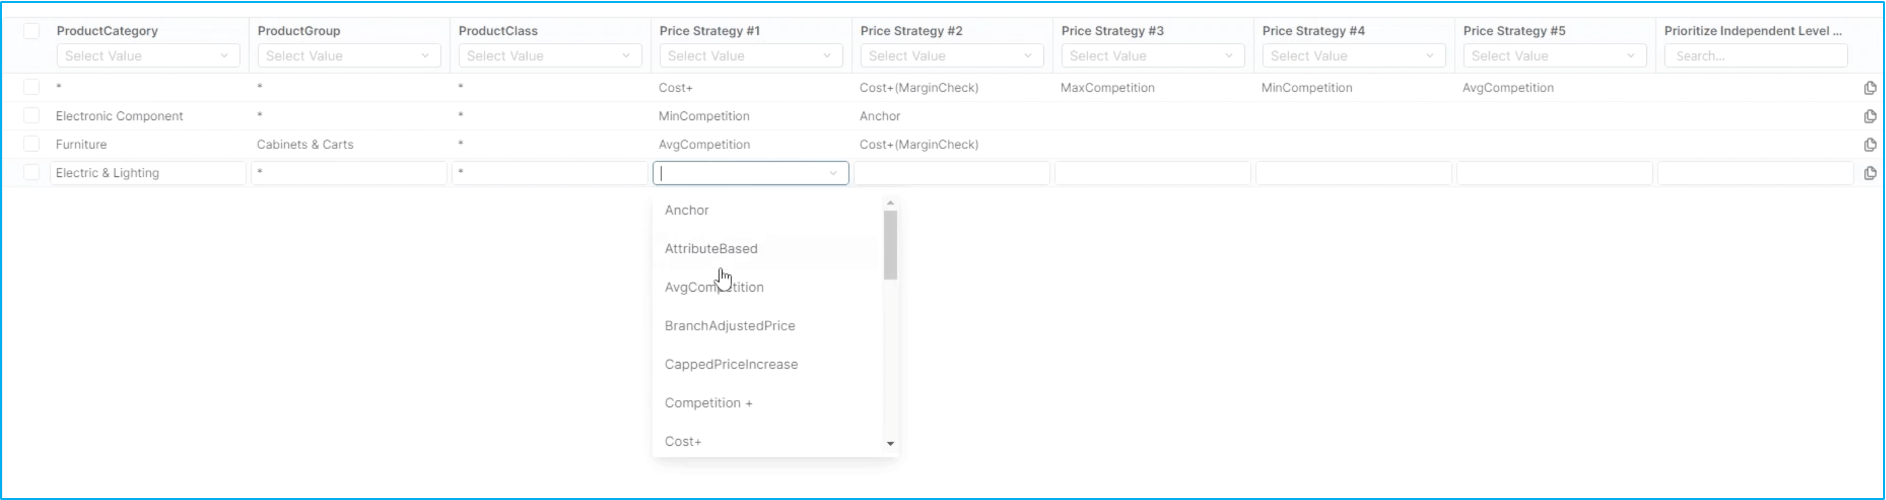
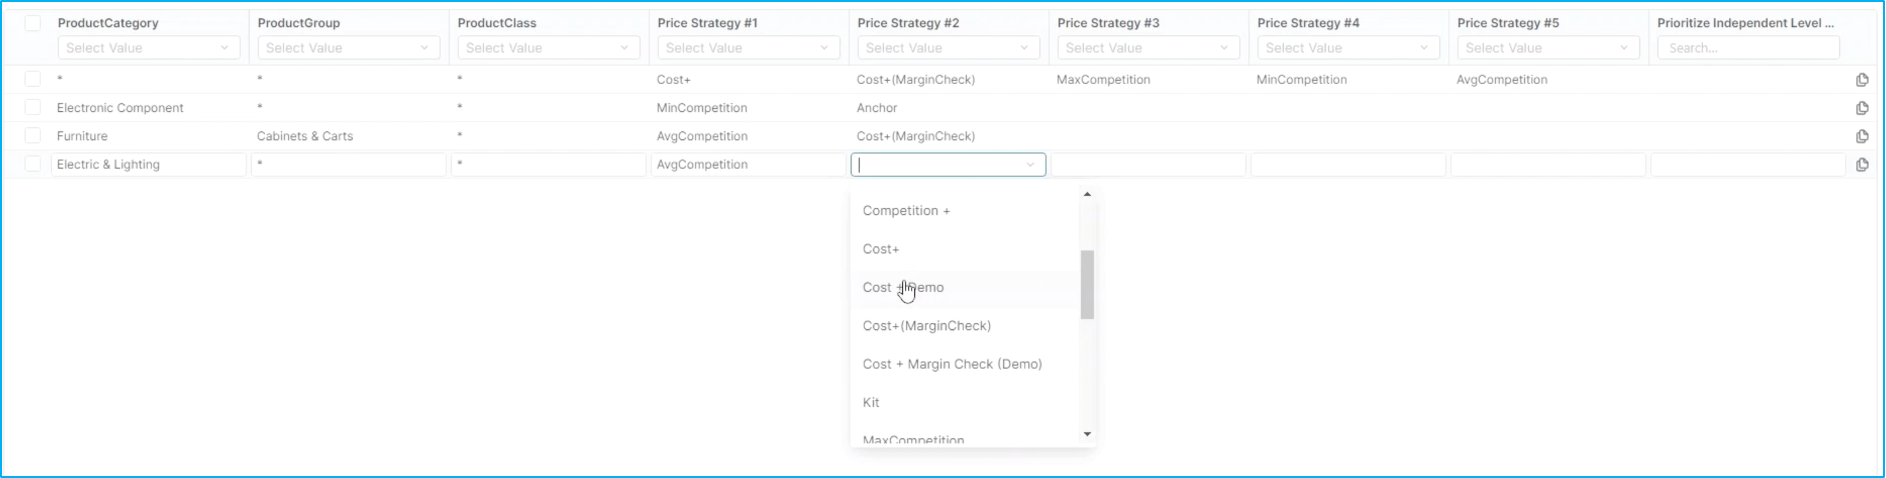
In the current setup, Electric and lighting would be rolling up to a cost plus strategy, which is the overall strategy for this price list. In this instance, we will select an average competition strategy for Electric and Lighting with a secondary strategy of Cost+ Margin. What this means is that if there is no competition data loaded, it will use the cost+ margin check. You can also see that the electronic components are using a min. competition as their number one strategy. We are going to change that to maximum competition and simulate it to see what could be the overall effects.
We will now click on Close in the bottom right corner and return to step 2. Once you've completed the strategy changes, simply click Save Table Changes and everything that’s been done is saved as a new table.
Step 3: Configure Strategy
Following the previous step, we will click on Adjust Strategy which will take us to step three of the configuration.
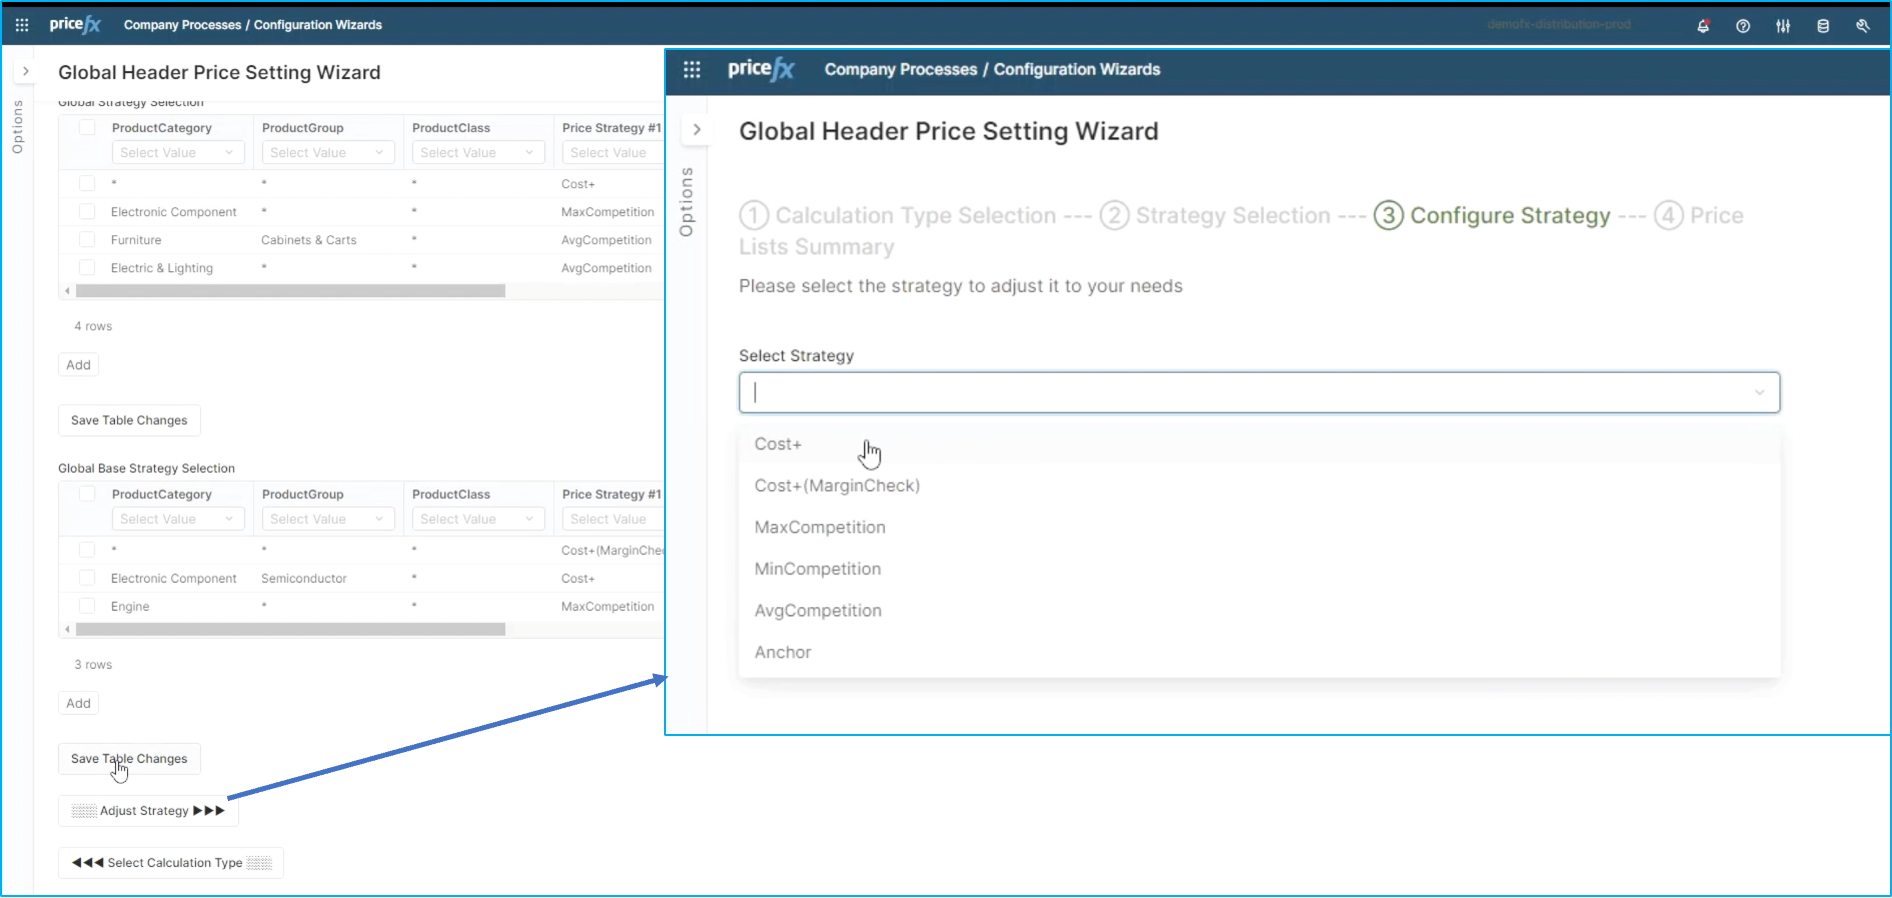
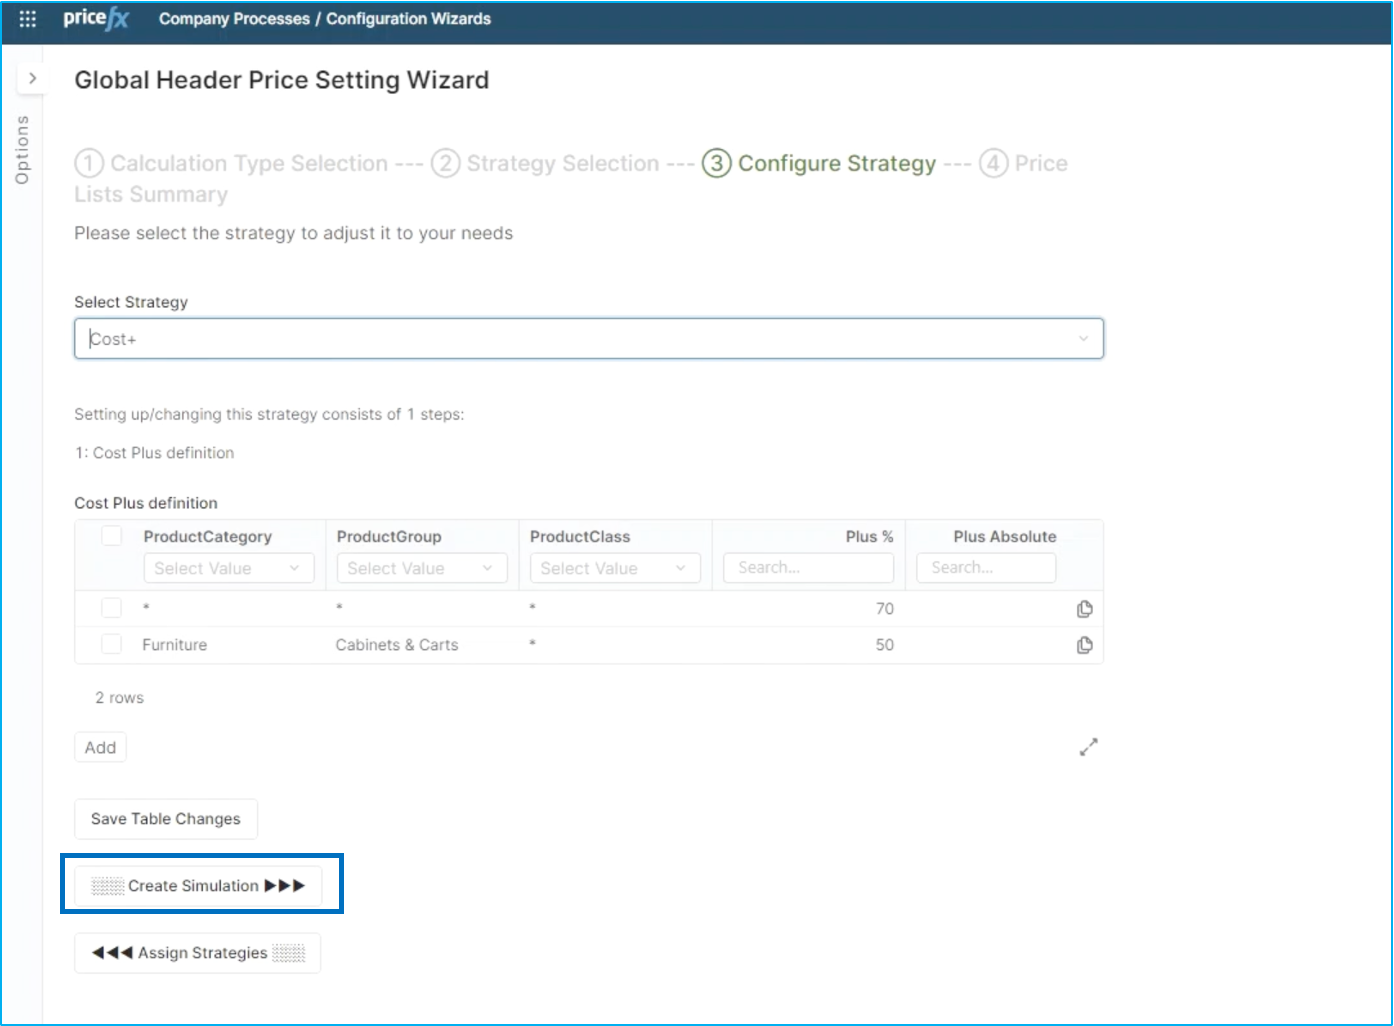
Once you are here, you can make changes to newly created or any of the other strategies you have already loaded. In this use case, we are going to change the cost+ strategy.
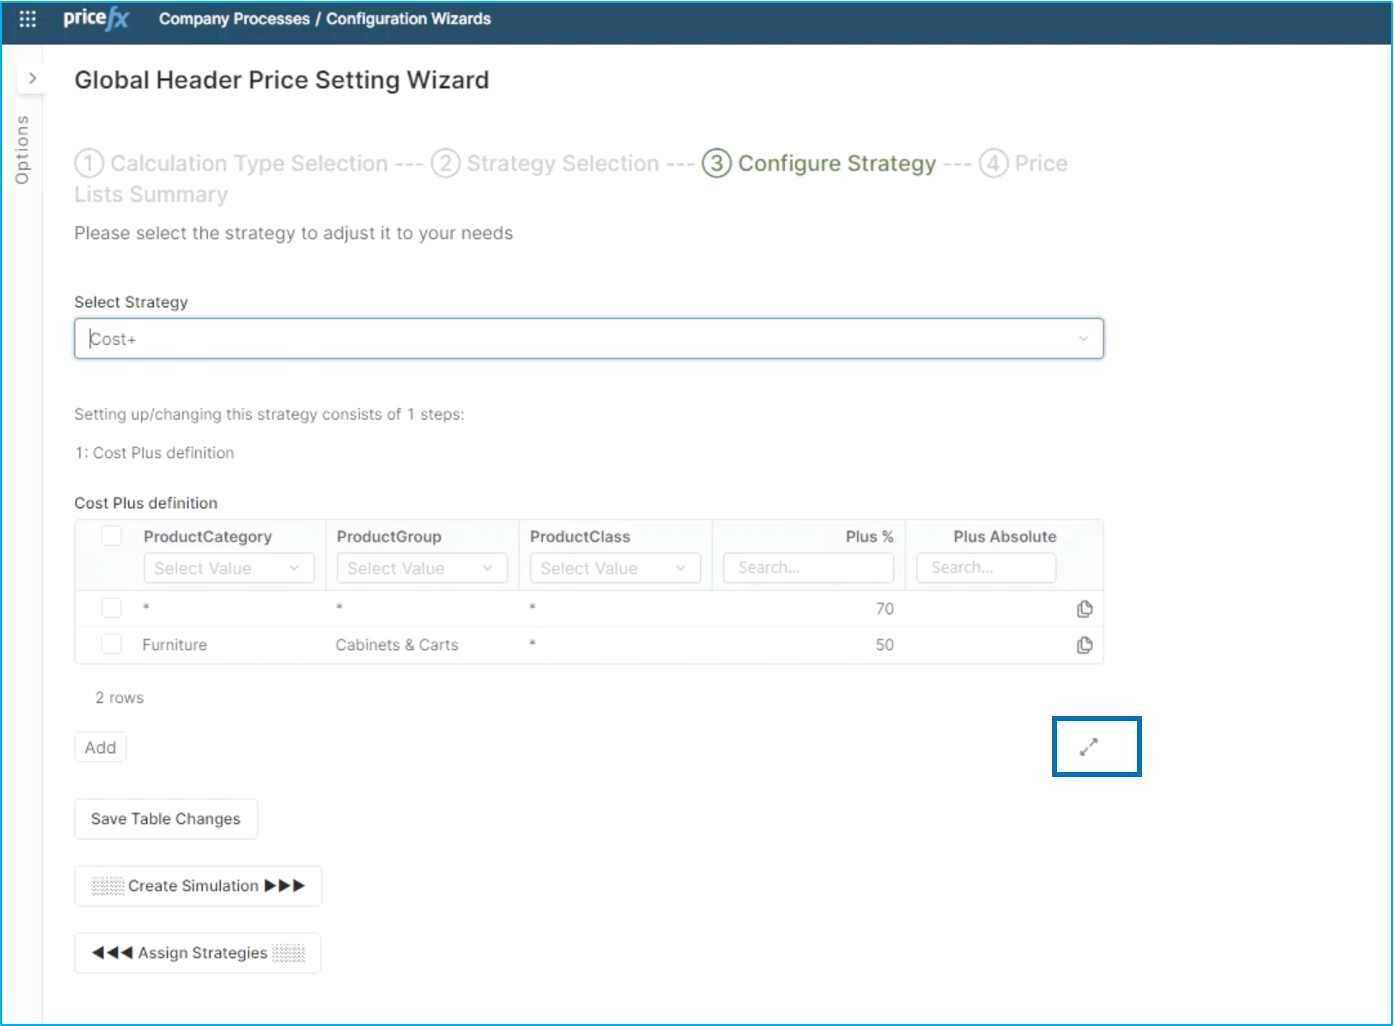
You can see here that another table was populated. In this instance, we have the overall strategy at 70% margin and we have furniture at 50%. We are going to add another strategy for Electric and Lighting, again using the wild cards for product group and product class, and will consider that we’d only want to have a 25% margin on this product category. We will also change the overarching strategy from 70 to 60 as 70 is just too much for this market. We can now close this table.
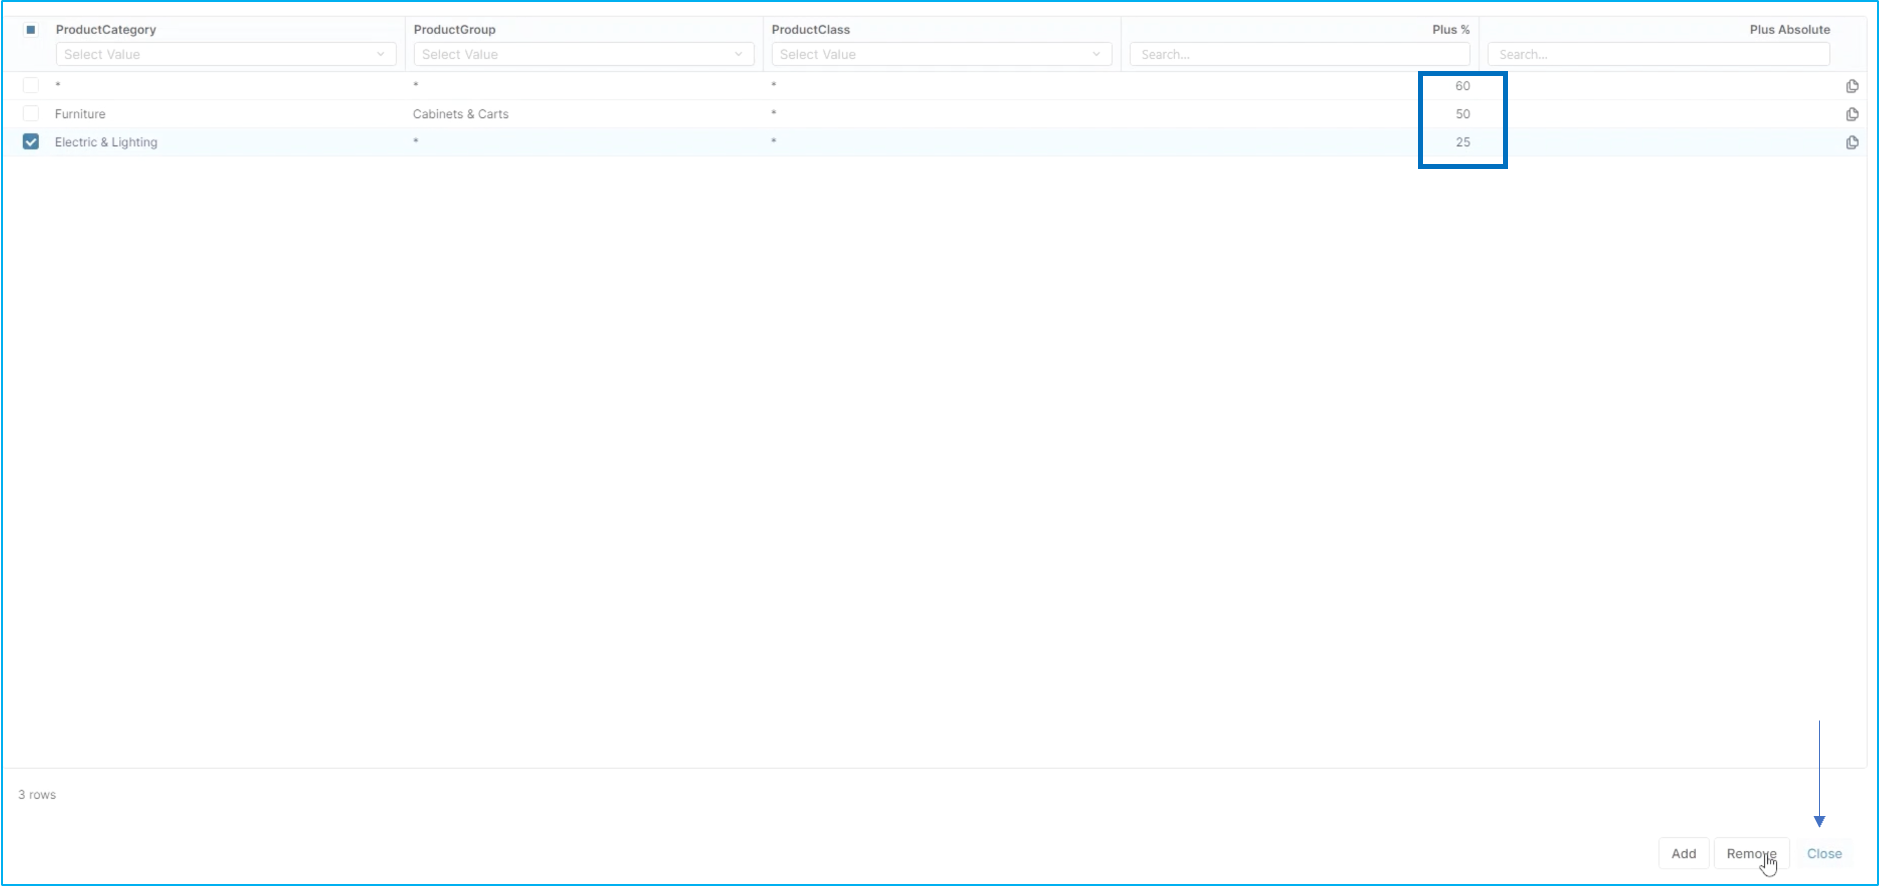
Good to know: Remember that the changes will be saved only when you use the Save Table Changes button in the previous dialog window.
Once the changes have been saved, you can go ahead and create the simulation. Pricefx is going to run through all of the parts within those categories and create a simulation.
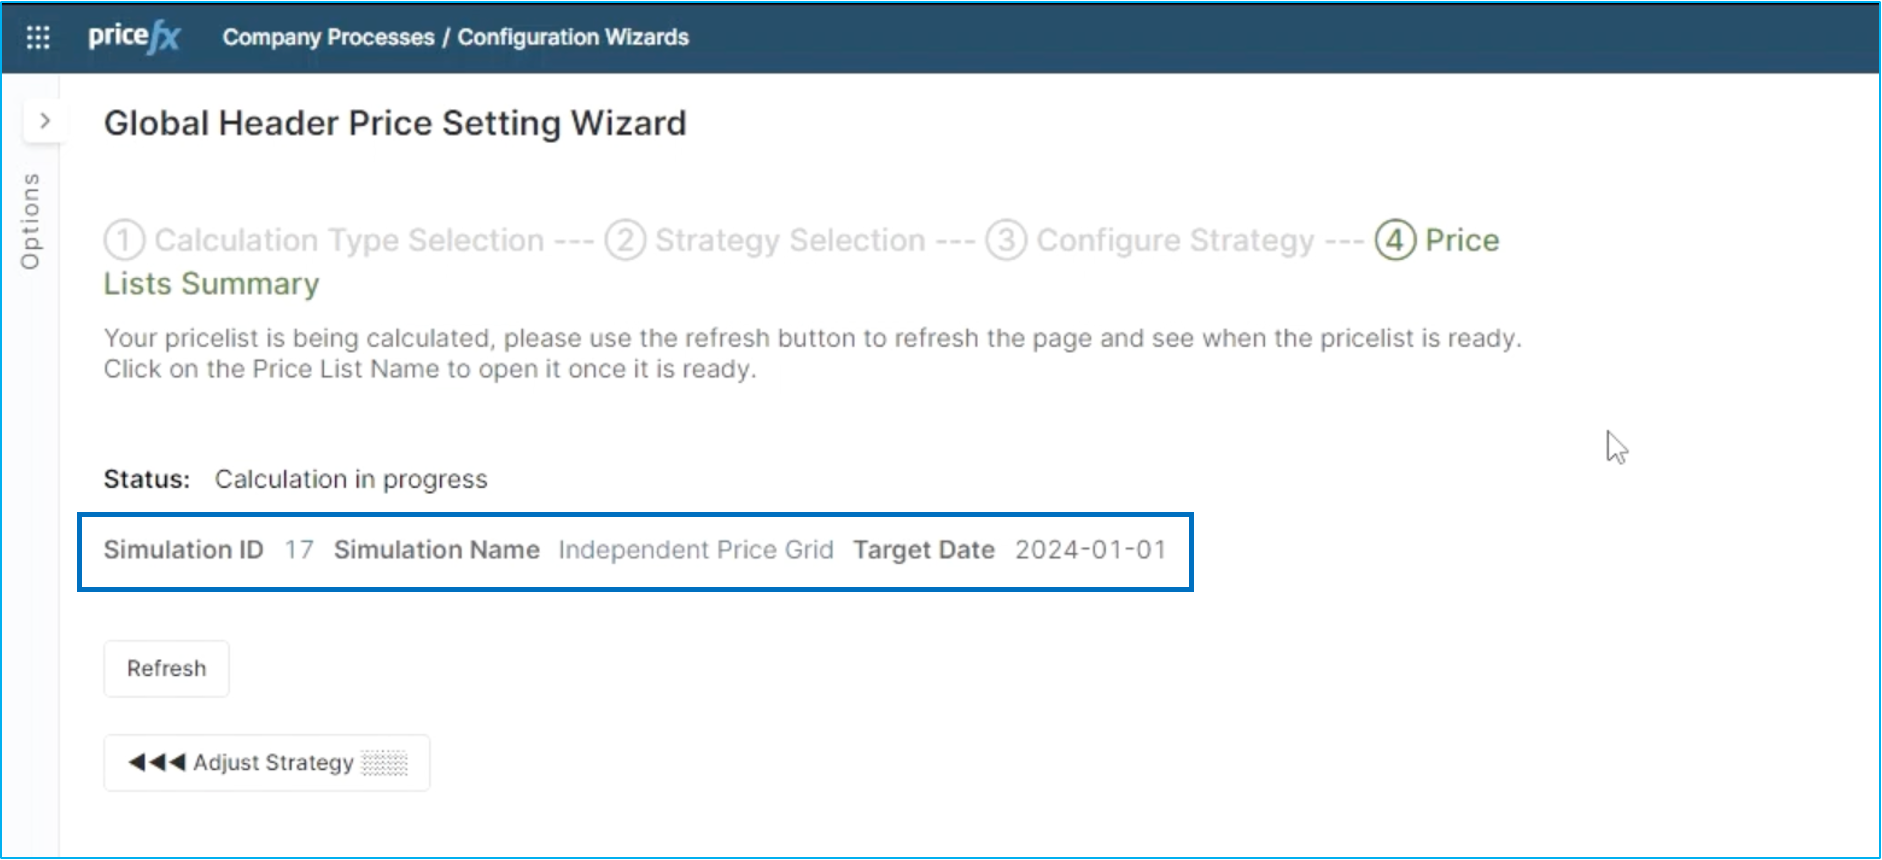
In this instance, the simulation ID is going to be #17. The name is going to be Independent Price Grid, and we can see here that the target date is also here.
Step 4: Price
Moving on to the next step, Price list summary. You can see that the calculation is in progress. (see screen above). This status will remain in progress until the simulation has completed. Once finished, the status of the simulation will change to ready.
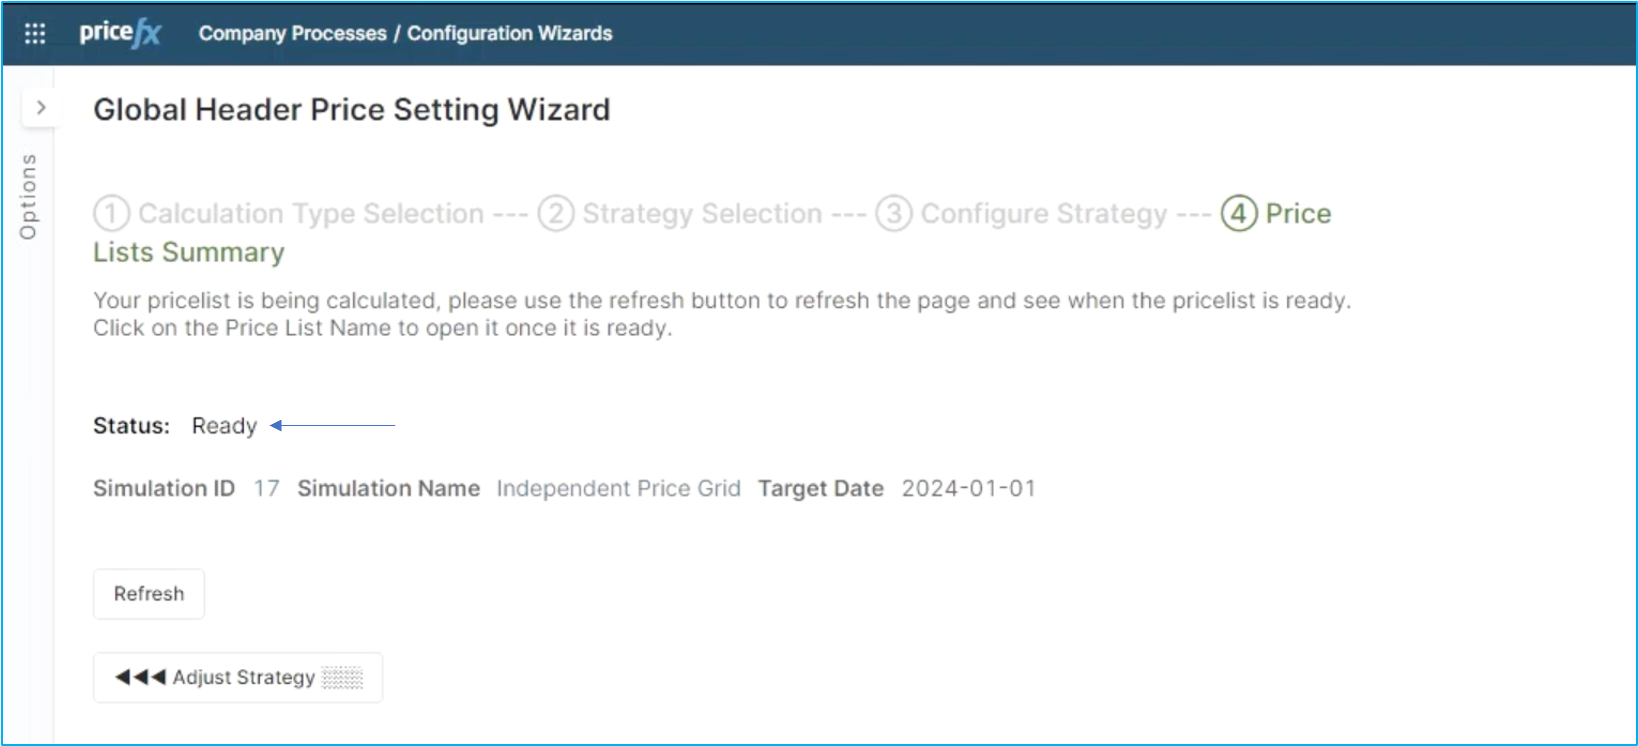
You can enter your simulation by using the hyperlinks, or by accessing them through the Price Setting Simulation list. In this case you can see that we have a part by part simulation with previous price and result price, meaning our new price and the deltas between the two. You can see here that many of these had a very large change in margin, based on the strategies that we picked.
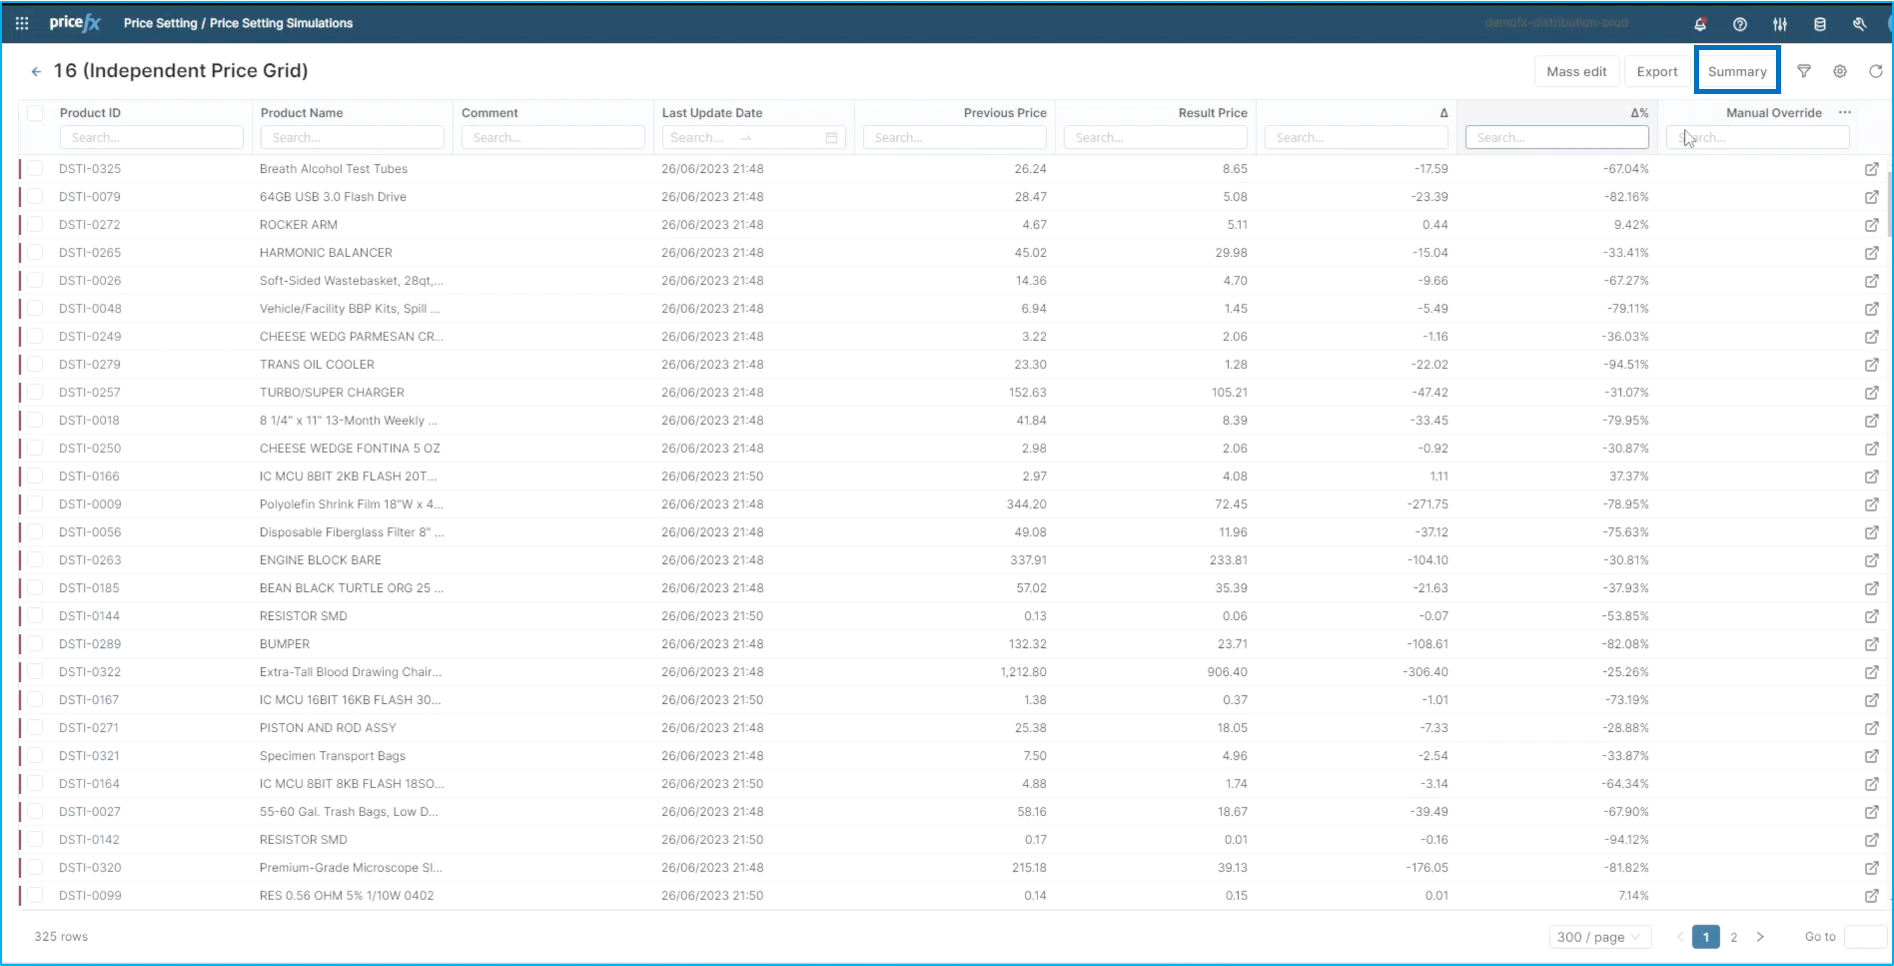
If you prefer a more global view, there is a summary tab in the upper right corner which brings you to an overall summary of your price list. And can be sorted by different categories using the filters in the left side menu. Once you've chosen the filters you want, you simply calculate (refresh button in the upper right corner) and you get a summary overview of that price list.
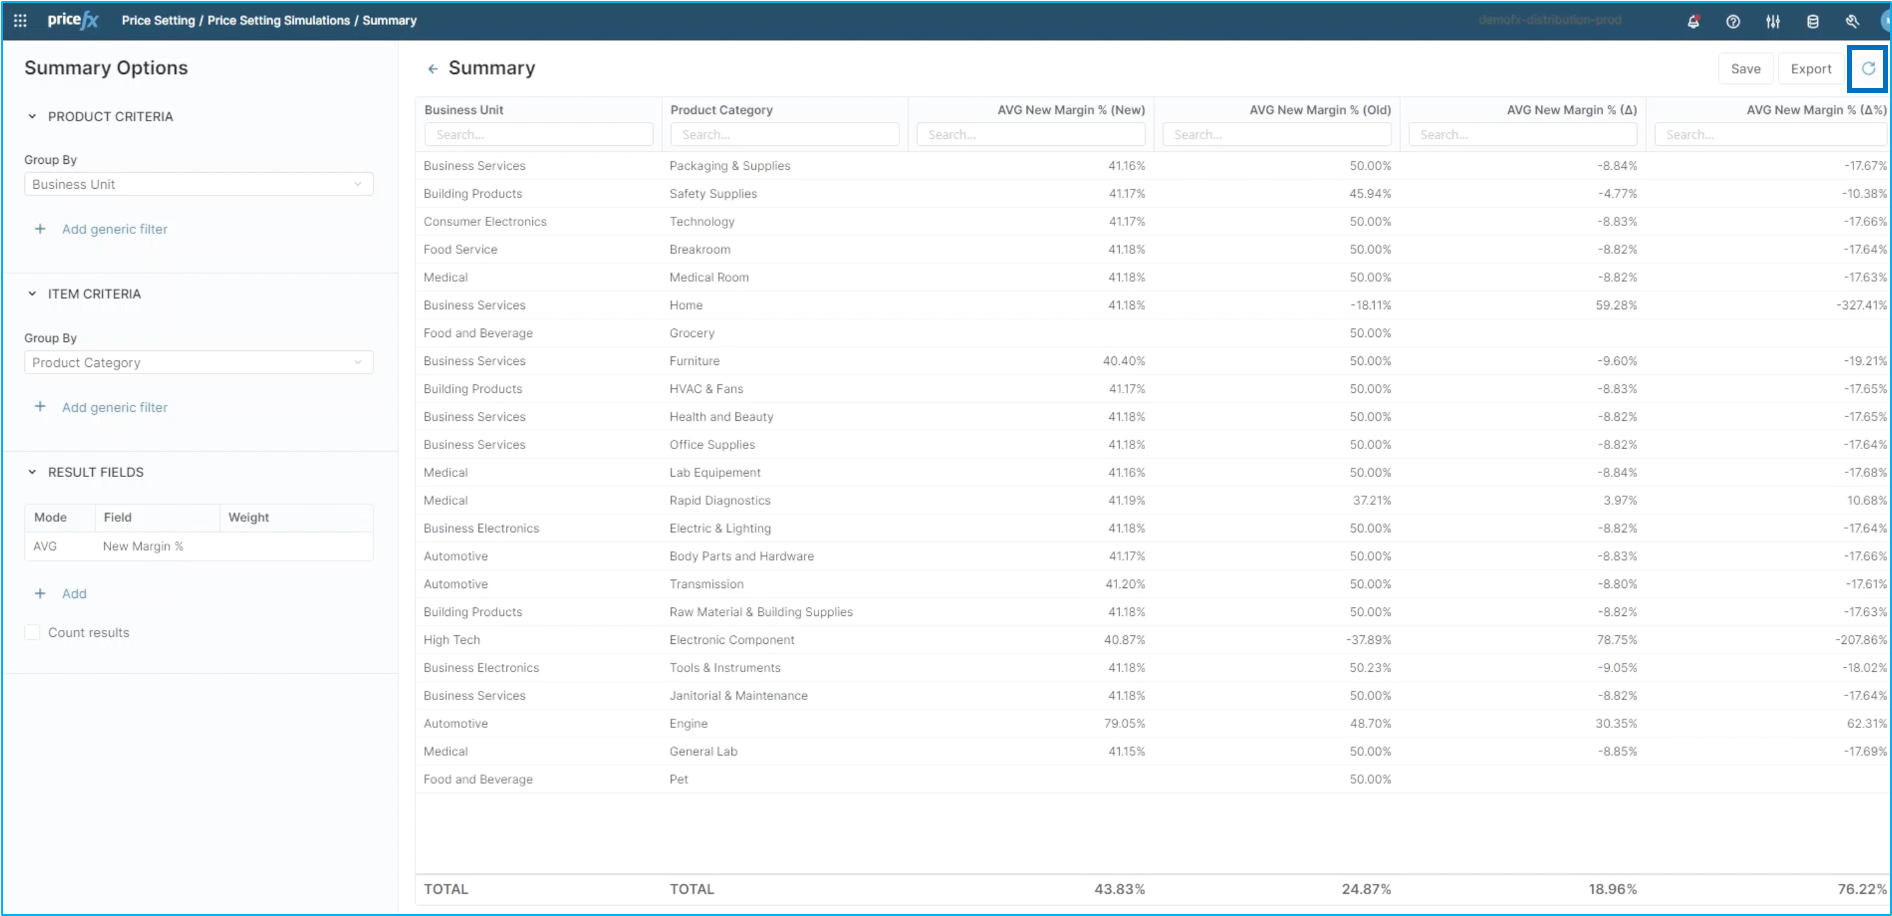
For this scenario, we've broken it down by business unit. You can see the average new margin of the simulation versus the old average margin from the original price list. Additional to this summary, we also have a piece of analytics that goes with our price list simulations.
Step 5: Simulation Impact Dashboard
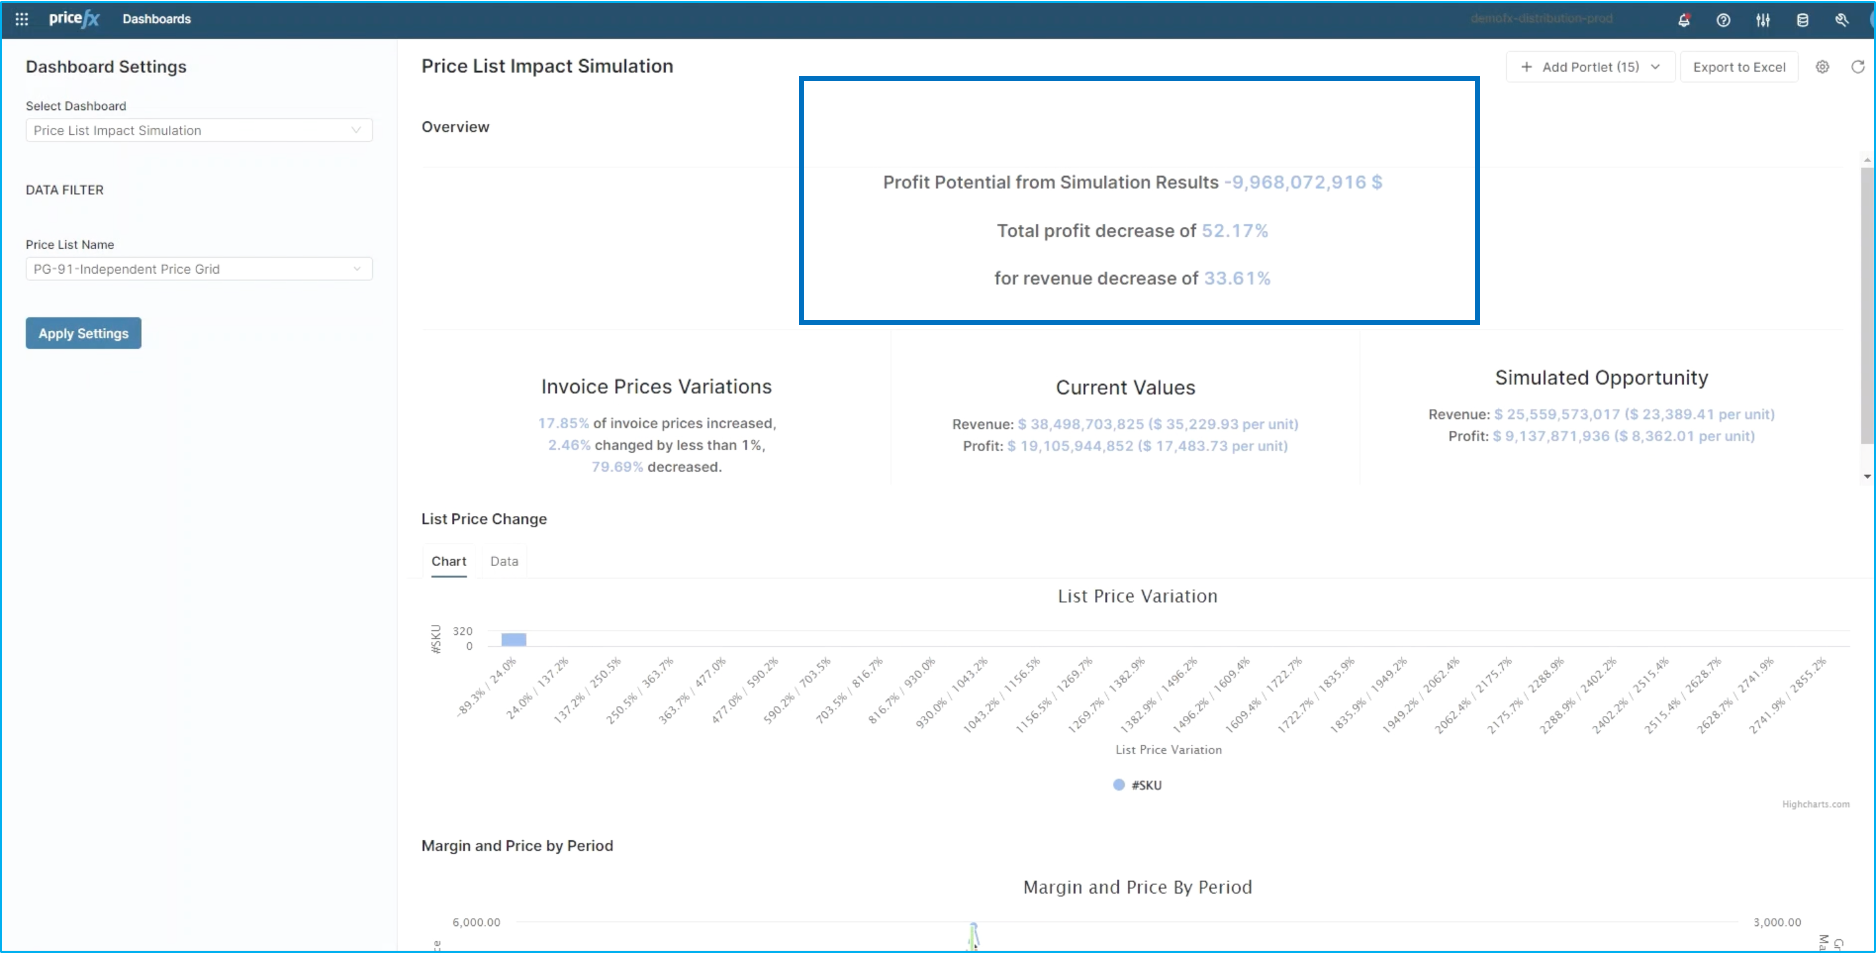
If you return to the header of your price list, you'll see a Simulation Impact Dashboard inder the Price Setting Wizard. By clicking on it, the system will display some key information about the simulation. You can pick the simulated price list, in this scenario #91, and apply the settings to it. From this piece of analytics, you're able to see total impact of the strategy changes at a very high level. In this case, there is a negative $9 million in profit. By decreasing the profit by 52% our revenue is going to decrease by 33%. This is giving an indication that there might be necessary to rerun the simulation and consider other strategy changes.
Simulations are simple in Pricefx and can be configured to make adjustments to strategies and margin rules at the same time. This concludes the complete flow for price setting strategy simulation in PriceFx.