PriceFx Plasma is the only KPIs and benchmarking platform for price and margin management teams. In this case, we want to track the internal strategy and process improvement performance on a regular basis as well as benchmark the company against best in class organizations in the industry around the same metrics.
Good to know: Some of our screens may be different as we are in a demo environment.
LEARN MORE: To know how Plasma can benefit your business and all the KPIs it provides, click here.
Good to know: Plasma relies heavily on your existing data. To know how to get the best quality data, check our data readiness methodology here.
Situation description
For this scenario we will take the role of a pricing director at a large global distributor. In the current state, we have a limited ability to support change management processes in regard to pricing strategy, policy and process changes. With Pricefx however, teams can be agents for change management with visibility and progress and on internal KPIs and best in class benchmarking resulting in programmatic, quantifiable results achieved through an investment in pricing software.
Workflow
Let's see how we can track ongoing strategy and process improvements with Pricefx ➡️ Plasma KPIs and benchmarking.
Step 1: Pricefx Plasma - Executive summary
We will start on our Pricefx homepage where you can see we have quite extensive capabilities around analytics including out-of-the-box dashboards, configured analytics and more.
For now, let's focus on PriceFx Plasma. We'll actually open up the executive summary. Now looking at the executive summary, which we'll come back to in a minute, we can see that there are a variety of KPI's that focus on margin and process.
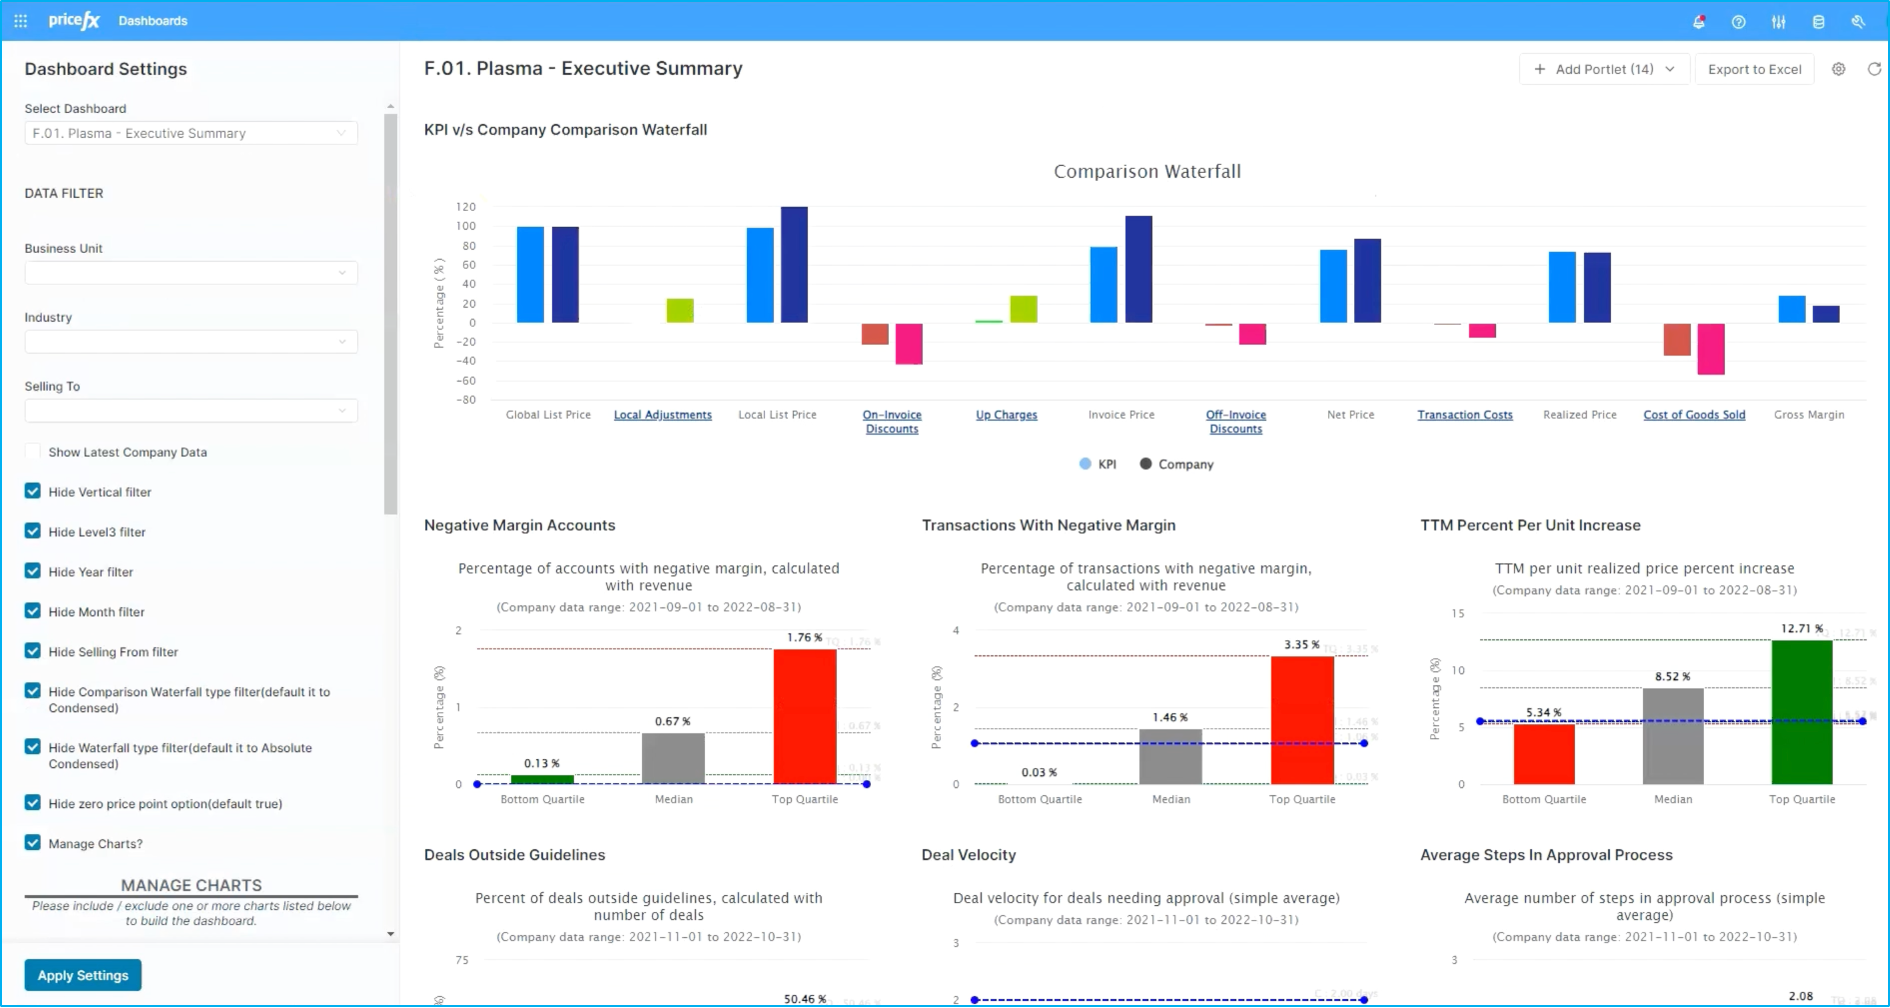
These can be divided out into a couple of sub dashboards focusing on planning or business metrics, things like revenue and accounts.
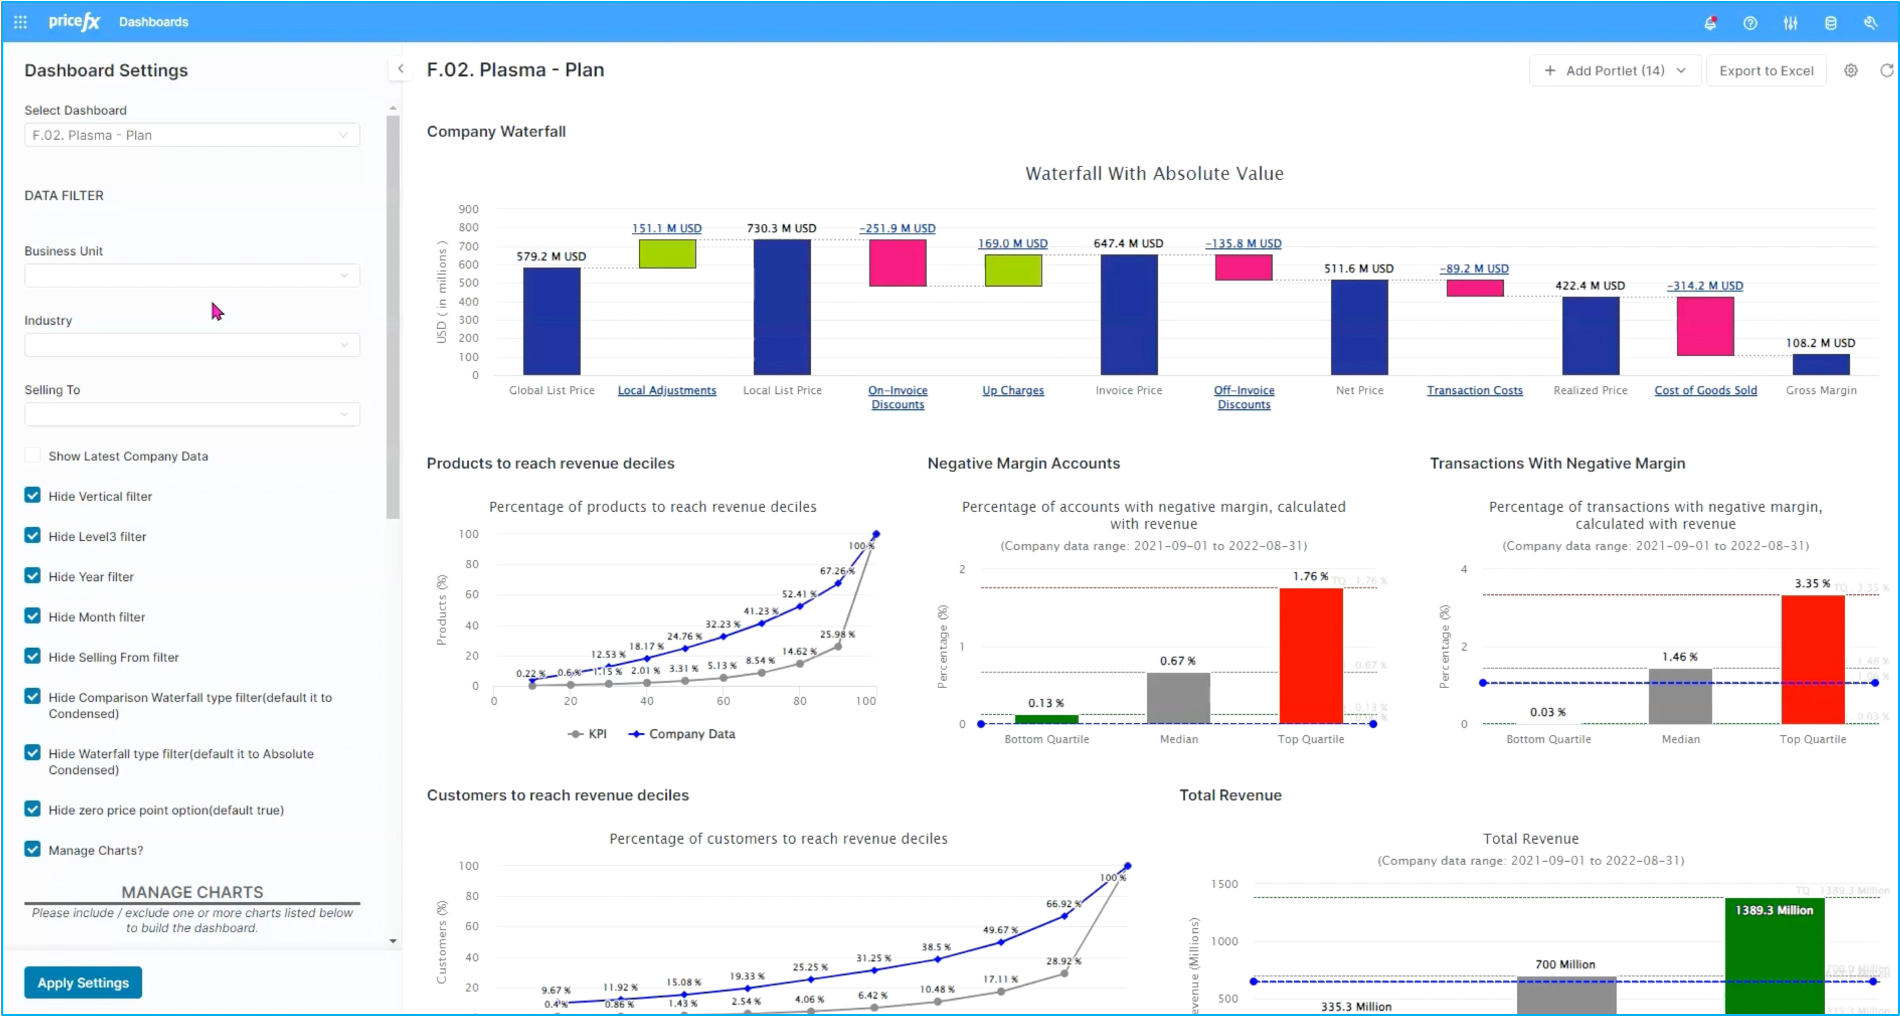
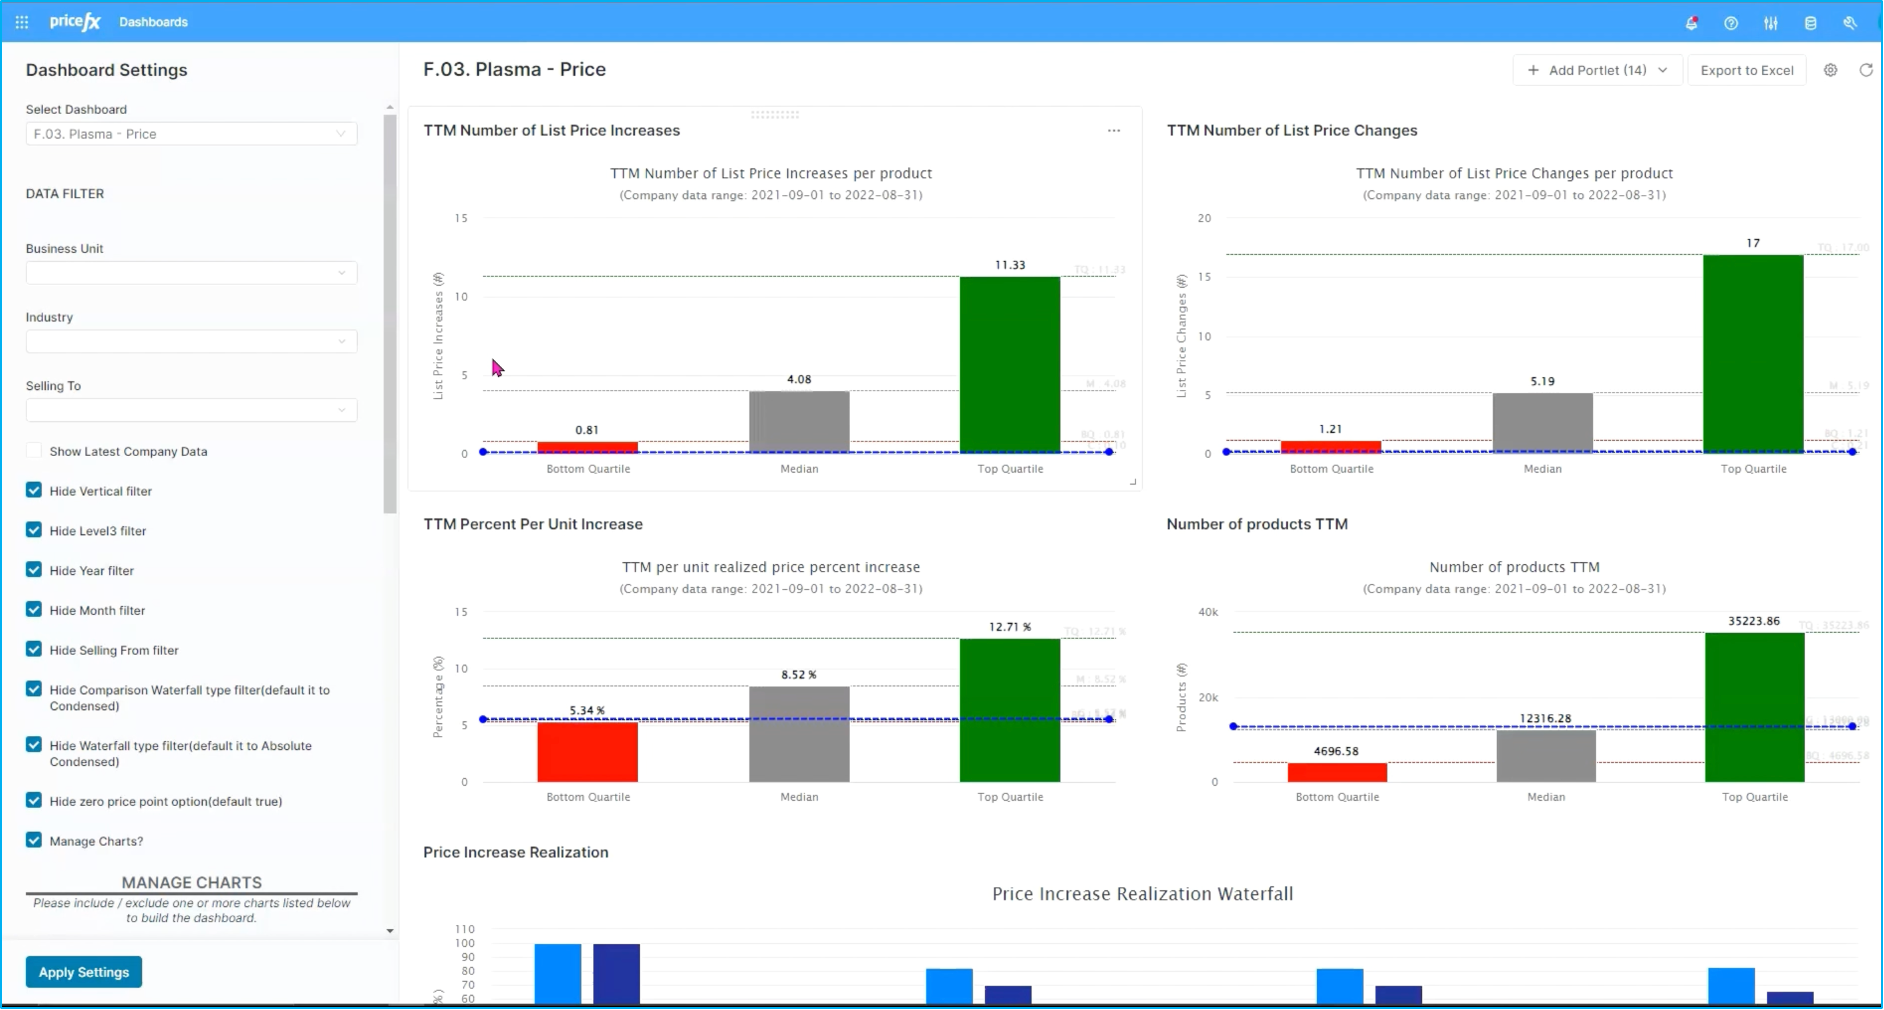
We can focus more on price which highlights things like strategic pricing such as list price changes and price increase realization.
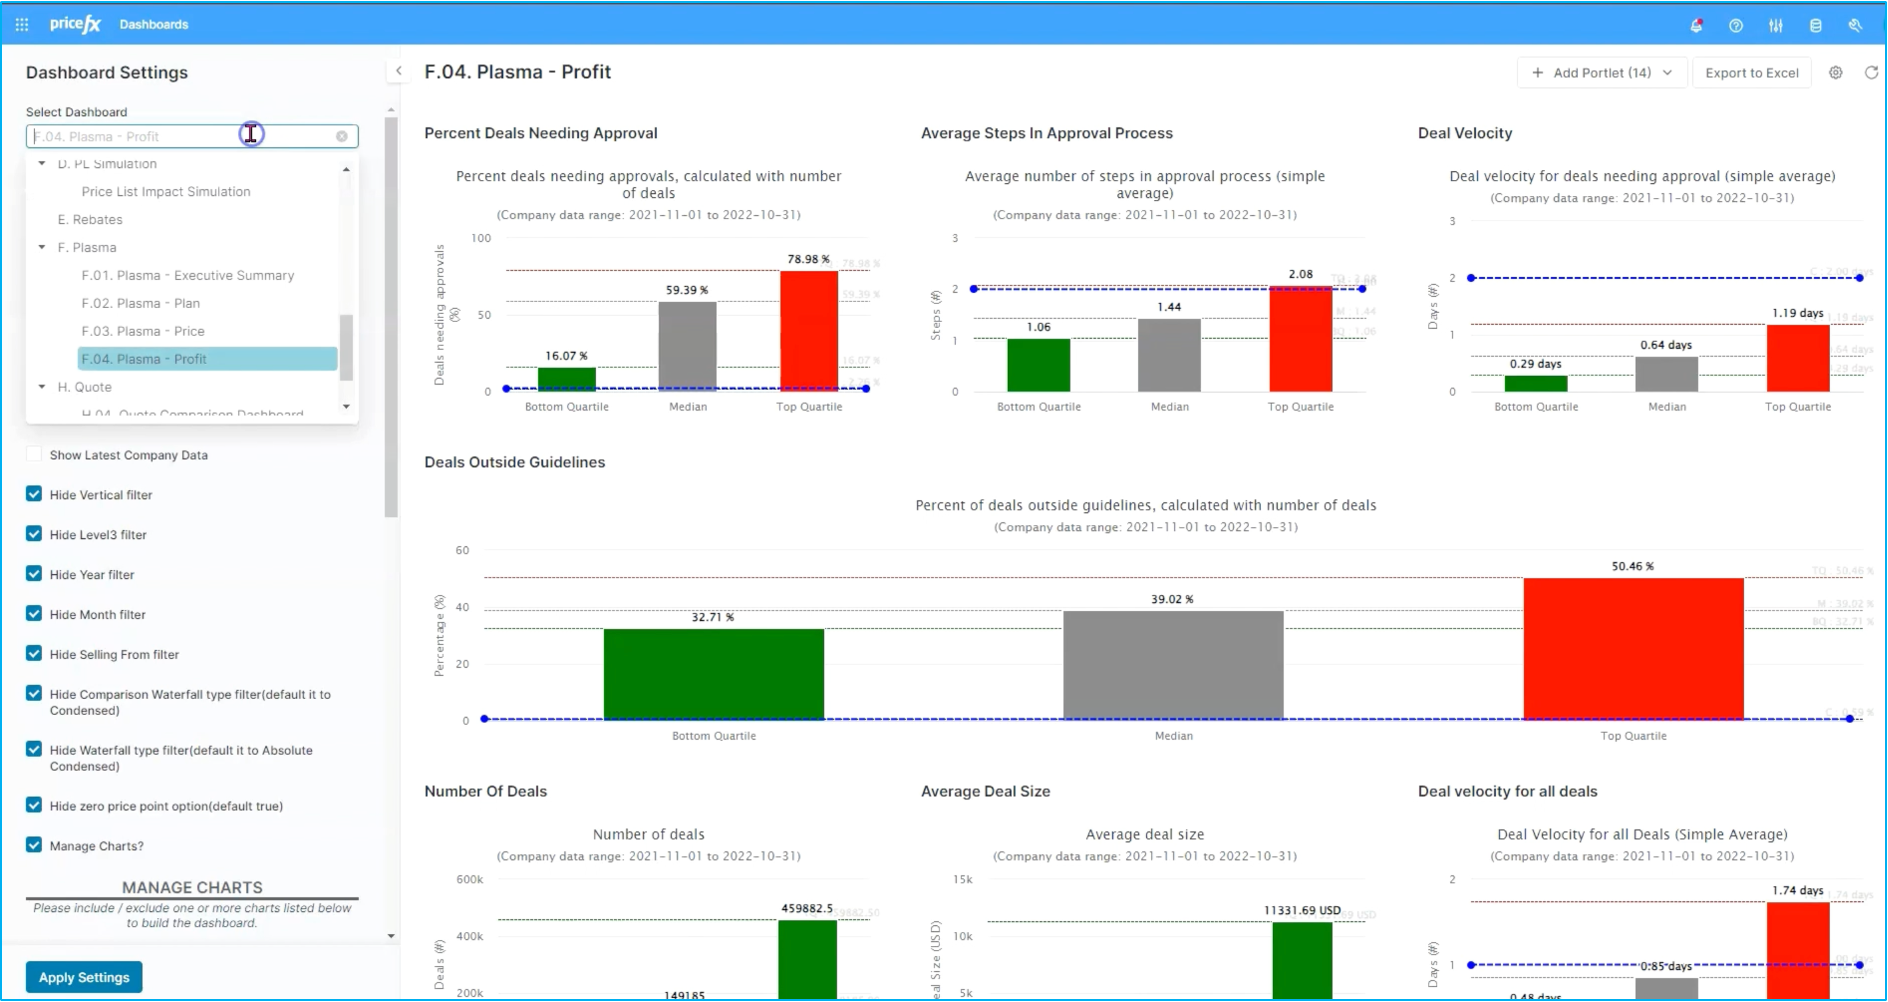
We can also look at another sub dashboard around sales and quoting which focuses on approvals, deal velocity and other sales operations metrics.
For now we will go back to our executive view and dive into one process metric and one margin metric.
Step 2: Process metrics
Scrolling down, we can see a couple of different process metrics around sales, things like guidance, velocity and steps in the approval process. We'll actually expand this one out to full size and we can see two individual elements here. One is the blue line, which indicates our improvement over time or our progress over time in terms of doing not quite as well around multi step process versus a single single step process. This varied a little over the last couple of months which is probably good in terms of its consistency about being less than a three or four step process. Ideally however, you would continue to drive this down to 1. The other element of the dashboard you can see are the bars and in this case you can see the benchmarking component where we see best in class quartile customers are in the area of around one step or auto approval versus 1 1/2 steps.
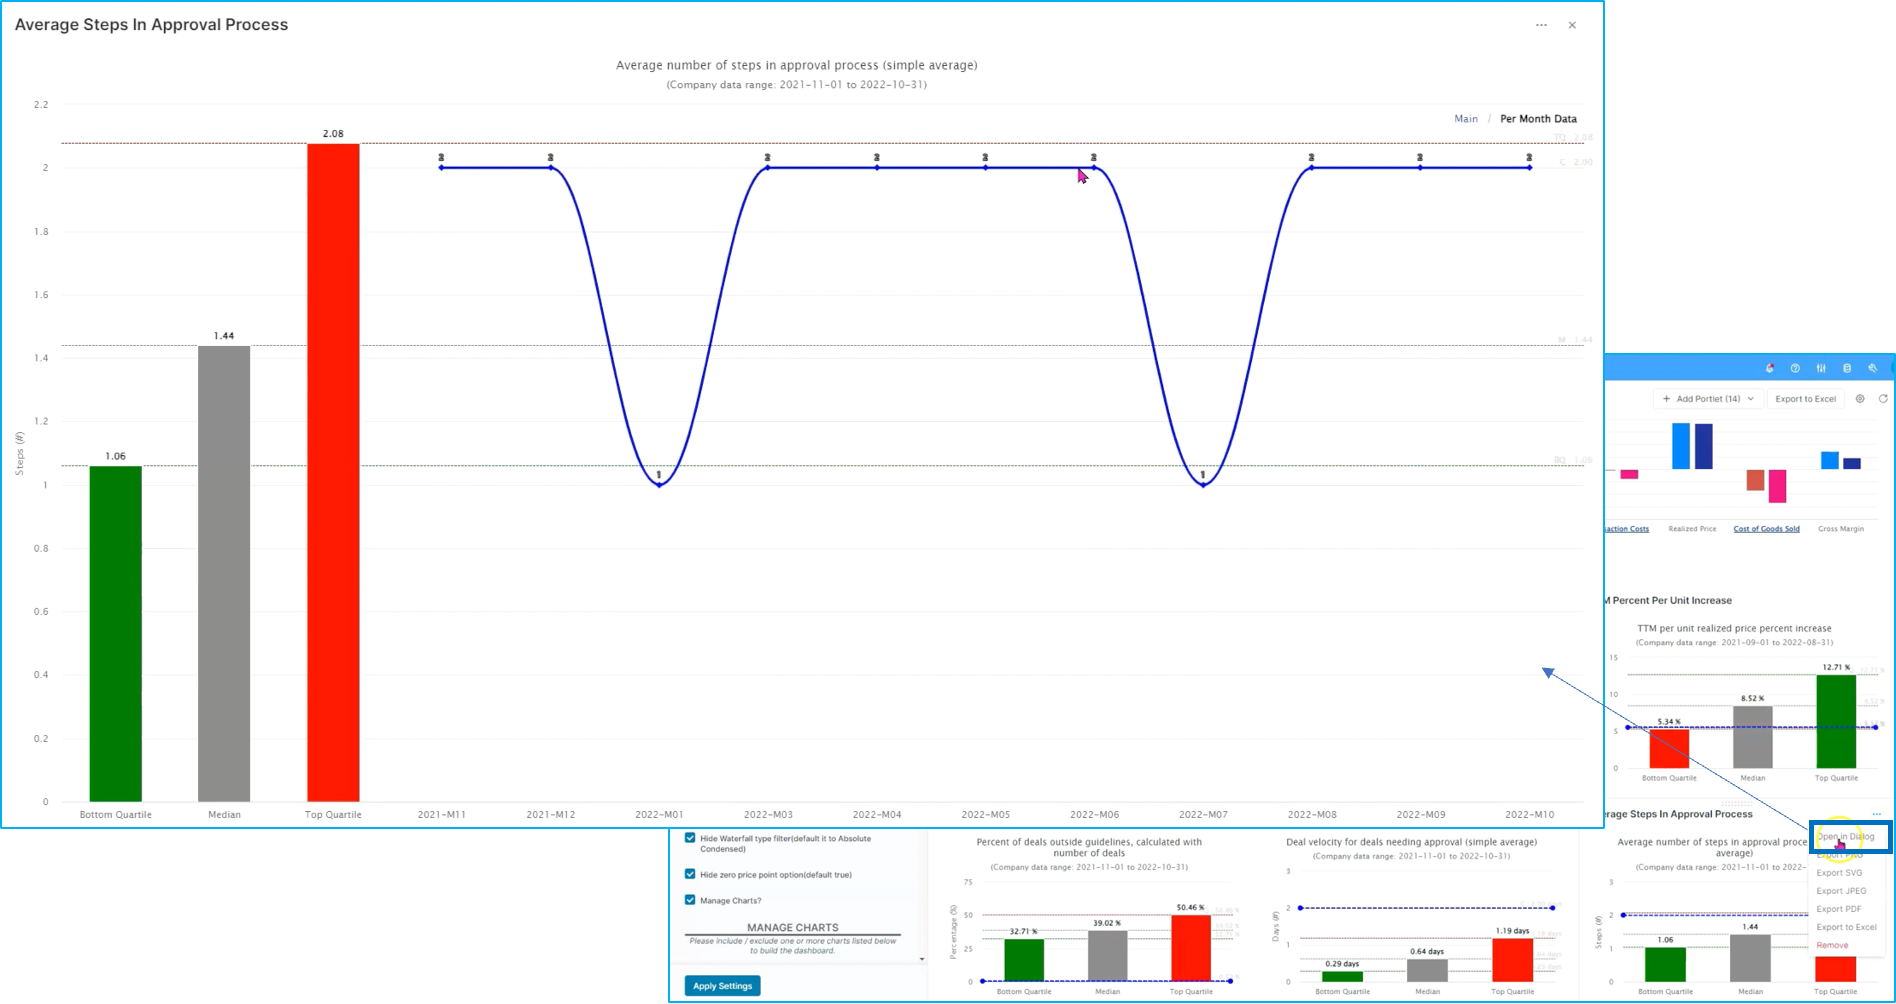
So even though the actual KPI could be doing very well for us as an individual company in our history, it might be something that's trending a little bit below general expectation in the marketplace.
Step 3: Margins
Looking at a separate metric around margin, we can take a look at negative margin transactions. So hopefully this is something that you don't have in your company, but it's actually not all that uncommon for companies to have negative margin transactions.
In this case, looking at benchmarking we can see those really excellent companies are well below 1% in terms of best performance at an average year around 1 1/2 or so. Regarding price transactions that have negative margin and in terms of the lowest performance, you're looking at going up into the 3 to 3 1/2 percent.
If you want to look at your average performance, we can see it on the overall trend line. But if we dig into it in more detail, you can see your trending over the last several months.
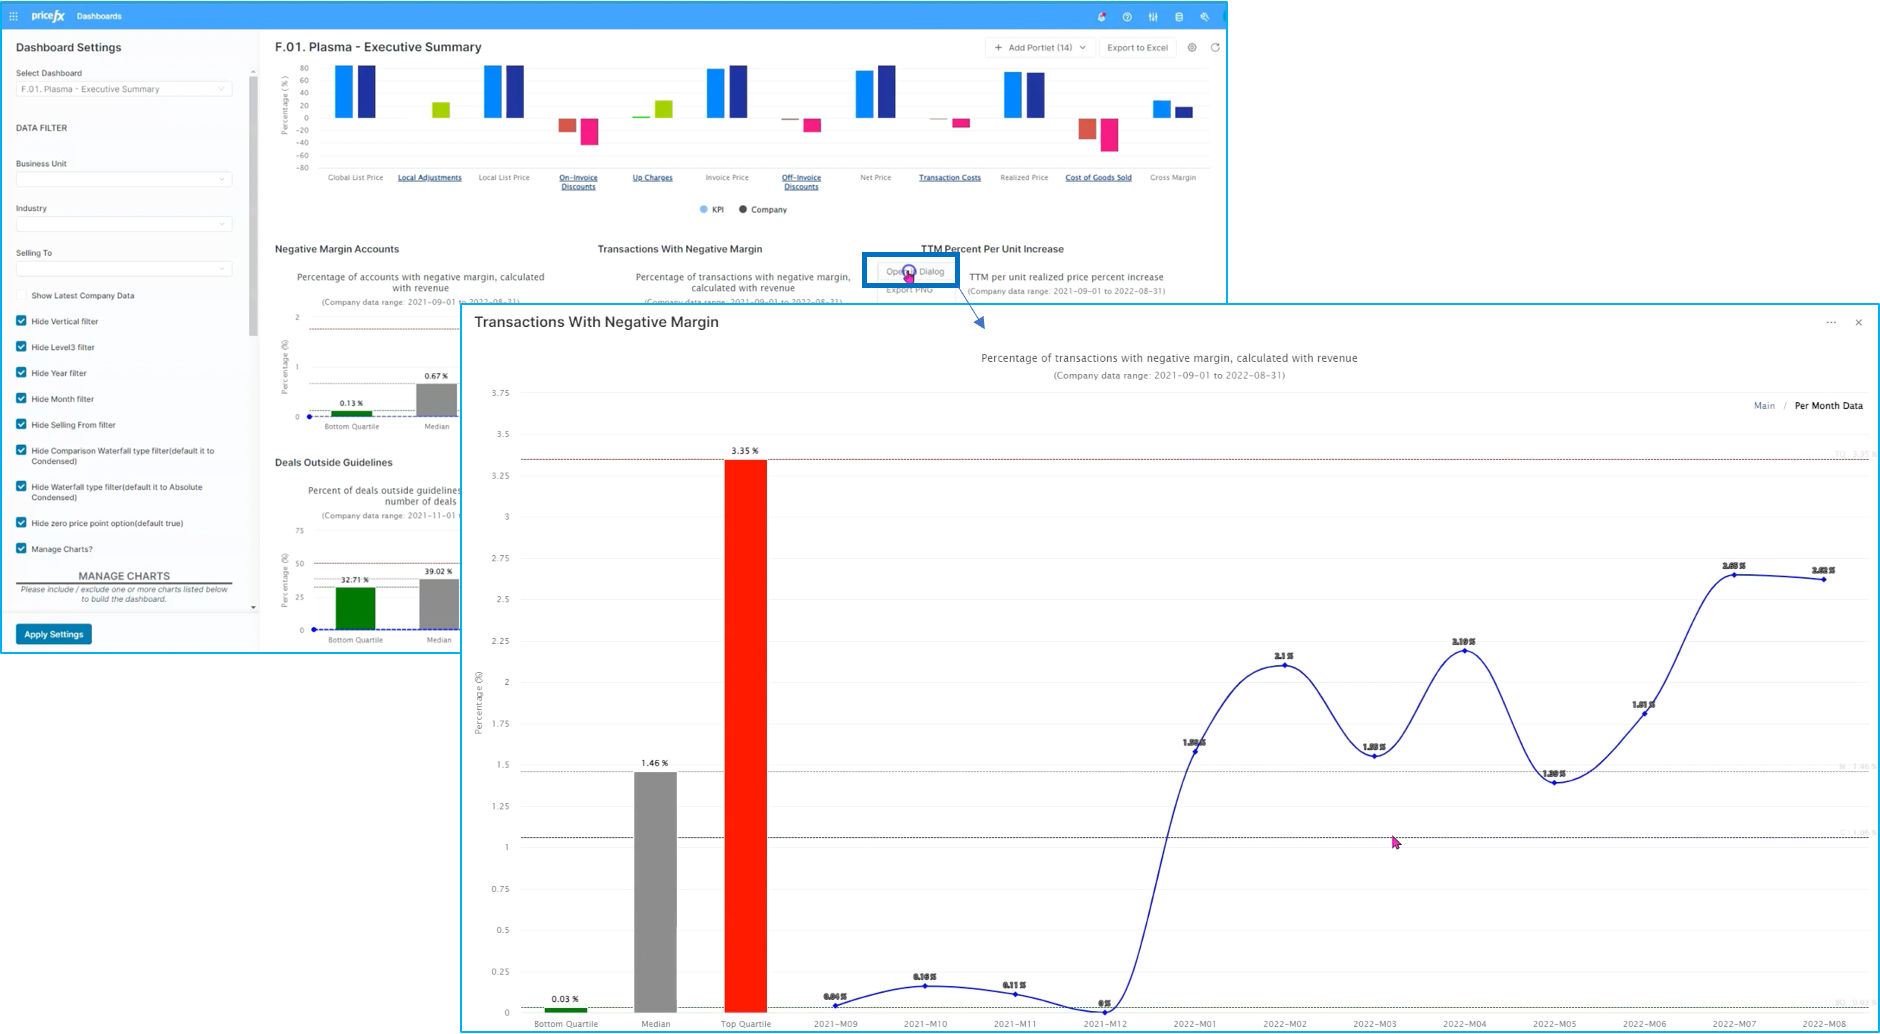
In our case, we actually started out doing exceptionally well and somewhere around midstream we saw a real negative spike in terms of negative margin transactions. You can also see that continue in the last one to two months. You can use this as a point of discussion with the team in terms of how you can turn this trend around.
Wrapping it up here, this is the flow for improved pricing and business performance with Pricefx Plasma KPI and benchmarking.