In this sample use case, we want to identify areas of improvement by looking at outliers, root cause and trending analytics, followed by price change realization analysis. It is important for distributors to know where they place against the competition when it comes to their pricing and to identify hidden losses to optimize revenue. With Pricefx all this is possible and as easy as 1,2,3 in our analytics capability.
Good to know: Some of our screens may be different as we are in a demo environment.
LEARN MORE: If you need a refresher on how to use dashboards in Pricefx, click here.
Situation description
For this scenario, we will take the role of a pricing manager. In the current state of affairs, there is limited visibility into the price waterfall. It's difficult to know where to start and even more challenging to quantify the impact of pricing changes. With Pricefx there's an opportunity to leverage data we already have to identify improvement opportunities and track margin impact across the waterfall. This results in margin expansion due to better targeting and design of pricing actions.
Workflow
Let's see how we can improve effectiveness with Pricefx ➡️ Sales Insights Analytics.
Step 1: Revenue and margin dashboard
Pricefx has a robust set of analytics capability and decision support. This includes sales insights and customer insights out-of-the-box, as well as configured dashboards for areas like costing and other components within the application.
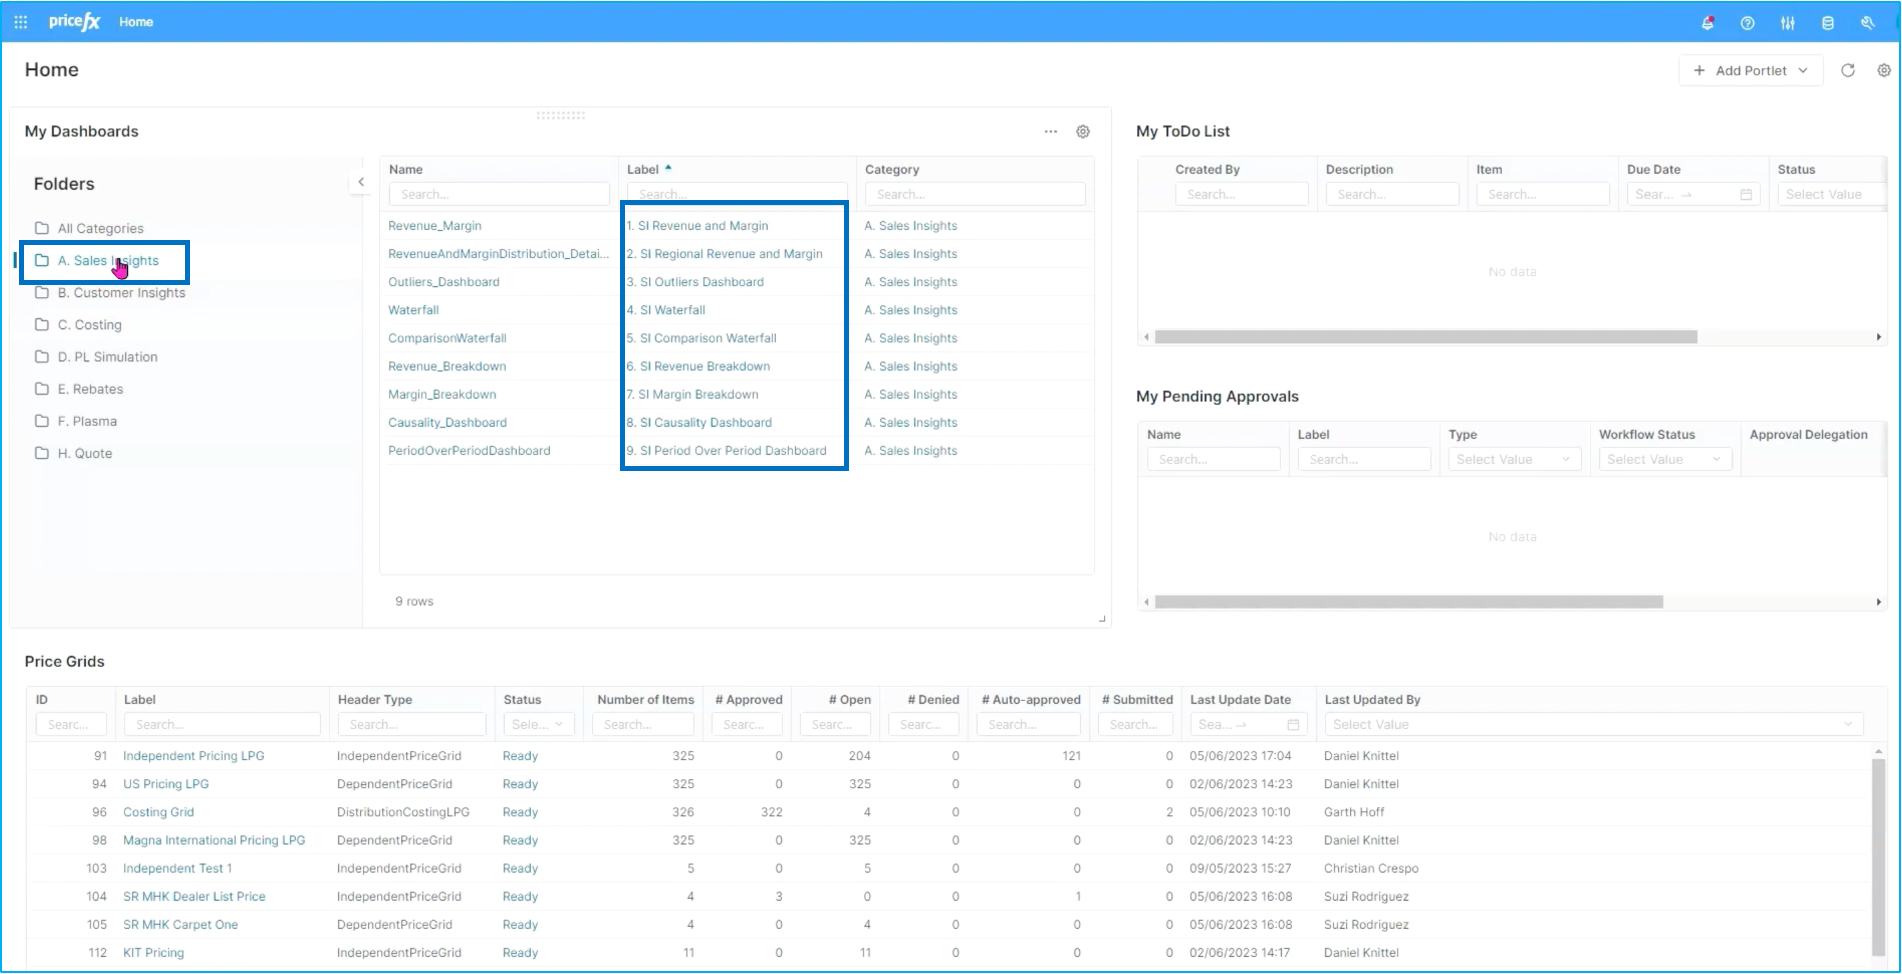
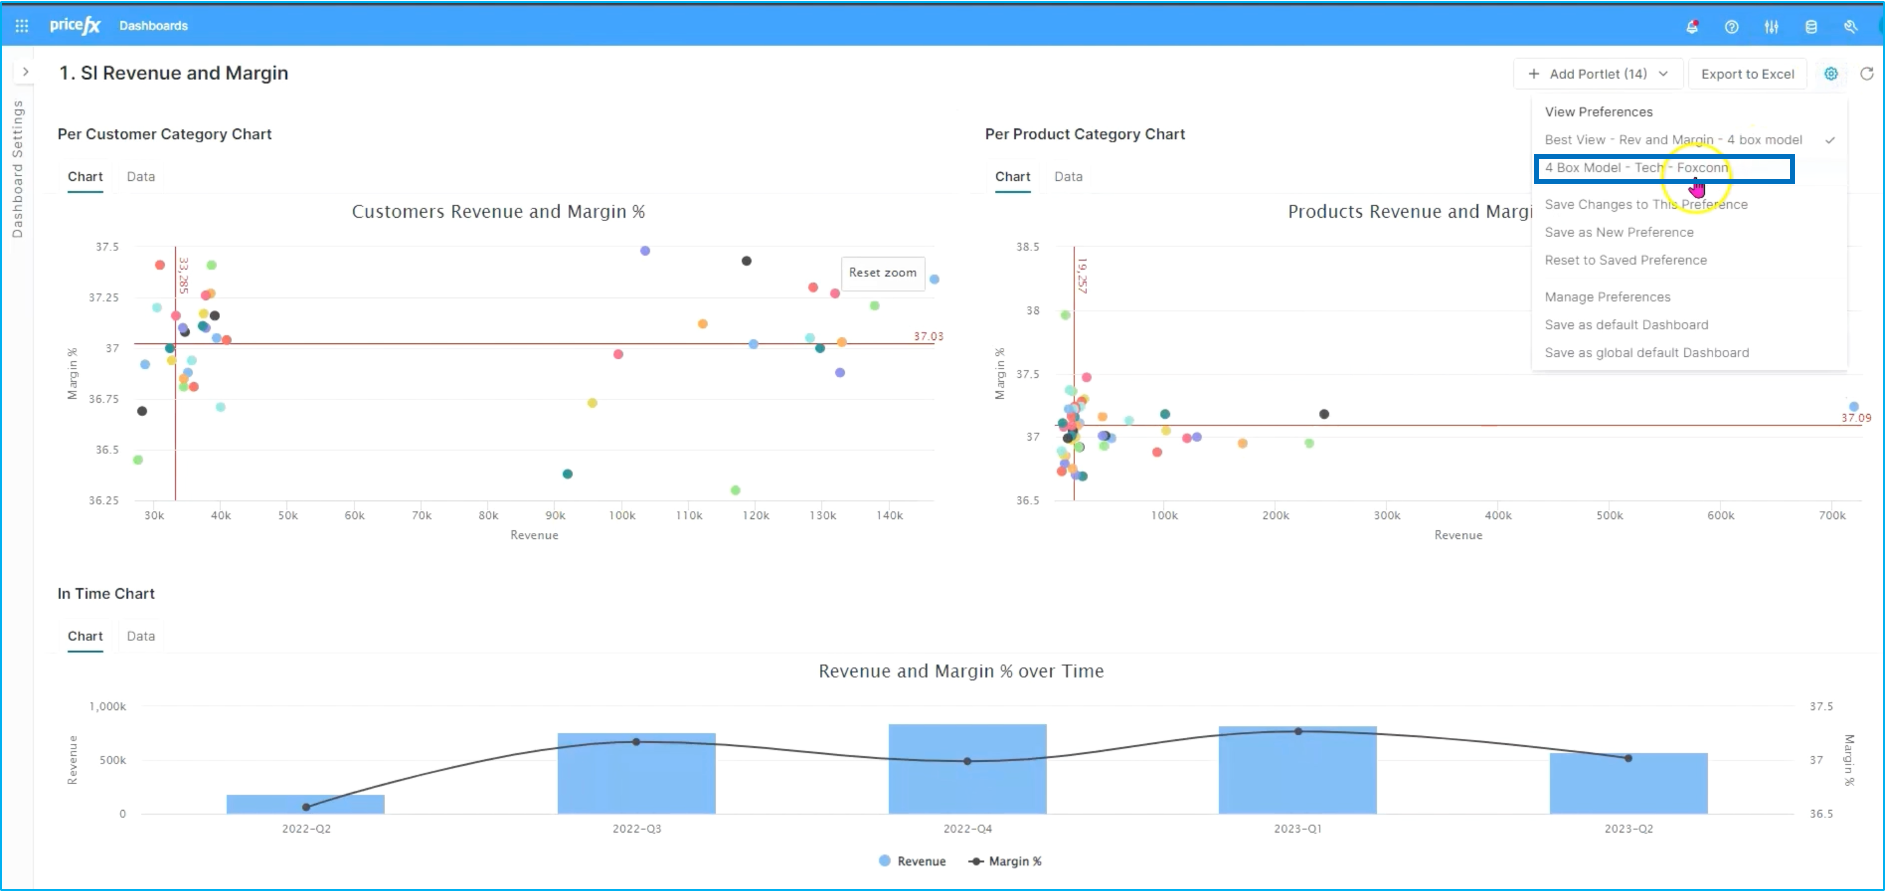
We'll start off today by reviewing sales insights and in this case, we'll look at a couple of these nine dashboards starting out with revenue and margin.
What we want to do in this case is identify opportunities for improvement. You can see we can do this in this four box consulting model where we're looking at high revenue below margin performers.
Step 2: Outliers dashboard
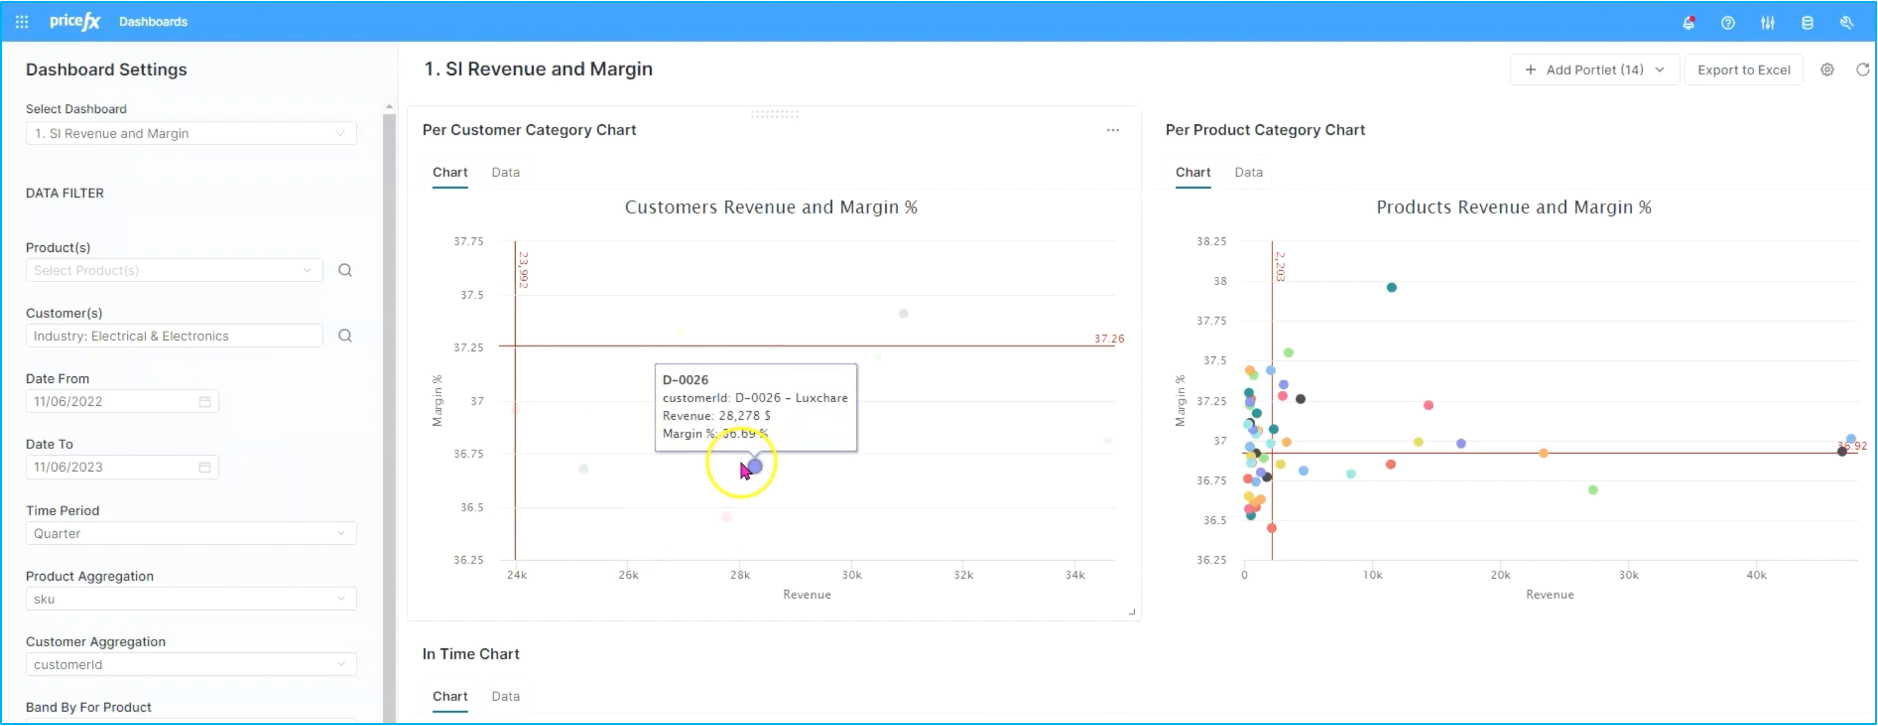
Now we will filter down to look at one of the areas of business, in this case high tech electrical and electronics component. And we can pretty quickly find a couple of outliers.
In this case, we see which particular outliers we should pay more attention to. Now we can take a look at our outliers dashboard to help us quantify the opportunity. Again, in this case, we're doing some force ranking, specifically looking at areas of our business around product performance. We can see a number of our electronics and tech products. As well as customer performance, again, where we see a number of different companies that are in the lower quartiles.
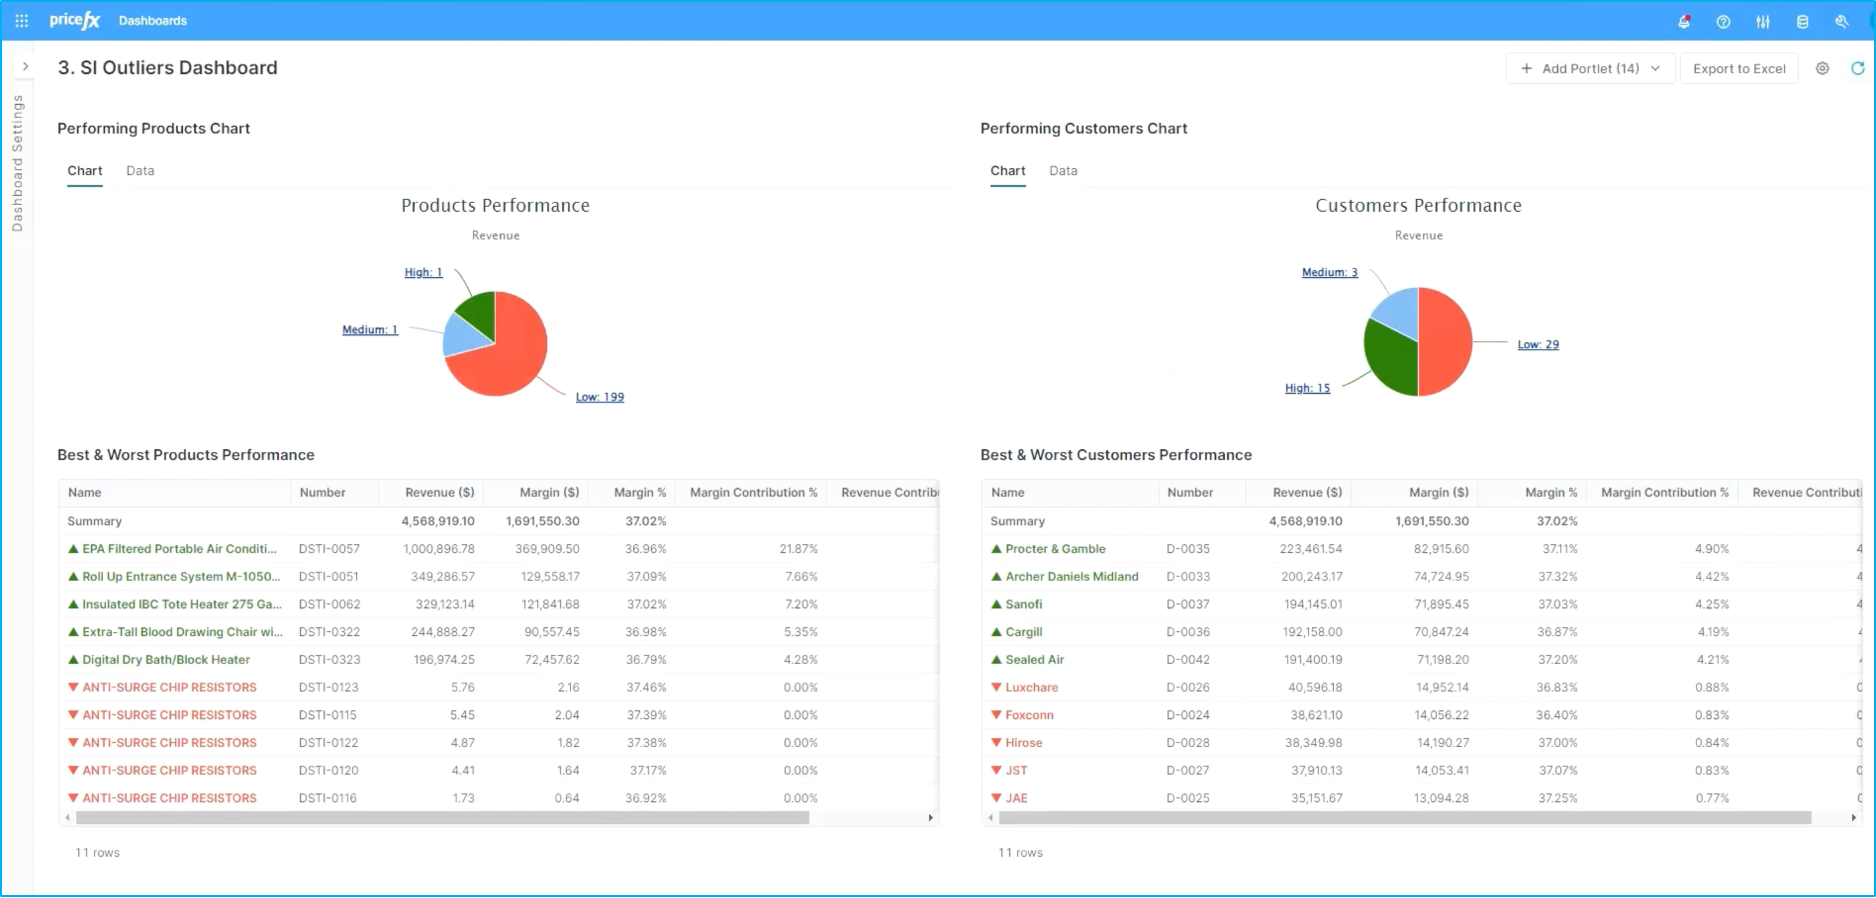
Again, you can quantify the impact of potential changes around revenue, margin and potentially even volume.
Step 3: Price waterfall
You can go the extra mile and identify the root causes of underperformance. To do that you will have to take a look at the price waterfall.
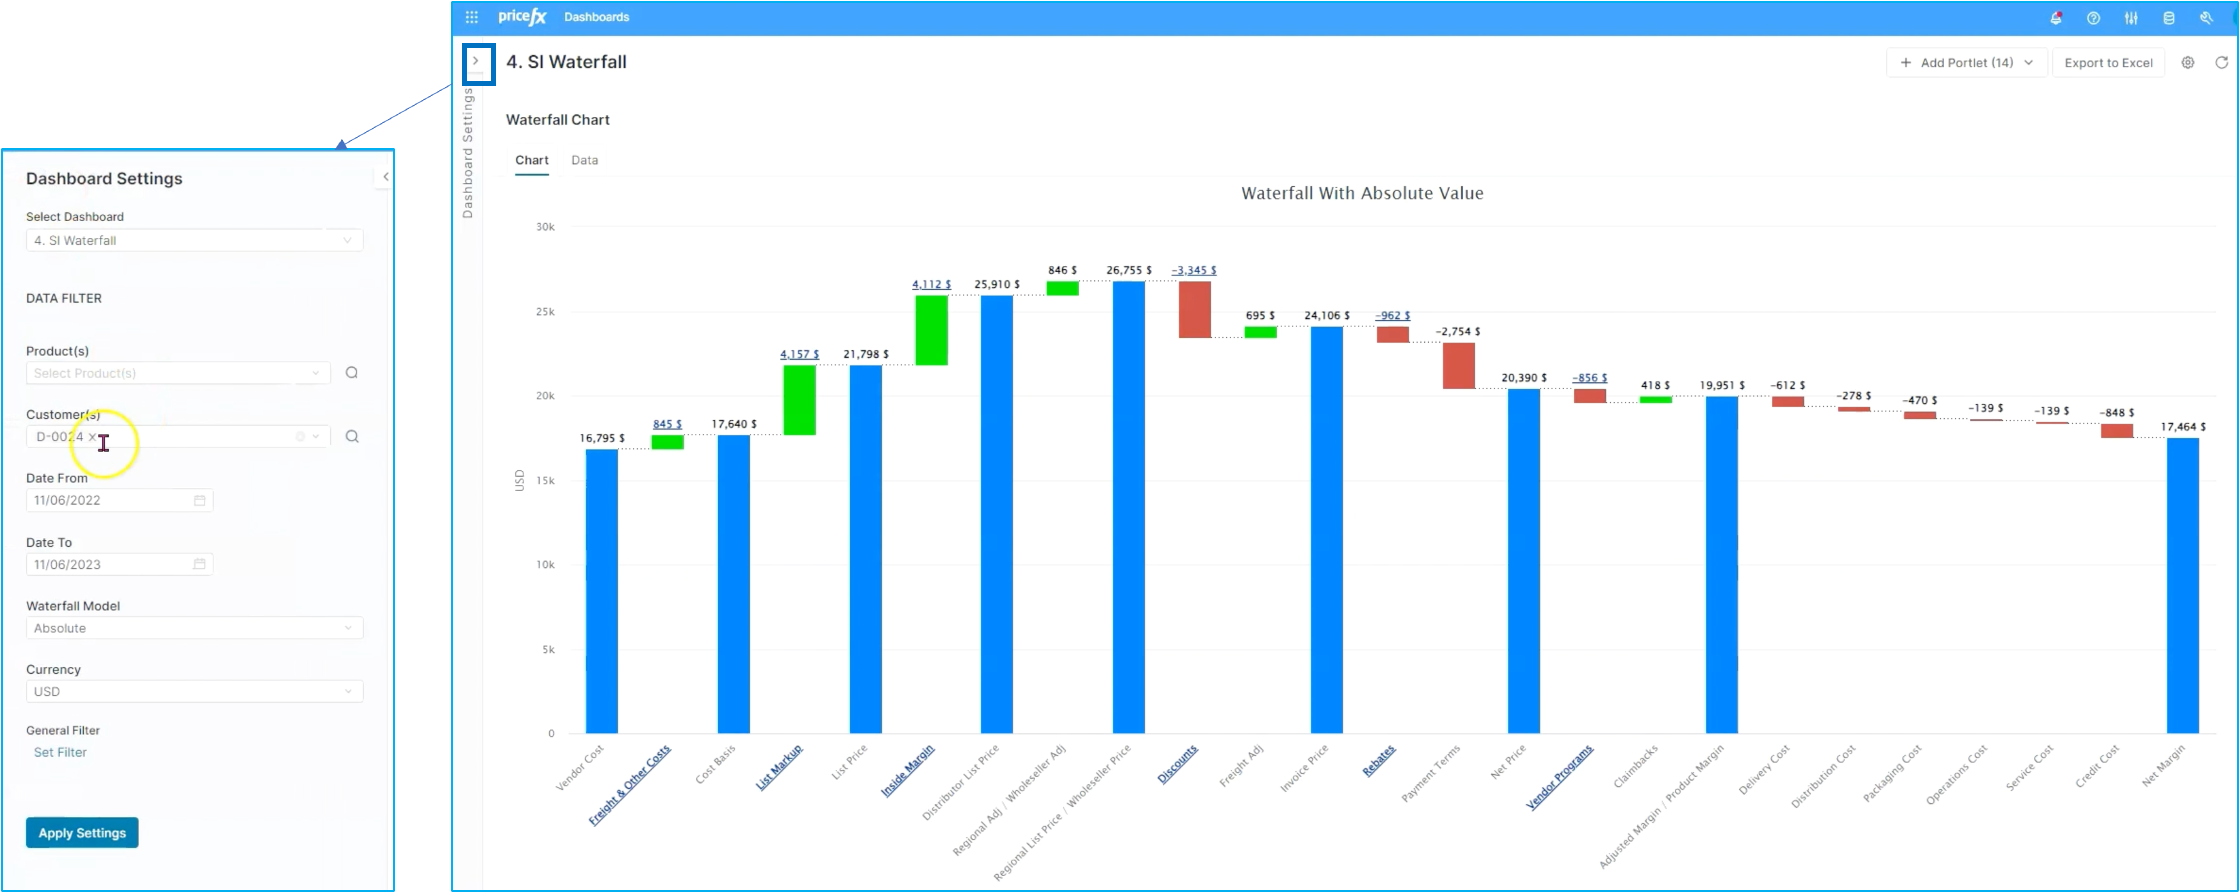
Again, in this case, we've actually drilled down to that one specific customer that we're targeting. Now you can investigate things like discounting, which might be usual suspect, as well as potentially maybe vendor programs and understand what the impact of those are on the total waterfall.
We will return for a second to the higher level view and take a look at our off invoice discounting, in this case, things like rebates and payment terms. At a glance, we can see that rebates aren not really the problem, but potentially it's payment terms.
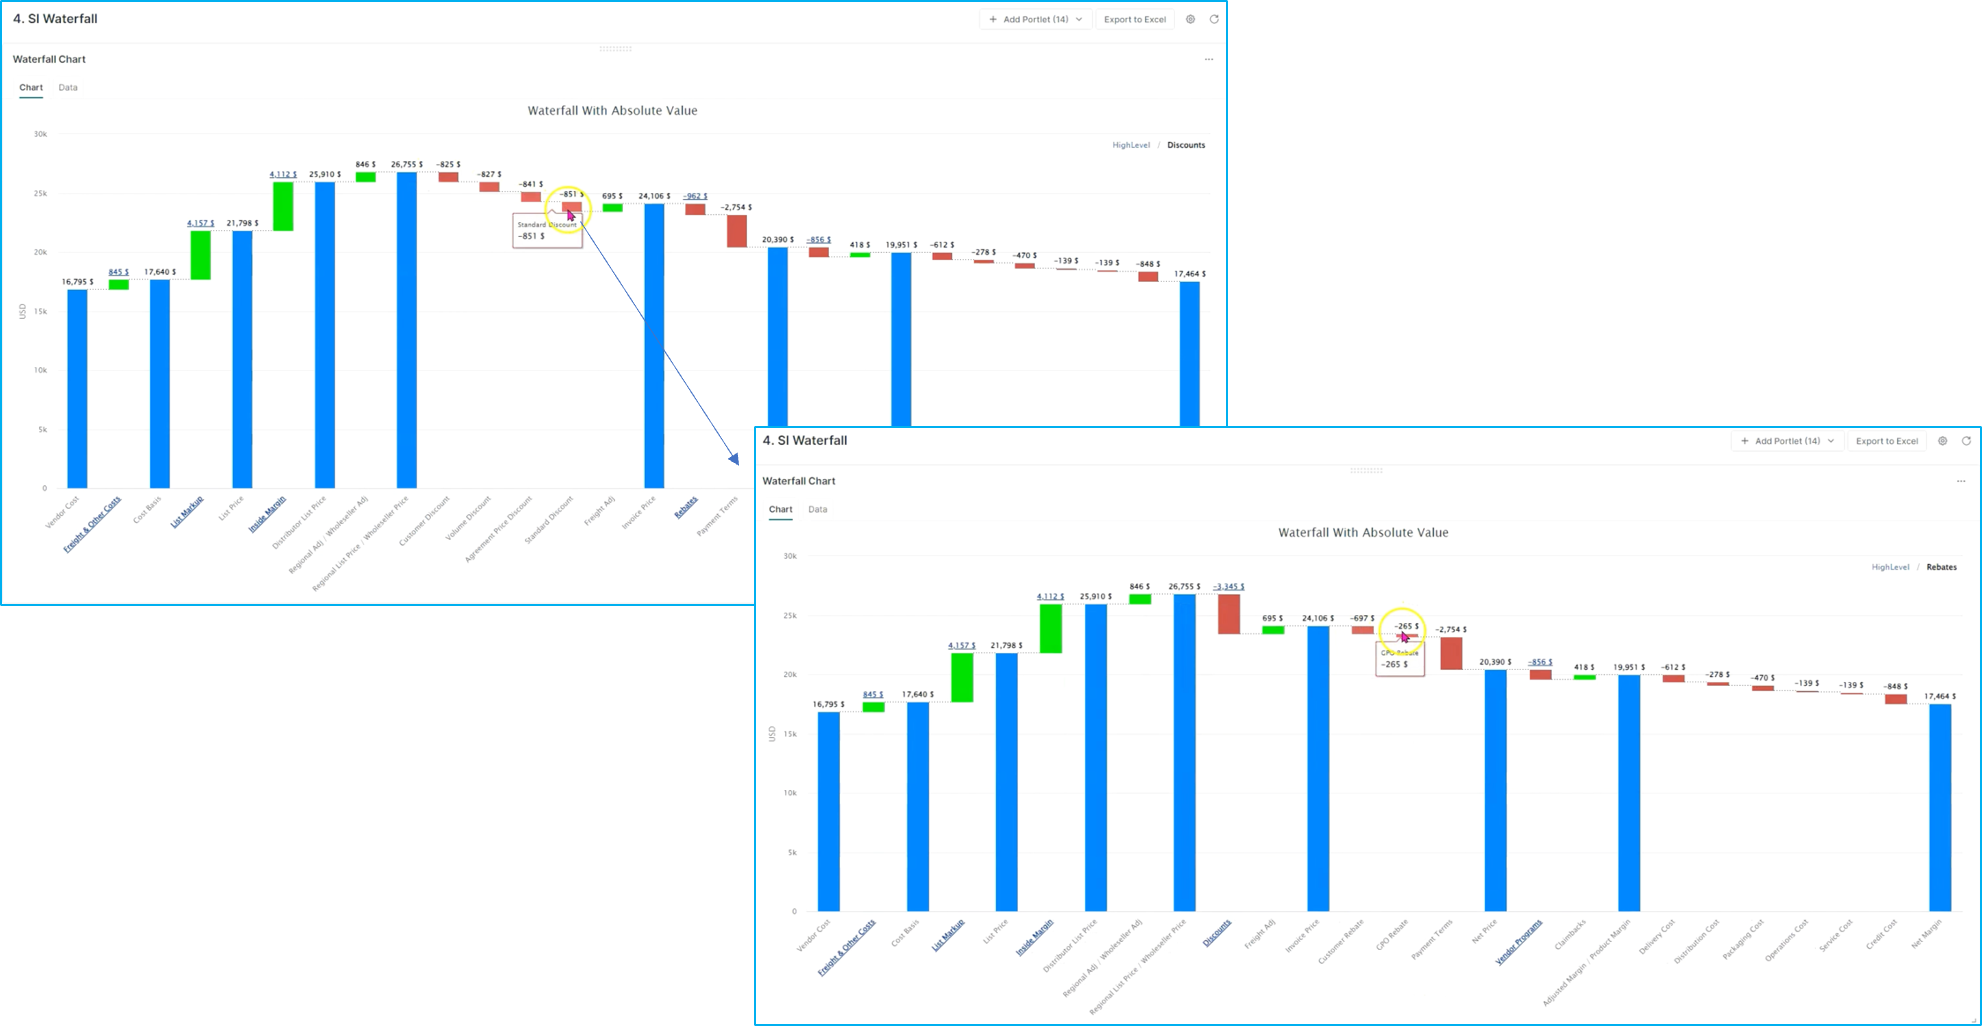
This might be one of the larger levers requiring exploration in terms of price and policy changes.
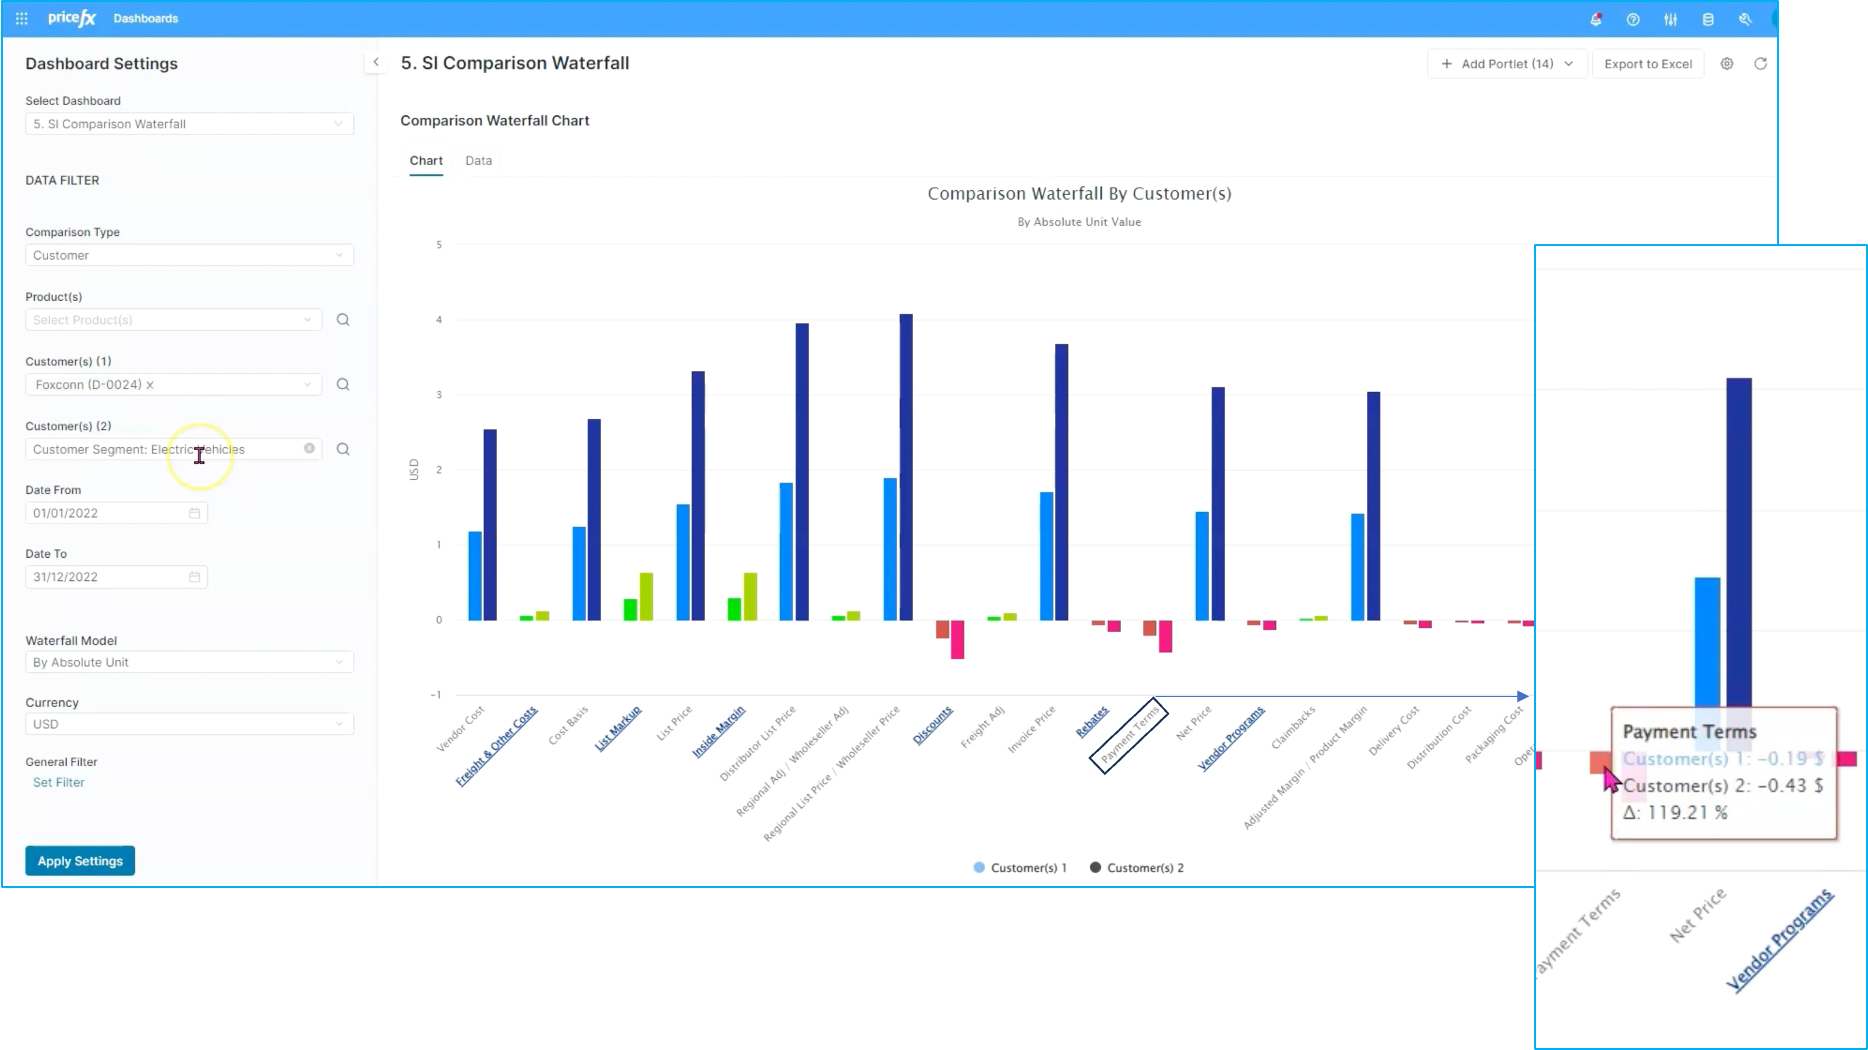
Step 4: Waterfall comparison
And then lastly, we can look at a comparison waterfall to validate customer issues versus the group. Again, in this case, we're looking at one individual customer versus other peer groups within the same segment. In this scenario you can see a variety of differences, but it confirms what was suspected around payment terms being one of the large components of differentiation of this customer versus other peer groups within the segment.
Step 5: Reviewing results
So once we make changes from a pricing strategy perspective, we can come back and view the results of our strategy changes. In this case, we're quantifying the results from margin breakdown view.
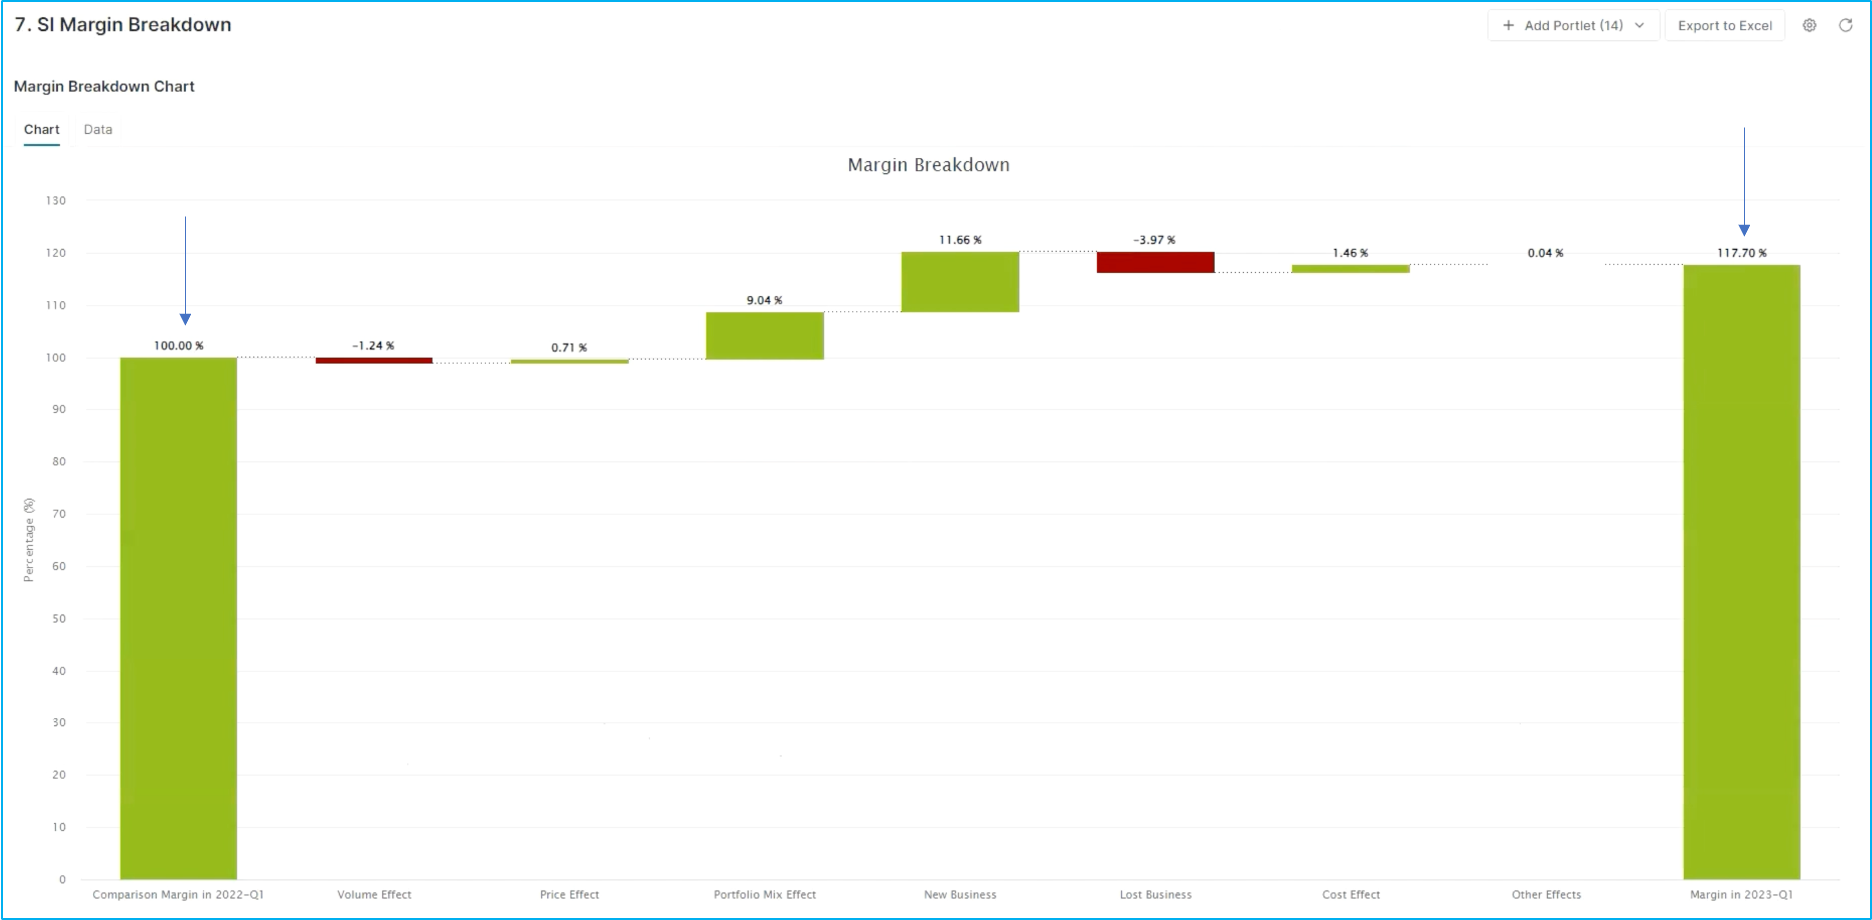
You can see what the previous margin (on the left side) is versus our current margin (on the right side) after the changes that were made. In this case we're looking at things like volume and price effect which are relatively small; a small increase in price with relatively low negative change in volume. However, with these price changes done you can see a nice improvement in portfolio mix as well as a tremendous amount of new business that's been won with relatively little lost business or defection. This is giving us a result of net positive in terms of this pricing action or this pricing change.
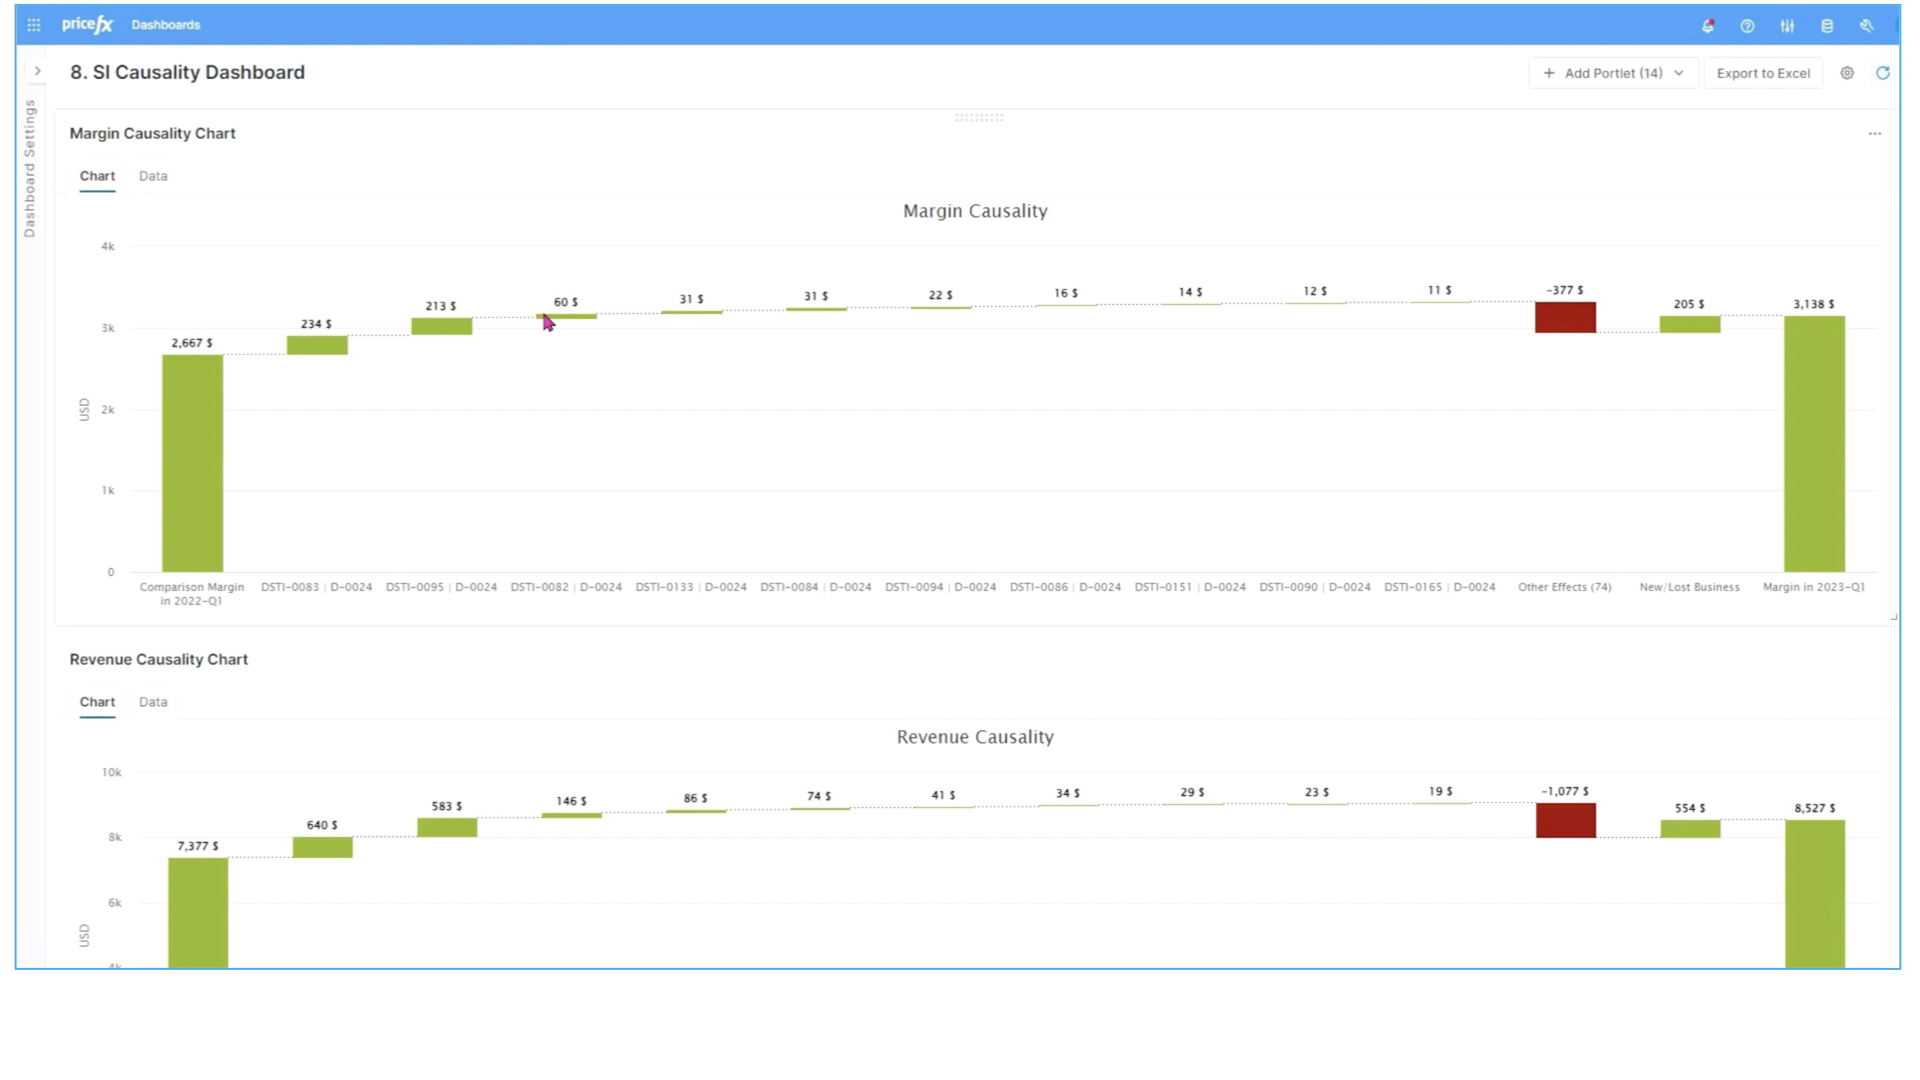
Causality dashboard
If you want to see even more detail, you can go to a causality dashboard where you can see the detailed impact on an individual product and customer combination basis, to understand what are the prime drivers of that change within the previous waterfall view.
This is how you can achieve improved profitability using Pricefx Sales Insights analytics.
LEARN MORE: To find out how to use Sales Insights, click here.