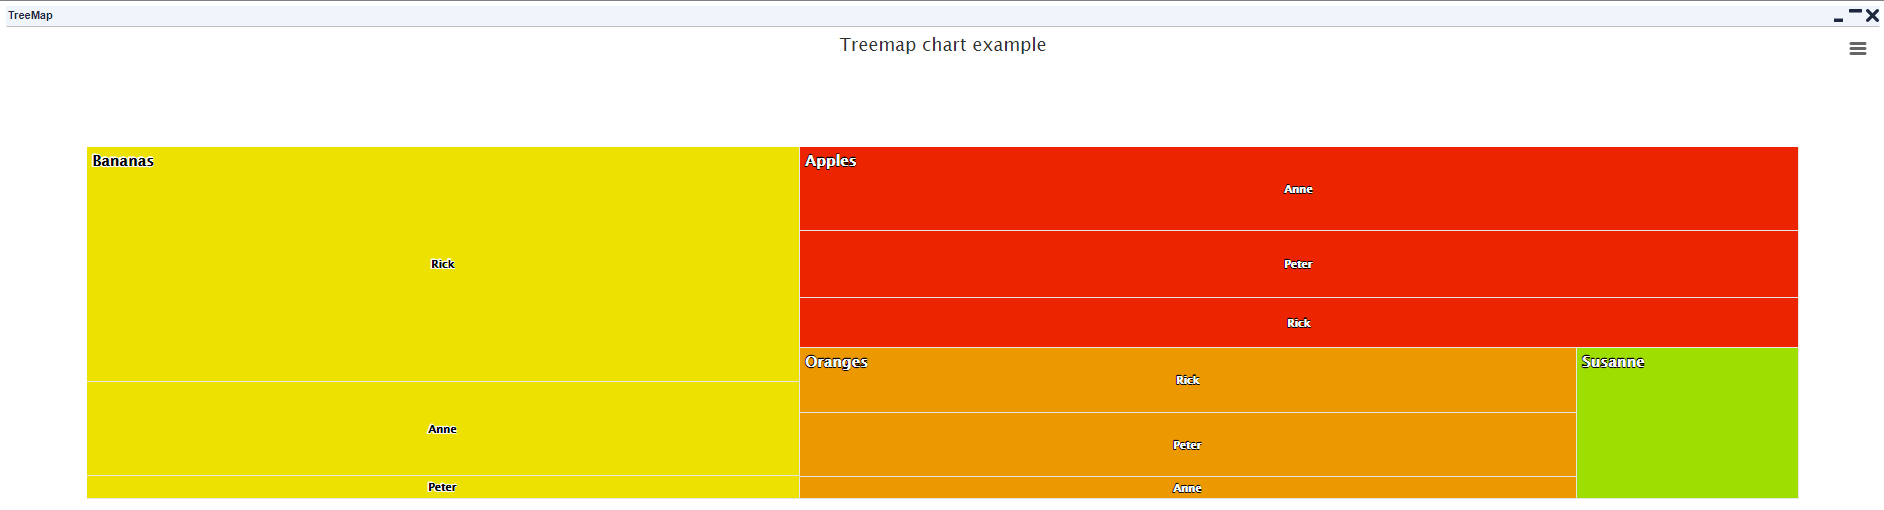
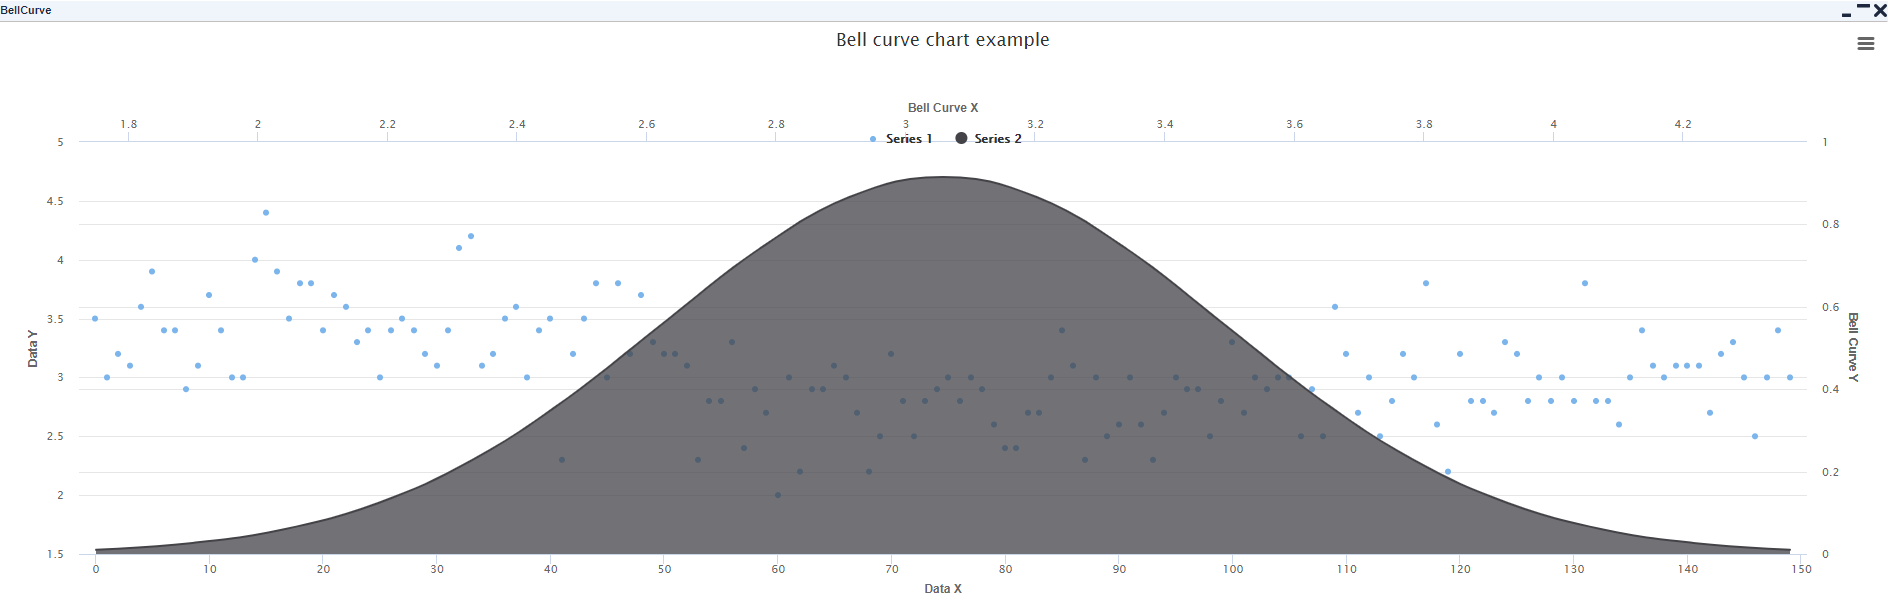
New Chart Types
Tree Map
Bell Curve
Histogram
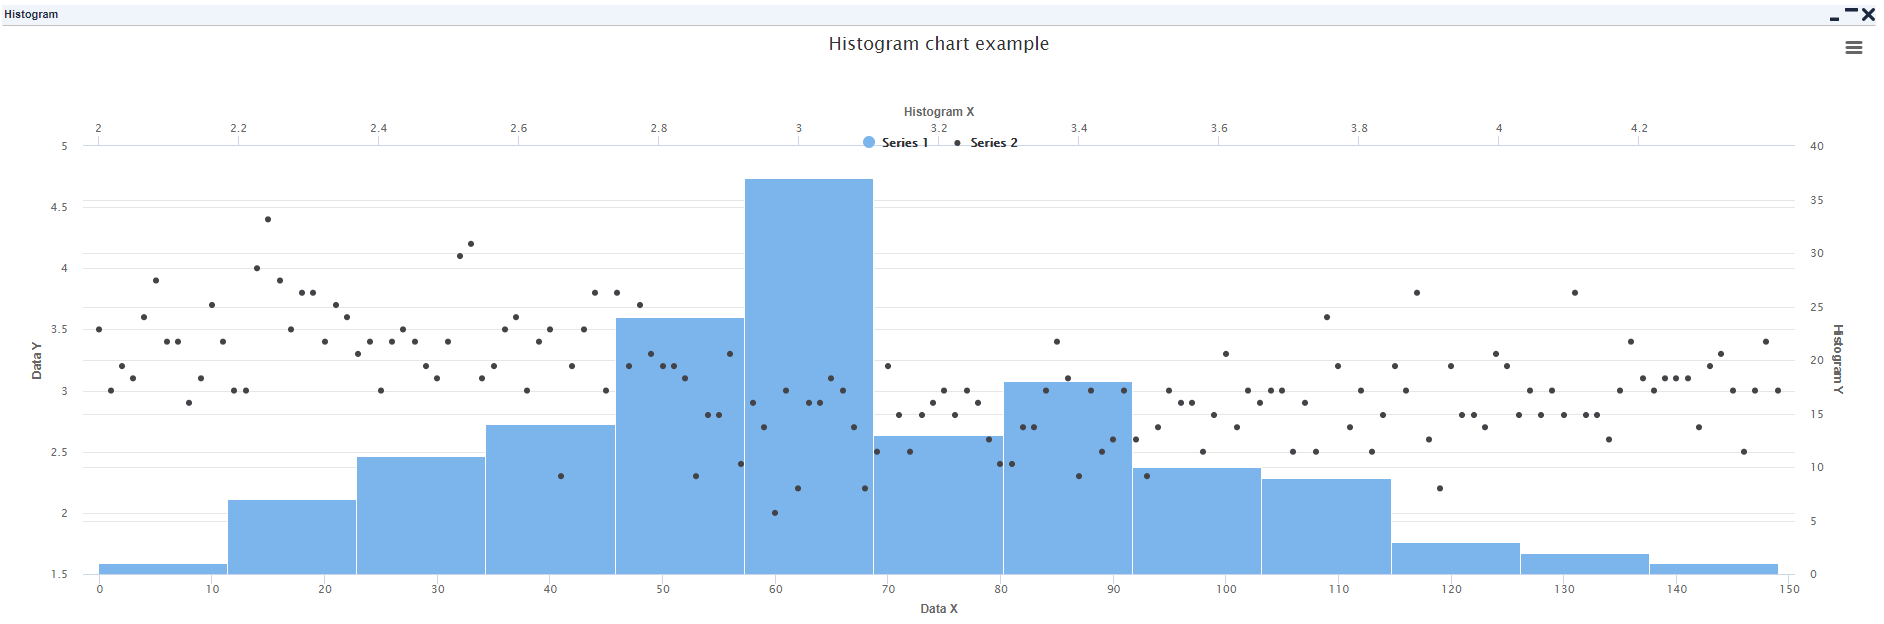
Examples can be found in the HighchartLibrary_Examples logic.
Fixed Issues
Stories
PFPCS-2704 Changes in DataLabel.groovy to support setting text
PFPCS-2703 Changes needed in Chart.groovy to support multiple axis
PFPCS-2702 Add support for setting visible flag for an axis
PFPCS-1732 Add additional charts
PFPCS-3292 Creating setText method for existing class DataLabel