To run the Win Rate Accelerator, you must create a new Model Object from the Optimization > Models menu, using the Win Rate Optimization Model Class to instantiate the machine learning model and give it the required parameters. The model will then be added to the list and will be editable.
In this page:
New Model
-
Go to Optimization > Models and add a new model.
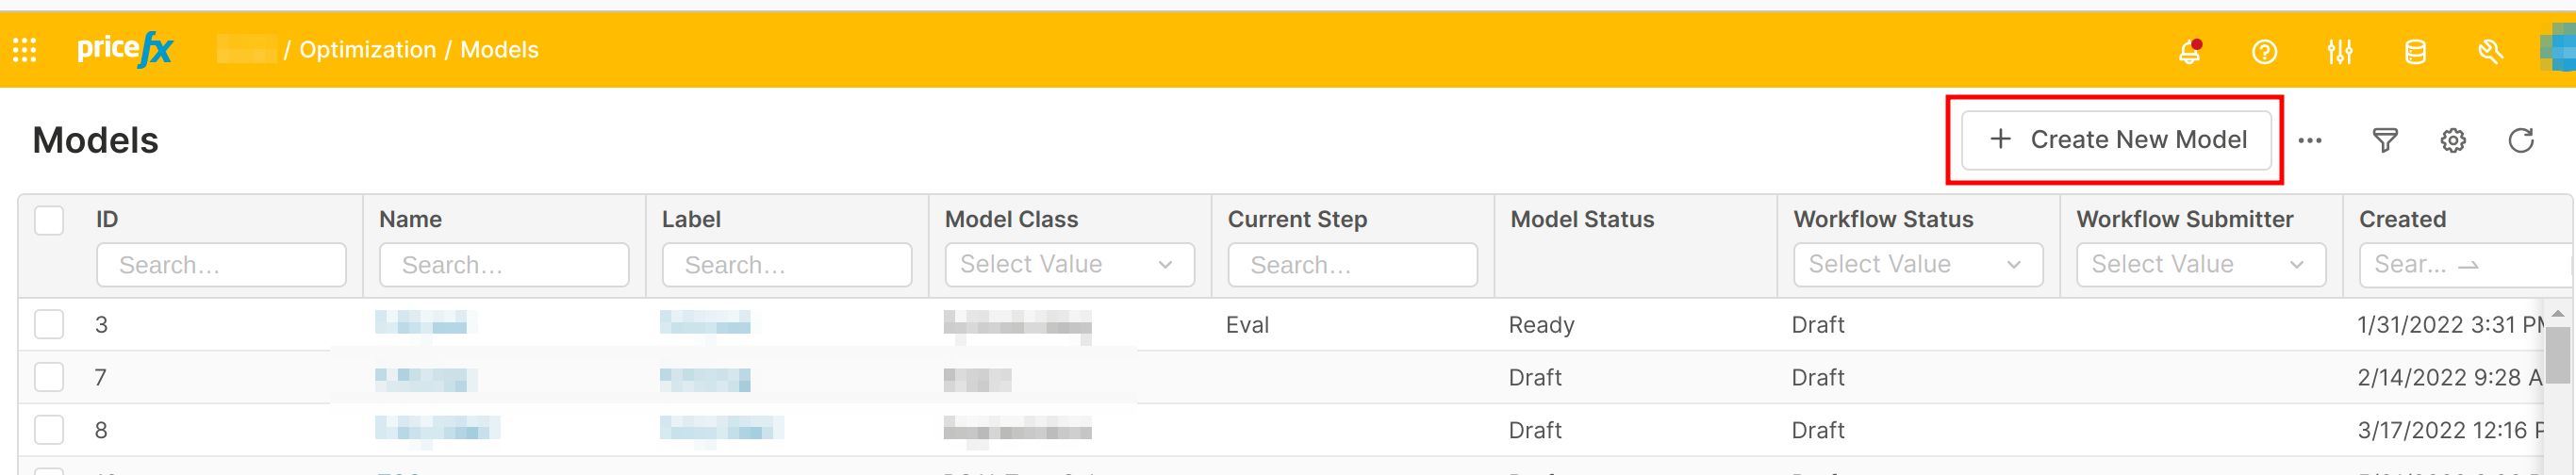
-
Define the name of the model and choose Win Rate Optimization as Model Class.
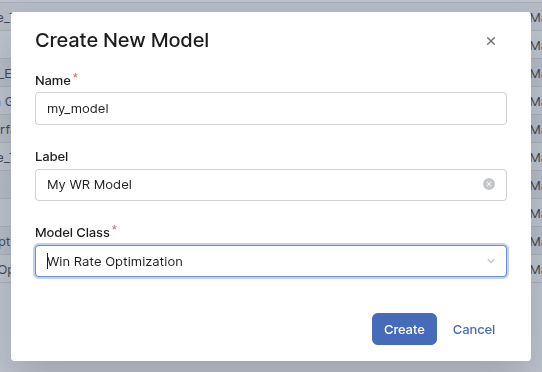
Create a Win Rate Optimization model -
The new model opens. The interface is:
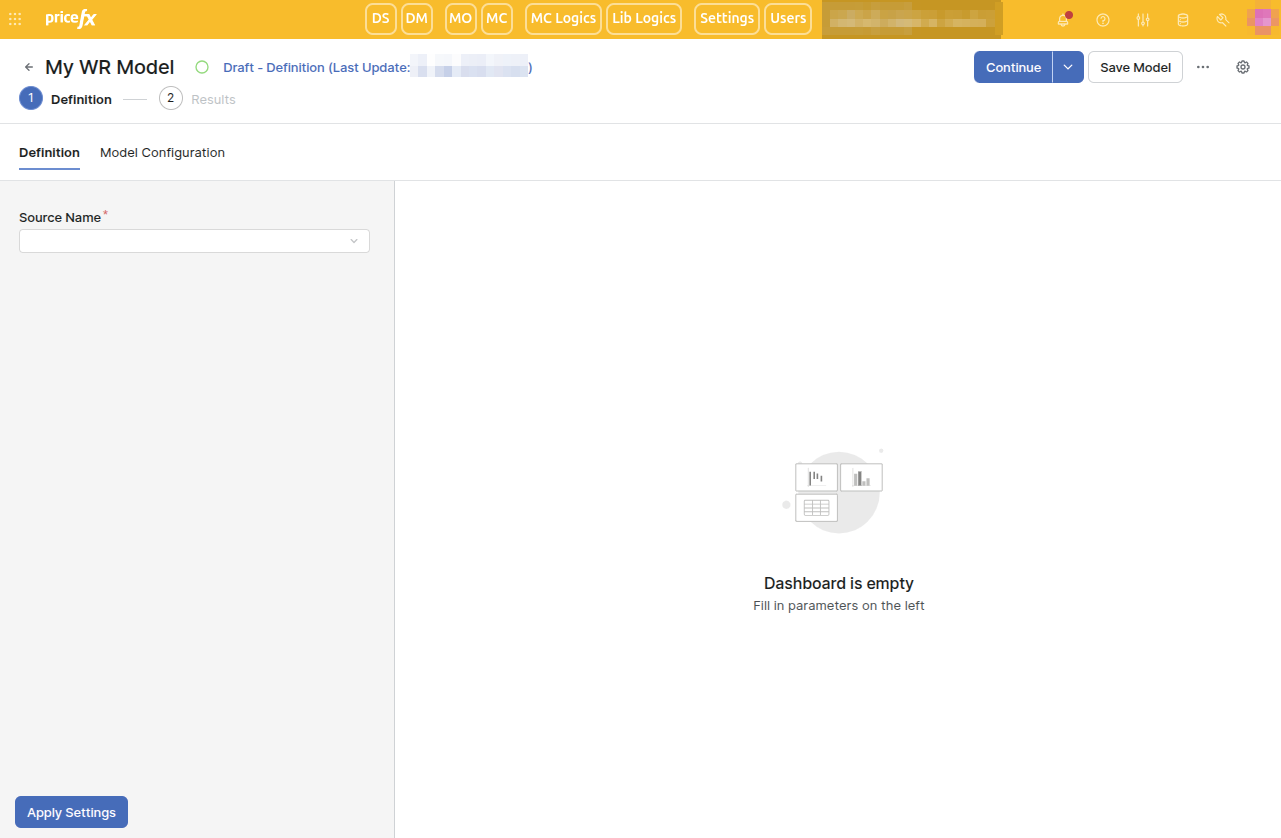
Definition and Results are the steps of the model and will be explained below.
Definition Step
This is the first step of the model. There are two tabs: Definition and Model Configuration.
Definition Tab
When you open a model for the first time, the only user input is Source Name. It is the quotes table to pick. Once picked, you can map the fields of the table and define the scope of the model.
The scope of the model is defined using the Filter user input.
There are mandatory fields to map. Their meaning is explained in Data Requirements (Optimization - Win Rate).
-
All the values in the mapped fields are extended values (extended to the quantity).
-
The Revenue at List Price is not mandatory. But if you don’t map it, you will not be able to define the discounts as a price metric of the model, even if you explicitly set them in the Model Configuration tab.
-
The Win/Lost Field is the field containing the status of each quote (like accepted, rejected, cancelled…) and then in the user inputs Win Values and Lost Values, you define the values meaning that a proposal is won or lost.
-
You cannot select same a Win/Lost value in both Win Values and Lost Values. If you do so, an error message appears and you won’t be able to continue.
-
The Win/Lost Field typically contains two to ten different values. If the selected field contains more than 100 different values, the drop down menus for Win Values and Lost Values will be limited to 100 values, in order to avoid a dashboard freeze.
-
If a value is not selected in Win Values nor in Lost Values, the corresponding rows of the source will be dropped from the model scope.
-
-
Additional categorical and numerical features may optionally be added to the model from the source to improve the accuracy of the model.
-
Examples to include in the categorical features would be product hierarchies and product Pareto information.
-
While numerical features can be included in the categorical features (for example, categories that use numerical codes), the same features should not be included in both categorical and numerical features at the same time. An error is sent if the same feature is entered in both categorical and numerical features lists.
-
A check is done on the reserved names, that cannot be used as model features, such as “quantity”, “revenue”…
-
Finally, there are three default filters, that are useful to ensure the model to run. It is possible to uncheck them, but it may create calculation failure.
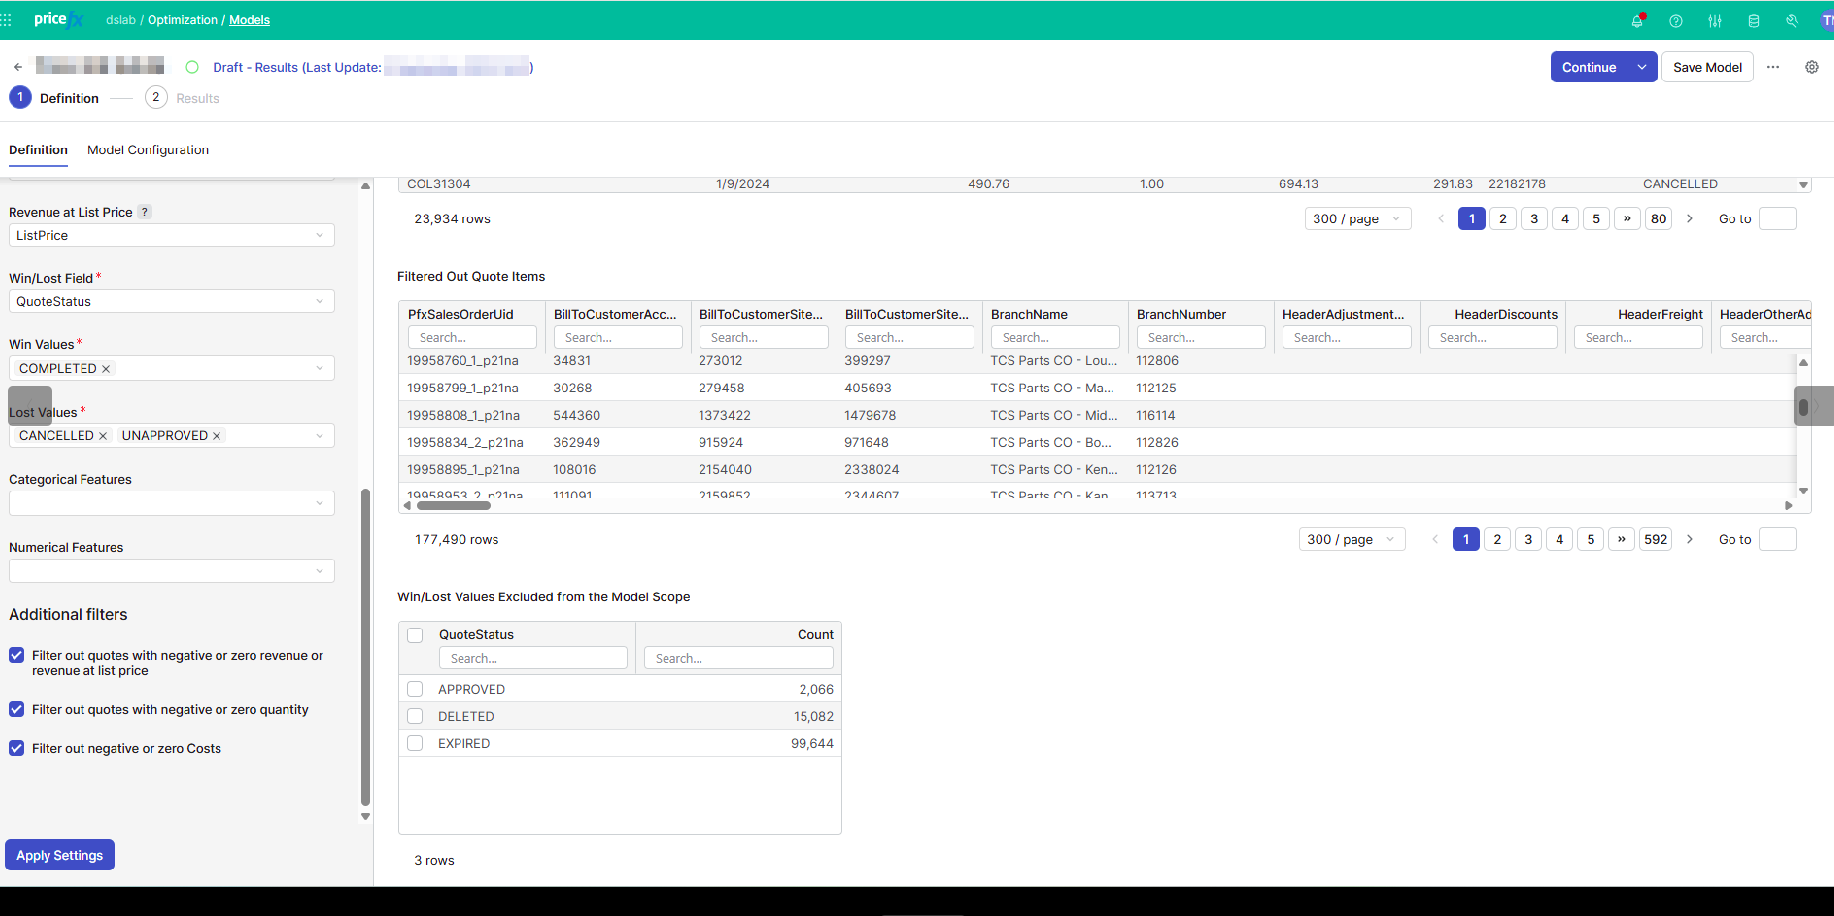
Once you apply the settings, the right panel provides:
-
Quote Items In Scope – Data that will be materialized in the model, and used for the training. Only the columns used in the model are displayed.
-
Filtered Out Quote Items – Data that are filtered out by the set transactions filter. All the columns of the source data are displayed.
By default, quotes exclude negative or zero values for quantity, revenue, and revenue at list price (if defined). They also exclude the undefined win or Lost rows. -
Win/Lost Values Excluded from the Model Scope - For each Win/Lost value not selected either in Win Values or Lost Values, the number of dropped data rows due to this.
Model Configuration Tab
In this tab, you define the model parameters.
-
Optimization Slider: not used in the training, but only to define what would be the optimal win rate. Do you want to maximize the revenue, the profit, or a mix of them?
-
Number of Days of Quotes kept for the Test Set: a subset of the source data is not used to train the machine learning and define the forecasted win rate. It is used then to check the validity of the model and avoid overfitting. The value is set to 30 days by default but can be changed. It is good to have around 25% of the data in the test set, but also to take care of the periodicity of your data. For instance if your data contain a bit more than one year of data, it may be intersting to let exactly one year in the training set and use the start of the following year as a test set.
-
Features To Include: Two metrics can be included or excluded from the model using checkboxes:
-
Quantity.
-
Unit List Price – This metric can be included only if Revenue at List Price is mapped in the Definition tab.
-
-
Price Metric Selection is an input table to set up some standard metrics in the model.
-
Margin Markup is defined as Margin / Cost
-
Discount % is defined as (List Price - Invoice Price) / List Price
-
Price Index is defined as Price / (average price of the product)
-
For each of those metrics, if you set the Monotonic field to Yes, then the model will force it (the win rate will decrease with increasing margin markup or price index, and will increase with increasing discount). It is not taken into account if the Price Metric is not included.
-
⚠️ the Discount % is included in the model only if the Revenue at List Price value is set in the Definition tab.
-
-
Feature Engineering: Three other metrics can be added to the model using check boxes:
-
Deal Size. The deals are based on the Quote field (defined in the Definition tab).
-
Deal Ratio. It is a ratio between the revenue corresponding to a given product and the deal size.
-
High Price Risk Adjustment. It is a way to force the adjustment related to the price index to force decrease, leading to a win rate forced to a value of 0 from a given price index. The high price risk adjustment is parametrized with two values: Starting from a Price Index of and Up to a Price Index of.
-
-
Model Parameters: There are advanced machine learning parameters, having helpers in the interface:
-
Maximum Number of Training Iterations
-
Early Stopping
-
Smoothing Iterations
-
Number of Pairwise Adjustments
-
Pairwise Smoothing Iterations
-
When the Definition step is done, you can go to the Results step. For this, use the Continue button at the top right.
Results Step
The Continue button at the Definition step will automatically run the machine learning calculation, initiating the Results step. This main calculation consists of a sequence steps:
-
preparation of the data, which includes light outlier cleaning to reduce the impact of extreme or erroneous values in the training data
-
run of the Python Engine model
The Results step has four tabs: Metrics, Feature Impact, Pairwise Impact, and Evaluation.
Metrics Tab
This tab displays a summary of the win rate model.
Feature Importance Portlet
The first portlet is a bar chart showing the features of the model by decreasing order of importance.
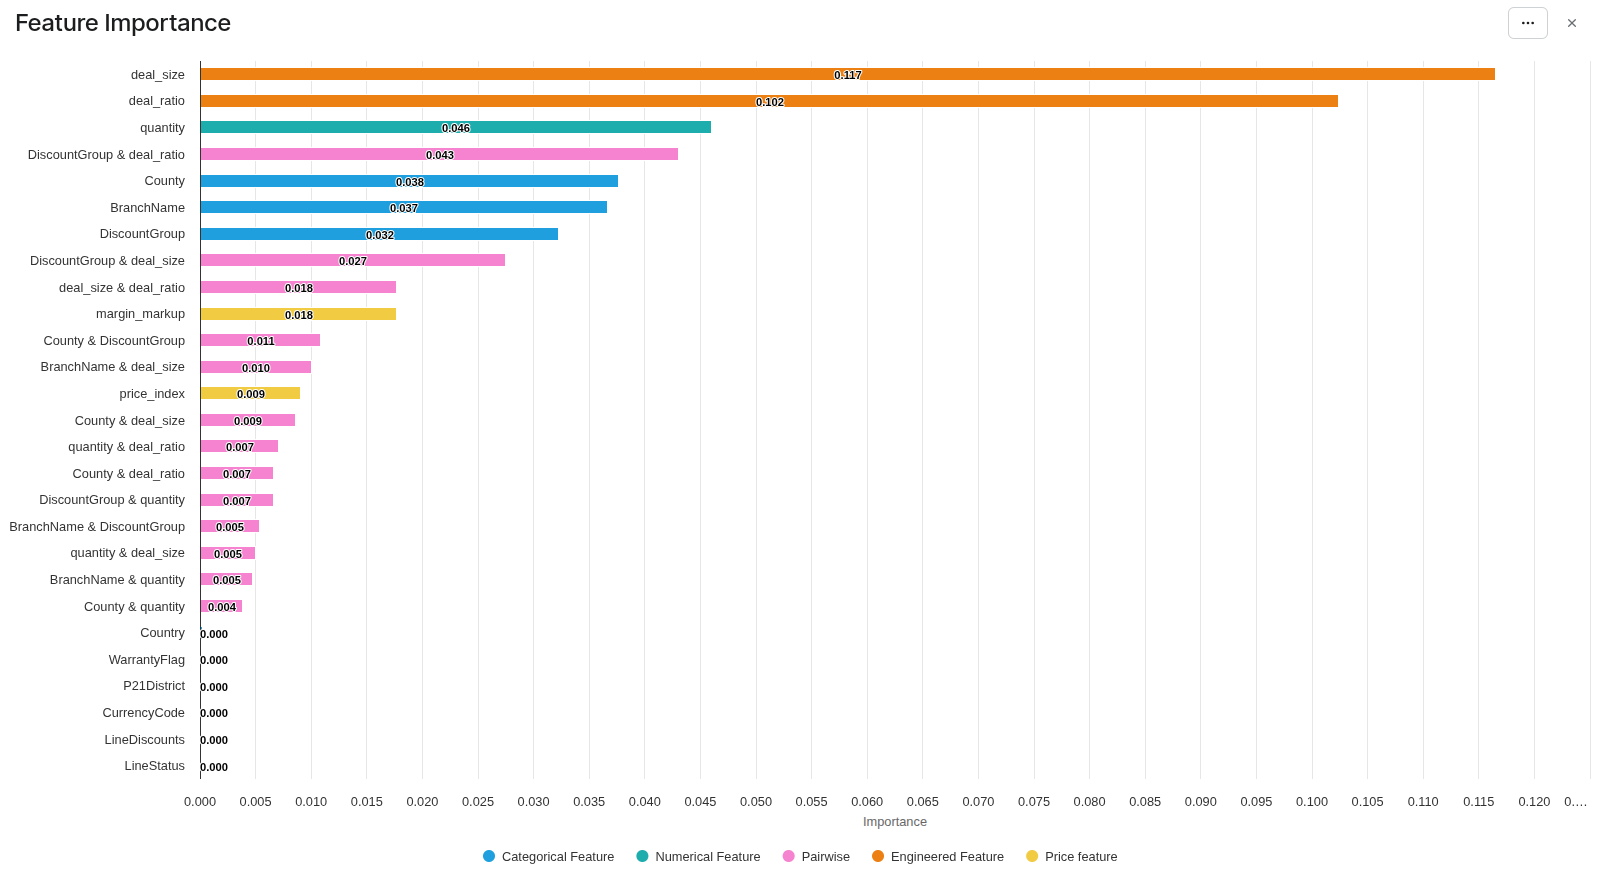
The features of the model are of five kinds, each of them having its color in the chart:
-
user features: the ones entered in the Definition tab. You can see if some features deserve to be dropped from the model.
-
categorical feautres (blue)
-
and numerical features (green).
-
-
processed features, all of them set in Model Configuration Business User Reference (Optimization - Win Rate):
-
price features: discount, markup, price index (yellow)
-
engineered features: deal size, deal ratio (orange)
-
-
The pairwise impacts: the training finds the features having combined effects. (pink)
Metrics Portlet
This is a table providing key values in the training and the test set. The main idea is to check that the test set is not too far from the training set. If it is, it means that the model is overfitting.
Win/Lost over Time Portlet
This is a summary of the input data, grouped by week. It shows the periodicity of the inputs, and the data used in the test set.
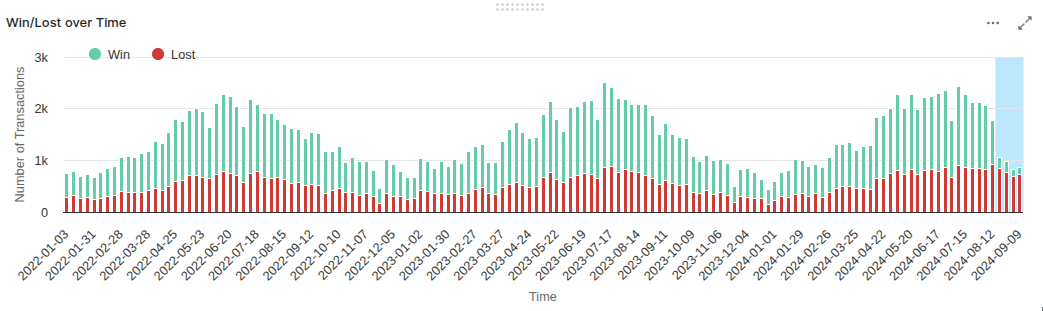
In this example, we see that the test data (blue zone) is significantly different from the training ones: much fewer wins. We also see a periodicity of one year. It would be better to reduce the scope of the model before August 2024 and to set the test size to keep part or all 2024. The training set would be the full years 2022 and 2023.
Model Information
This portlet lists some general information about the model:
-
If the discount feature has been forced removed from the model, in the case the revenue at list price is not mapped;
-
Constant features that are removed from the training.
-
Number of quotes excluded from the training due to outlier detection
-
Accuracy indicators for each analytically fitted price metric curve, helping to assess quality of the fit
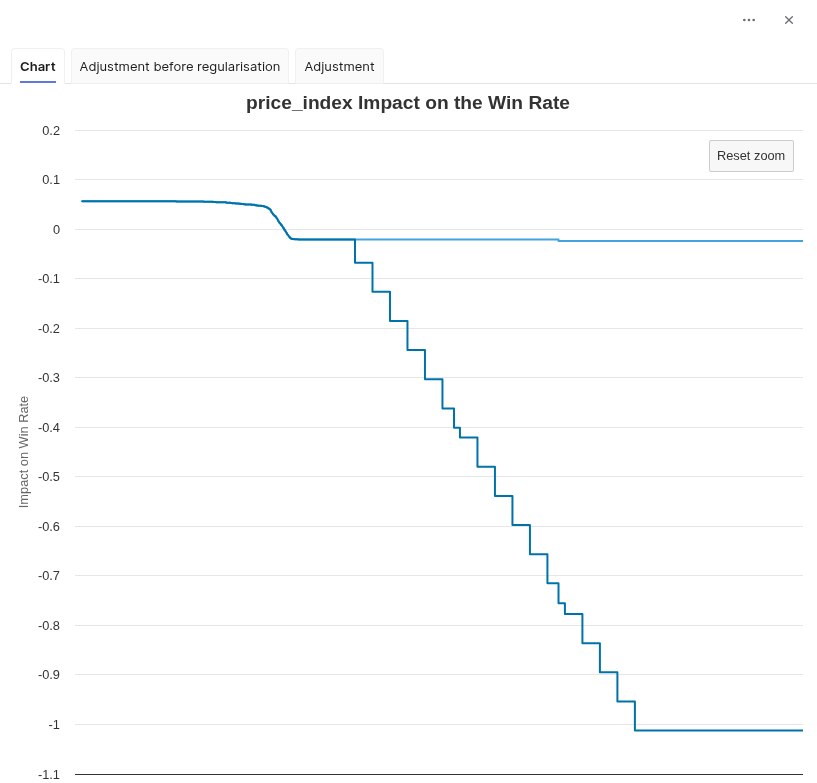
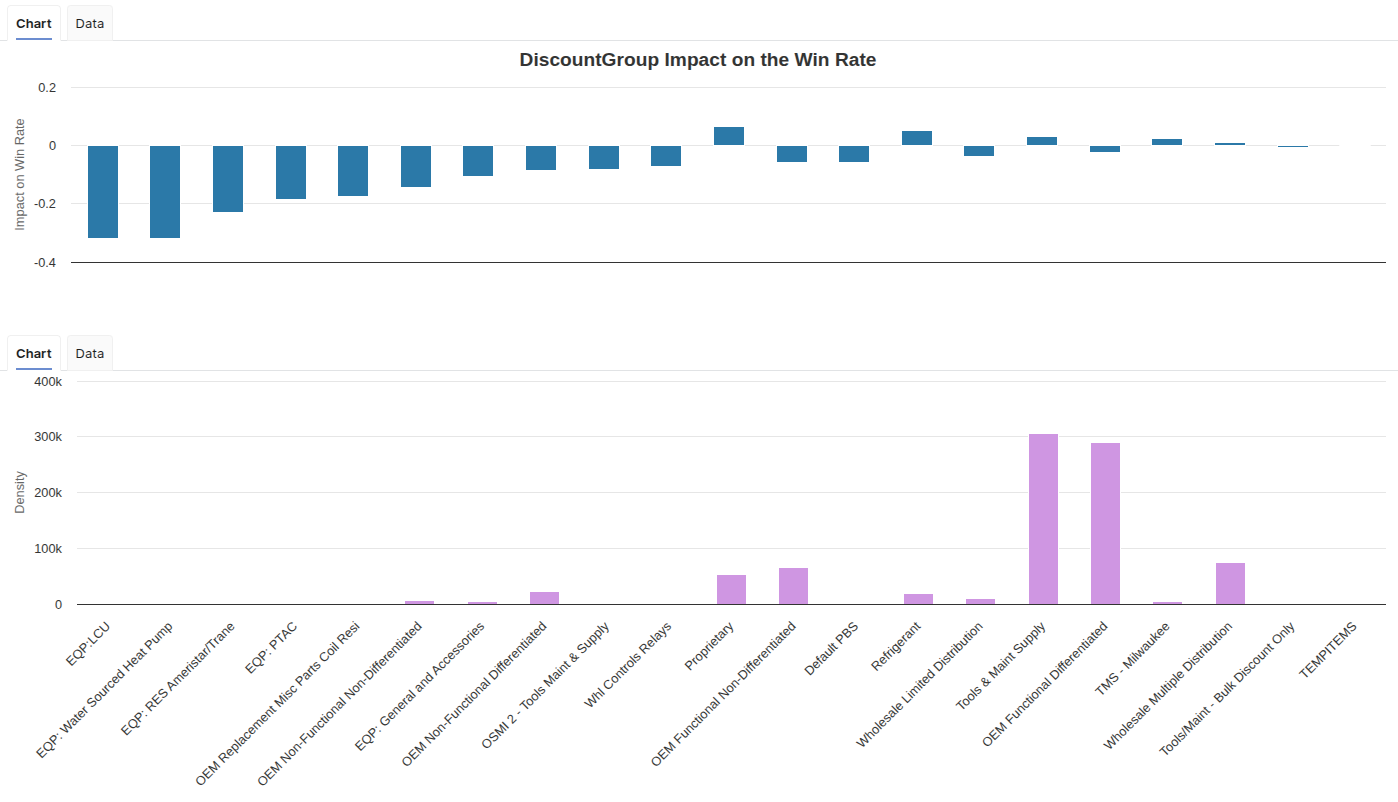
Feature Impact Tab
This tab shows how a given feature (chosen with the user input) impacts the win rate. There are two portlets.
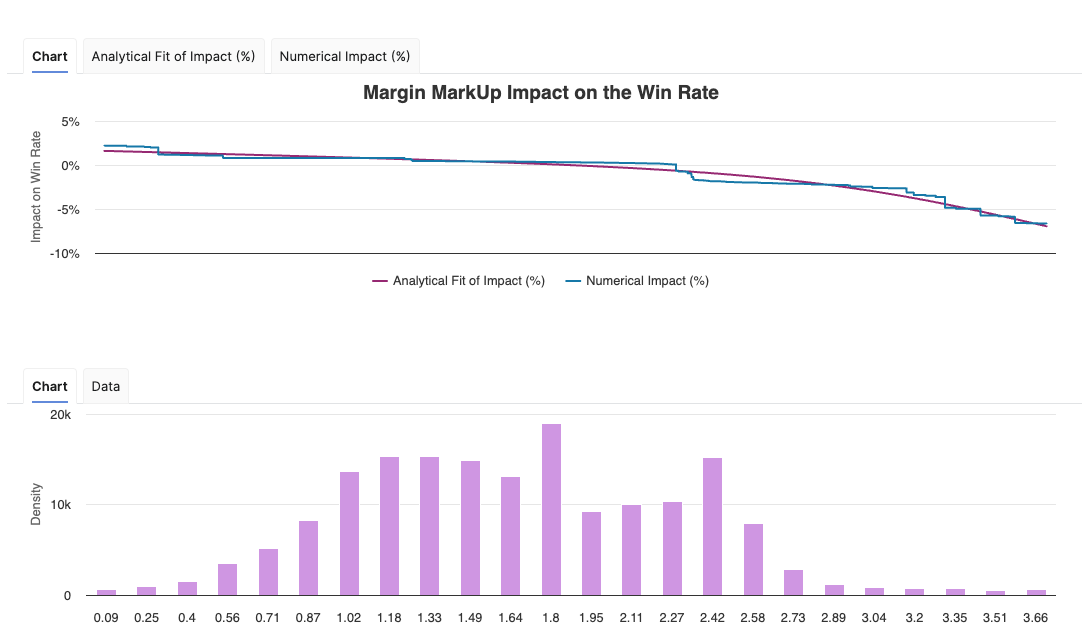
The top one is the impact of the feature value on the win rate. It is a line for a numerical feature, or bars for a categorical feature. In case of a categorical feature, the values are ordered by decreasing impact on the win rate. For the three price features (Discount %, Margin Markup, Price Index), the chart also shows a fitted analytical curve, that provides a smooth and consistent view of the impact on the win rate. The model uses this analytically calculated impact curve for all win rate impact assessments.
The bottom chart has the same x-axis as the top one and displays the density of each value.
Pairwise Impact Tab
As seen in the Metrics tab, there are some combined feature impacts in the win rate model. They are displayed in this tab, using heatmaps. For example, the combined impact of quantity and a feature called BranchName is illustrated below.
The user inputs in the left panel are interactive and correspond to the available pairwise impacts, knowing that not all pairs of features have a calculated pairwise impact.
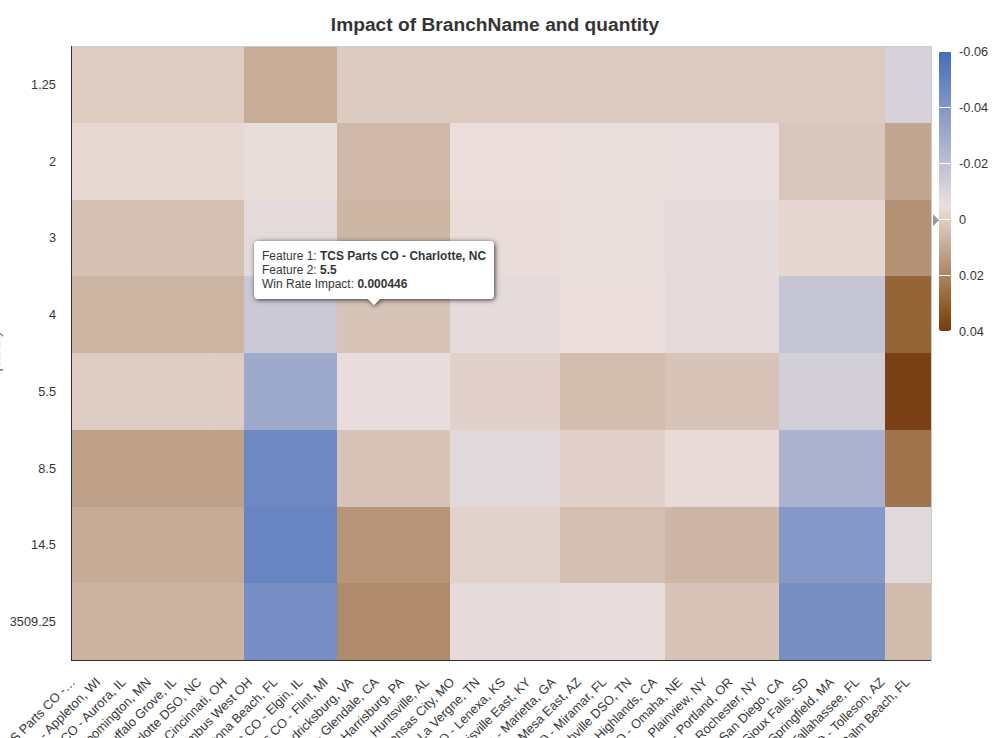
Here, high quantities have a negative impact on win rates on some BranchName values such as TCS Parts CO - Columbus West OH, and a positive impact on win rates on some BranchName values such as TCS Parts CO - Glendale, CA. In TCS Parts CO - West Palm Beach, FL, the most positive impact is for quantities around 5%.
Evaluation
This dashboard provides the forecasted win rate value for a given set of input values. The left dashboard provides all the required inputs for the given model. It is dynamically defined and reflects the model configuration.
-
If a model feature can be null, the corresponding value to choose in the user entry is “Null Value”.
-
If you want to evaluate on a new categorical feature value (not existing in the training set), the user entry value to set is “No Data”.
-
⚠️ The input values “Null Value” and “No Data” don’t correspond to the same concept, and don’t provide the same expected win rate. Use the one corresponding to your case.
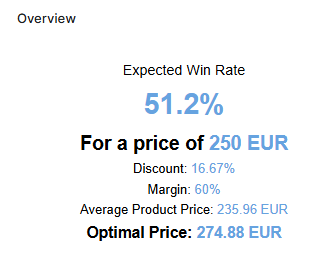
Two portlets are displayed:
-
Overview: provides the calculated win rate with the input values and the key metrics. The optimal price is the price maximizing the revenue and profit mix around the input price, other features staying identical. The mix is defined by the slider in Definition > Model Configuration.
-
Win Rate and Optimal Price is a chart displaying the variation in win rate together with the revenue and profit mix across the price range. The range is calculated around the input price as Min(unit cost × 0.8, input price − 25%) to Max(unit list price × 1.2, input price + 25%). The light blue plot band shows the search range for the optimal price, which is around the input price ±25%. A dot shows the input price on the revenue and profit curves, and a vertical dashed line shows the optimal price corresponding to the revenue and profit mix.
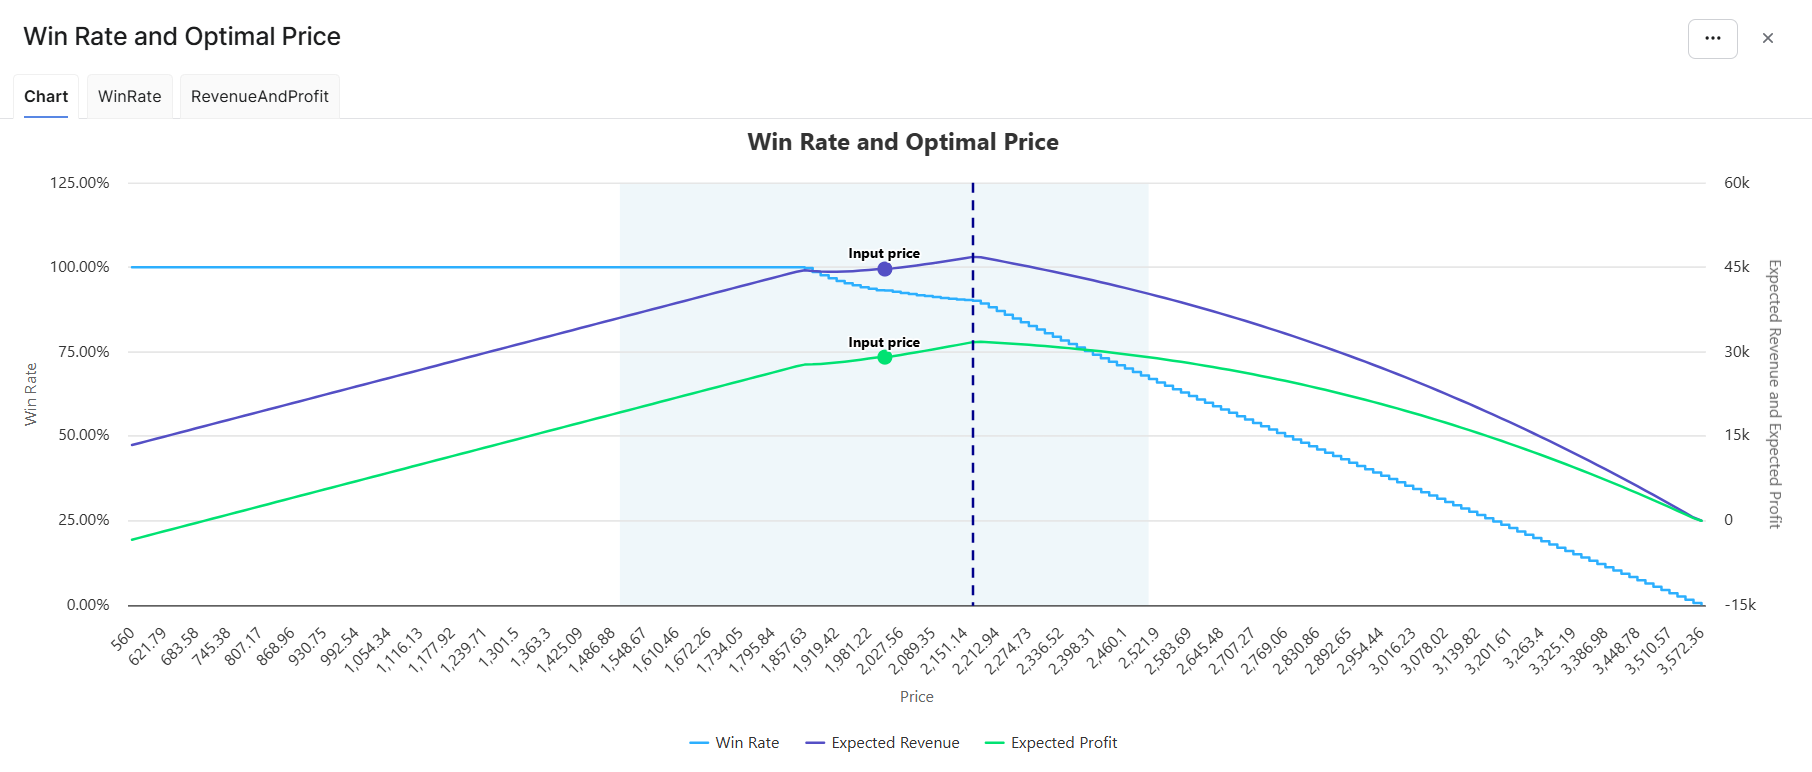
-
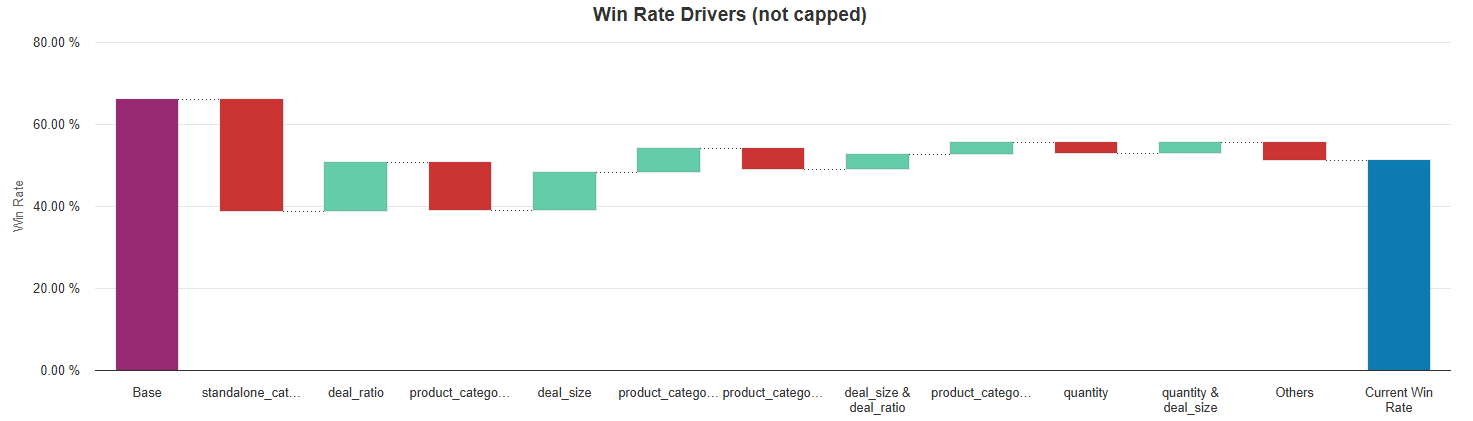
Win Rate Drivers (not capped) is a chart showing how the win rate value is calculated for a given set of inputs. Only the first 10 features of pairs of features (in terms of absolute adjustment value) are shown. The other ones are grouped into a last bar called “Others”. The positive adjustments are green bars, the negative ones are red bars. The last bar represents the win rate; it is not capped between 0 and 1, unlike the other win rate outputs.
Model Evaluation
The model can be evaluated from anywhere in the platform using model evaluation api. The command is:
api.model('MyModelName').evaluate('win_rate_score', evaluationParameters)
Evaluations can be run for a single item or multiple items at once and return overall results as well as per‑item results depending on the selected evaluation mode.
Possible evaluation outputs (depending on selected mode) are:
-
Overall win rate at input prices.
-
Base win rate - an average probability of winning.
-
Per‑item predicted win rate at the input price.
-
Per‑item optimized price and win rate at that optimized price. The optimization is based on a revenue and profit mix (according to the Optimization Slider setting on Model Configuration tab). Price variation is simulated at +/- 25% around the input price.
This API uses the same evaluation logic as Evaluation tab in the model, to ensure consistent outputs for the same inputs.
evaluationParameters
evaluationParameters should contain a list of input items and selected evaluation mode. Further details are documented here: Technical User Reference (Optimization - Win Rate) | Model Evaluation.