The Waterfall Comparison dashboard allows you to compare waterfalls of different time periods, products, and customers. The dashboard is built on top of a standardized Waterfall Dashboard and follows the same definition.
Set Up Data and Filters
When setting up data for Waterfall Comparison Dashboard, there are some common user inputs and some which are specific for each type of the comparison.
Specific User Inputs
The user inputs are slightly different for each type of the comparison:
-
per Date
-
Product
-
Customer
Comparison Waterfall per Date
|
Input |
Description |
|---|---|
|
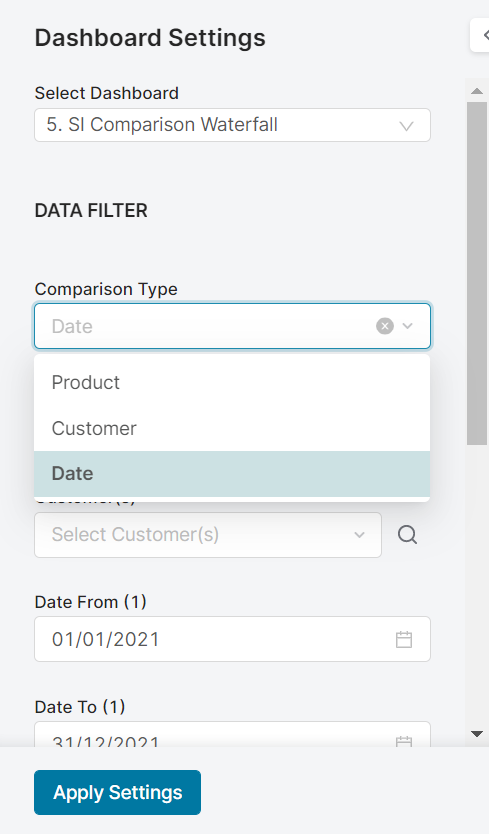
Comparison Type |
Date |
|
Product(s) |
Allows you to choose one of the product attributes to be used for the analysis. |
|
Customer(s) |
Allows you to choose one of the customer attributes to be used for the analysis. Displayed only when Customer data is used in the package ( |
|
Date From/To (Period 1) |
Defines a date range for data used in the analysis – the first range. Default Value:
|
|
Date From/To (Period 2) |
Defines a date range for data used in the analysis – the second range for comparison. Default Value:
|
Comparison Waterfall per Product
|
Input |
Description |
|---|---|
|
Comparison Type |
Product |
|
Product(s) 1 |
Allows you to choose one of the product attributes to be used for the analysis. |
|
Product(s) 2 |
Allows you to choose one of the product attributes to be used for the analysis for comparison. |
|
Customer(s) |
Allows you to choose one of the customer attributes to be used for the analysis. Displayed only when Customer data is used in the package ( |
|
Date From/To |
Filters data for the analysis according to the given time range. Default Value:
|
Comparison Waterfall per Customer
|
Input |
Description |
|---|---|
|
Comparison Type |
Customer. Available for selection only when Customer data is used in the package ( |
|
Product(s) |
Allows you to choose one of the product attributes to be used for the analysis. |
|
Customer(s) 1 |
Allows you to choose one of the customer attributes to be used for the analysis. |
|
Customer(s) 2 |
Allows you to choose one of the customer attributes to be used for the analysis for comparison. |
|
Date From/To |
Filters data for the analysis according to the given time range. Default Value:
|
Common User Inputs
There are also common inputs that do not change based on the selected Comparison Type:
|
Input |
Description |
|---|---|
|
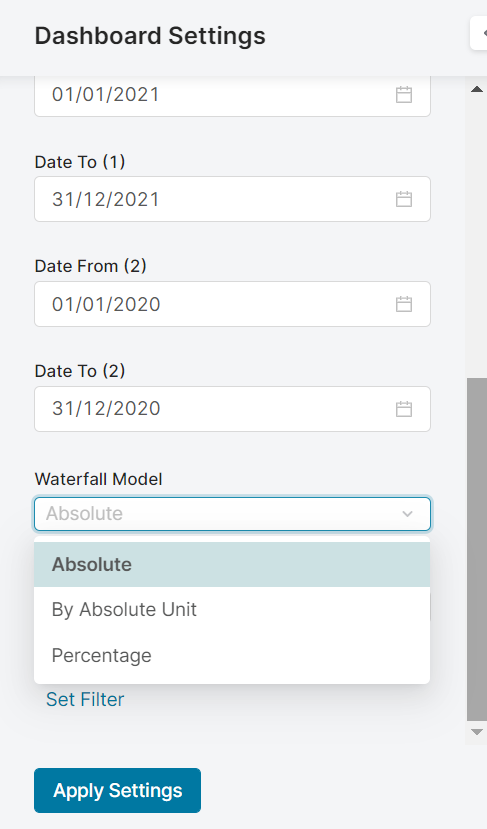
Waterfall Model |
Allows you to choose the display model used in the waterfall.Currently there are 3 models available:
|
|
Currency |
Allows you to choose the currency used in the dashboard. The exchange rate for the selected currency is fetched from system the |
|
Generic Filter |
Allows you to set a generic transaction data filter. For example: display only data from Europe or Asia. |
Analyze Results
For all three comparisons which are Product, Customer, and Date, there are the Waterfall Model types Absolute, Percentage, and By Absolute Unit. With enabled drill-down for adjustments.
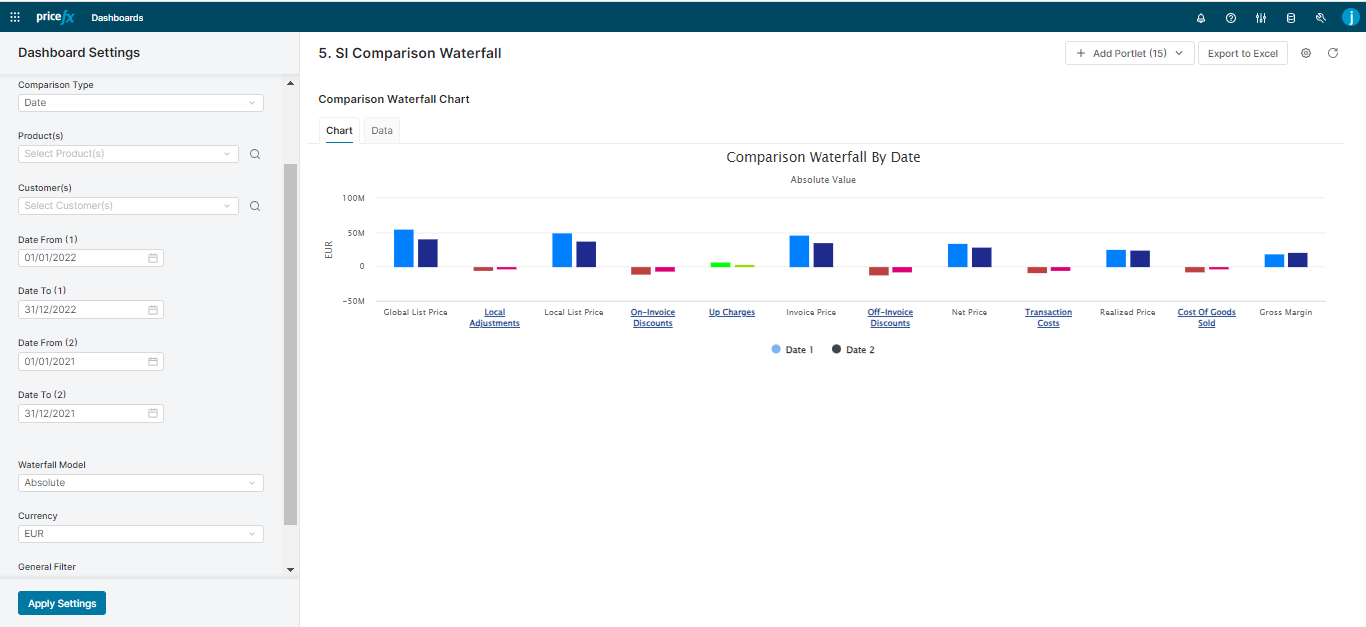
Comparison by Date
The purpose of the Waterfall Comparison by Date is to benchmark 2 different time periods, typically last year and current year.
Comparison Waterfall per Time Period
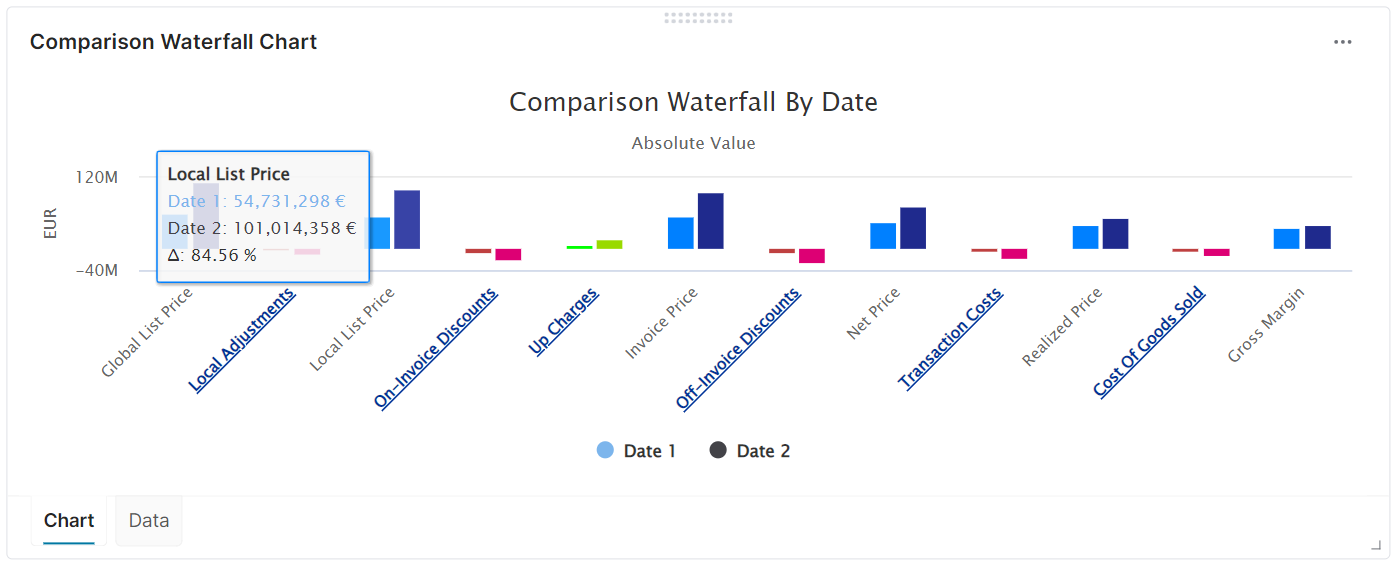
Waterfall Model is Absolute
Check total values for each waterfall elements and compare those vales in money amount.
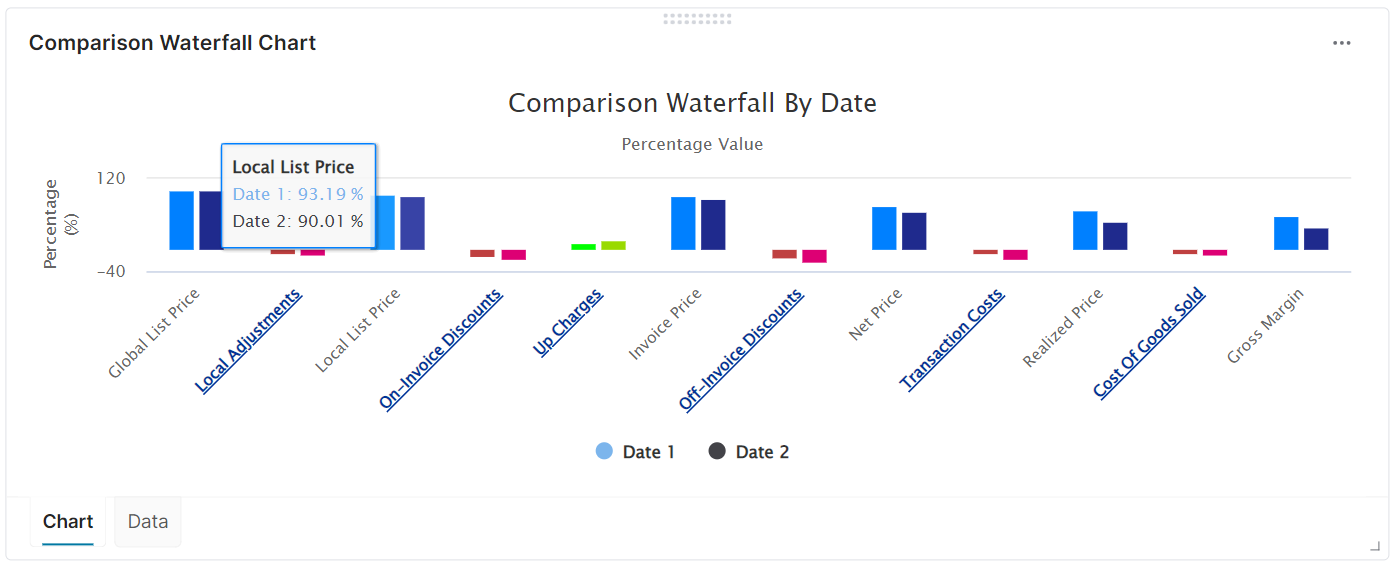
Waterfall Model is Percentage
Starting from one field defined in configuration as 100%, other values are normalized to get percentage.
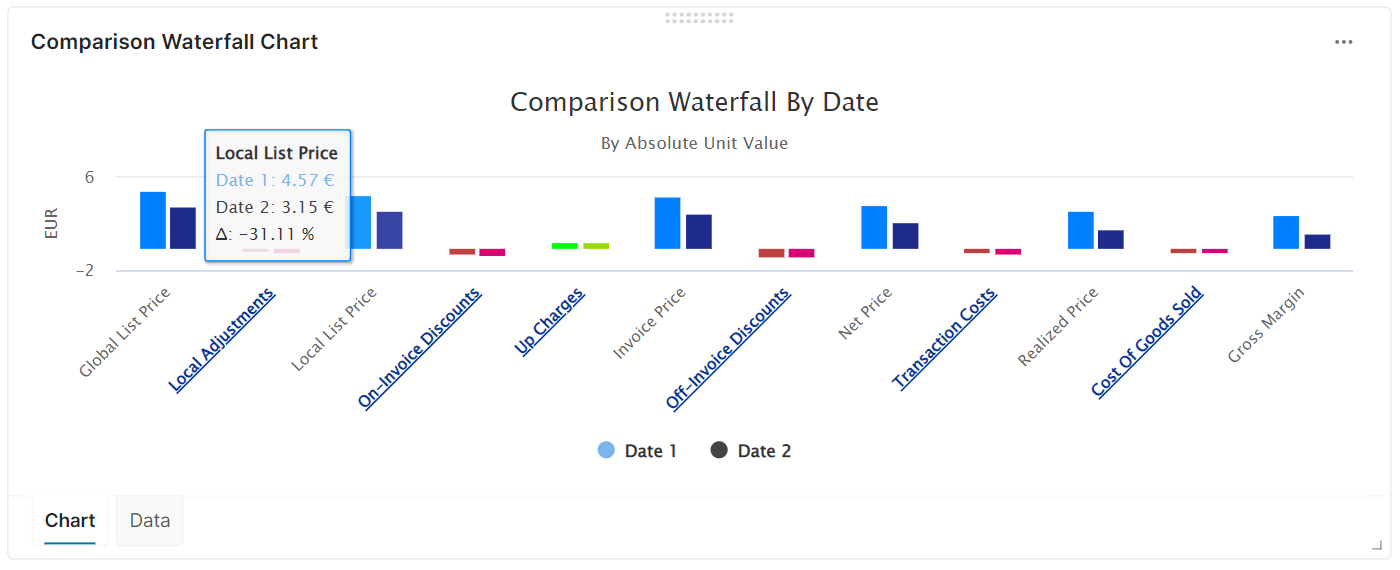
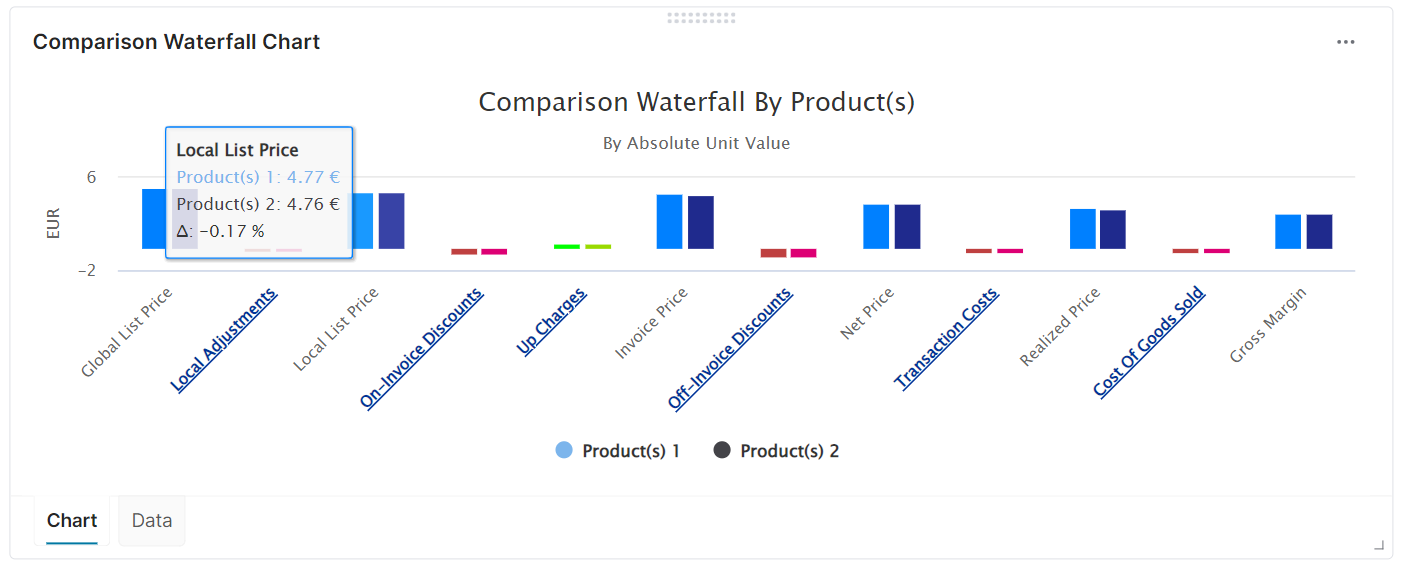
Waterfall Model is By Absolute Unit
Displaying the unit value for each waterfall element so you can check what are the unit price, unit cost and profit by product.
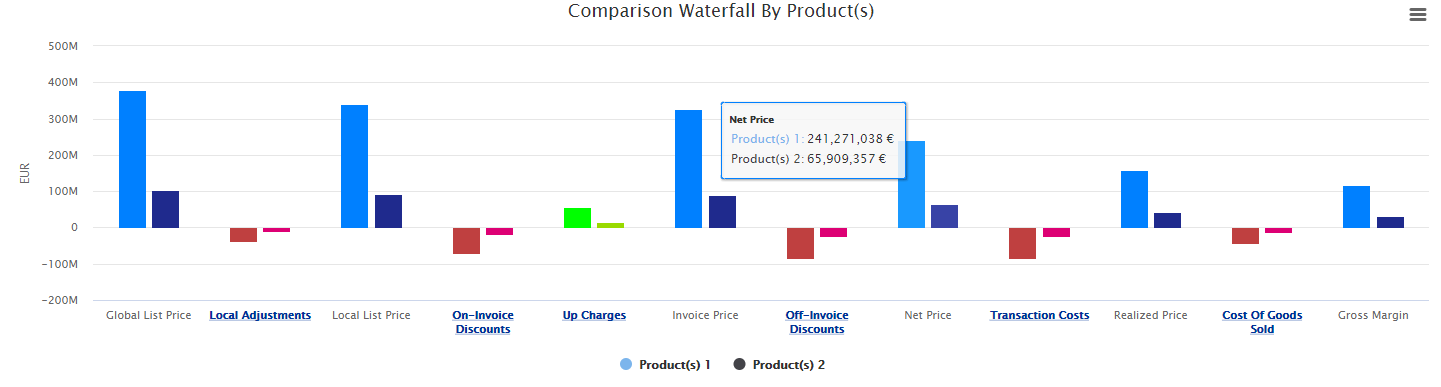
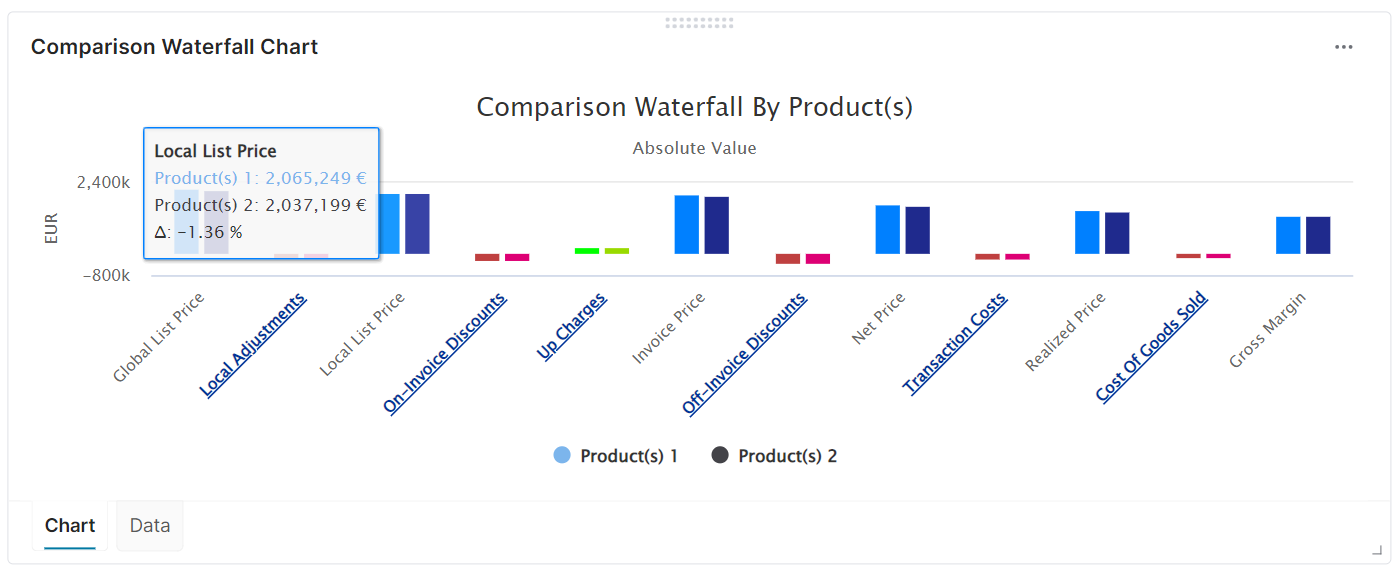
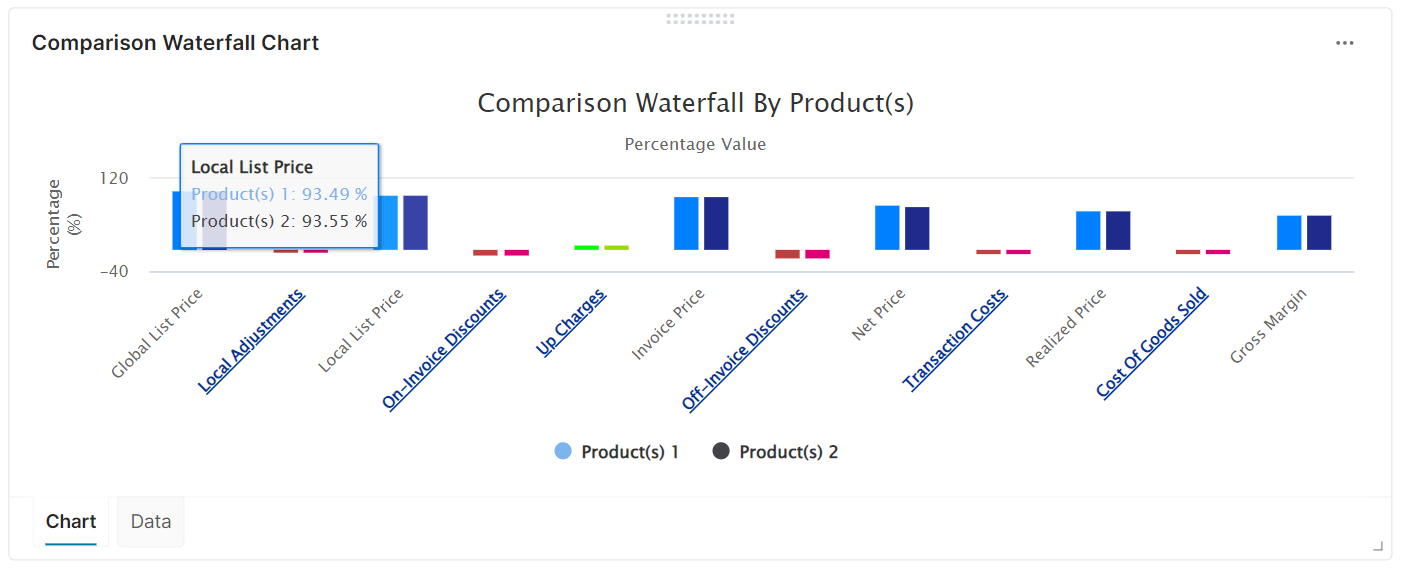
Comparison Waterfall per Product(s)
Waterfall Model is Absolute
Waterfall Model is Percentage
Waterfall Model is By Absolute Unit
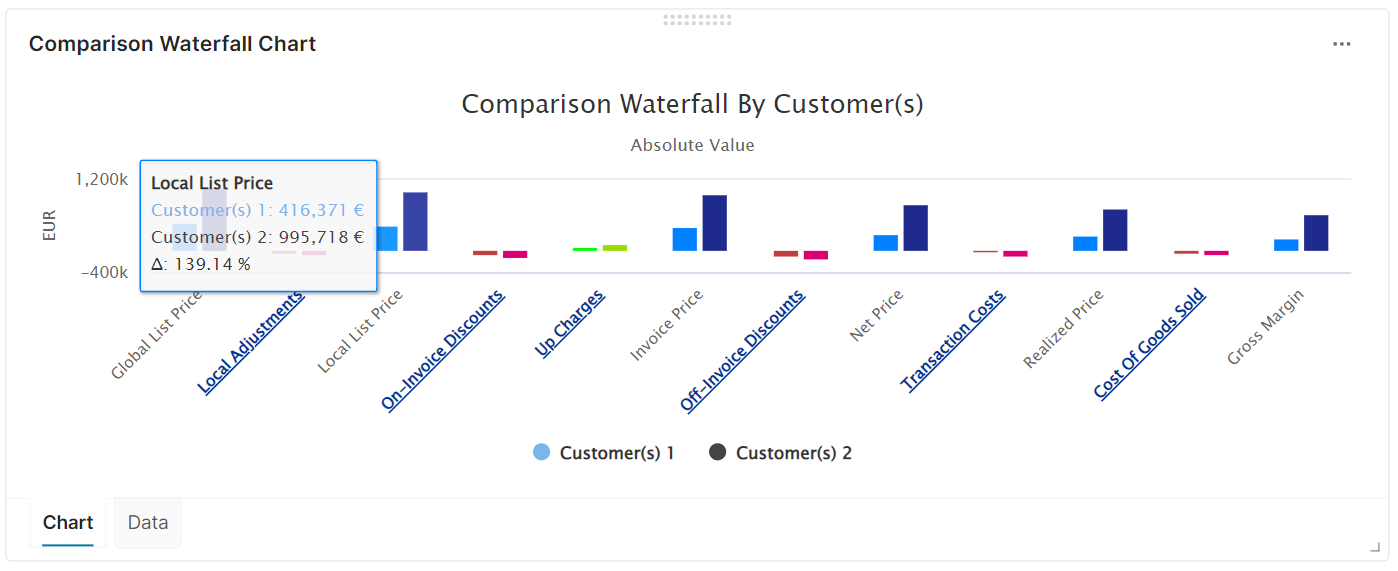
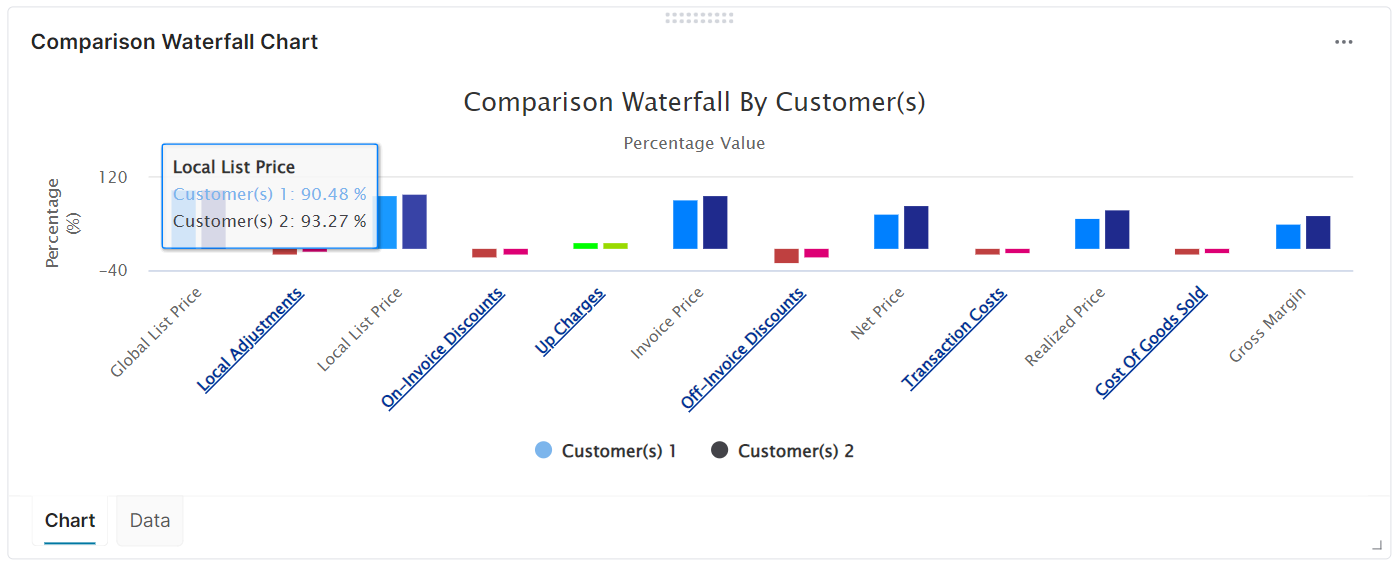
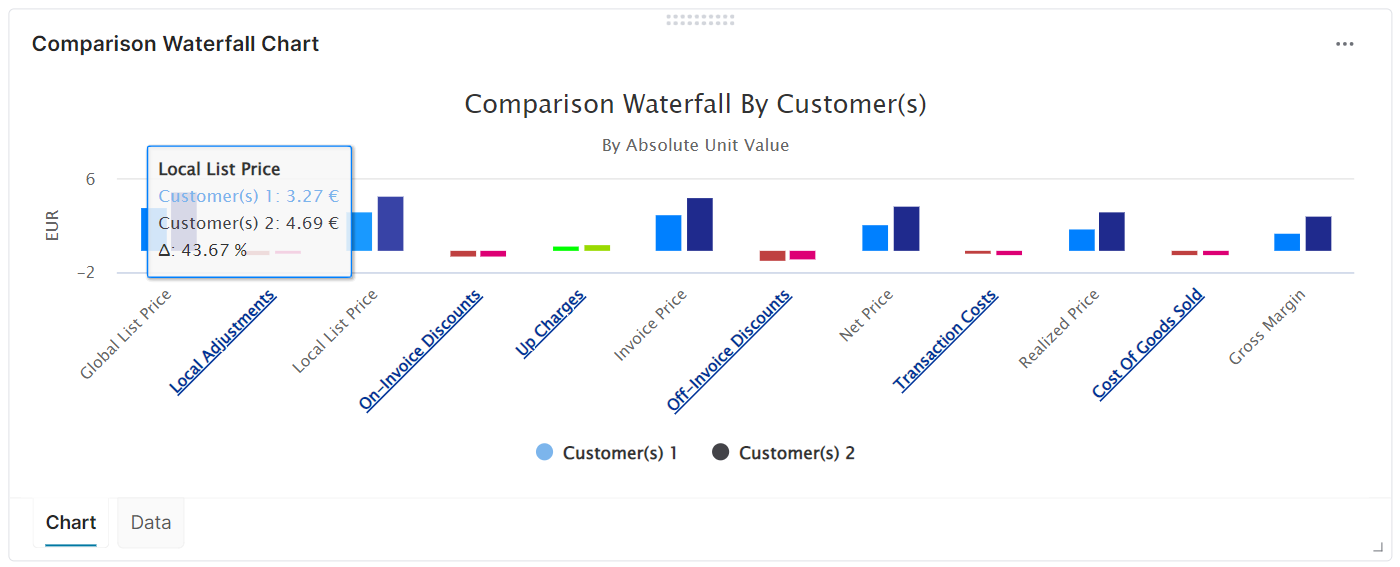
Comparison Waterfall per Customer(s)
Waterfall Model is Absolute
Waterfall Model is Percentage
Waterfall Model is By Absolute Unit
Used Advanced Configuration Fields
To learn about used advanced configuration fields, see Waterfall Comparison Dashboard (Technical User Reference).
Additional Information
Since version 1.14.0, a more user-friendly error message was implemented to help users better understand why the dashboard is not functioning properly. The previous generic error message, which appeared when the waterfall configuration step was skipped during deployment or was missing for any other reason, has been replaced by the following message:
Waterfall field mapping configuration is missing. Please contact your administrator.