Technical User Reference (Optimization - Product Similarity)
This section details the ModelClass and logics that the Product Similarity Accelerator deploys. For each step, its aim, outputs, and the main reasons to modify the logics are explained.
In this section:
Product Similarity Model Class
The Product Similarity Model Class organizes a list of logics to create the model architecture. It is a JSON file that refers to some logics and it is transformed into an optimized UI in the Pricefx platform.
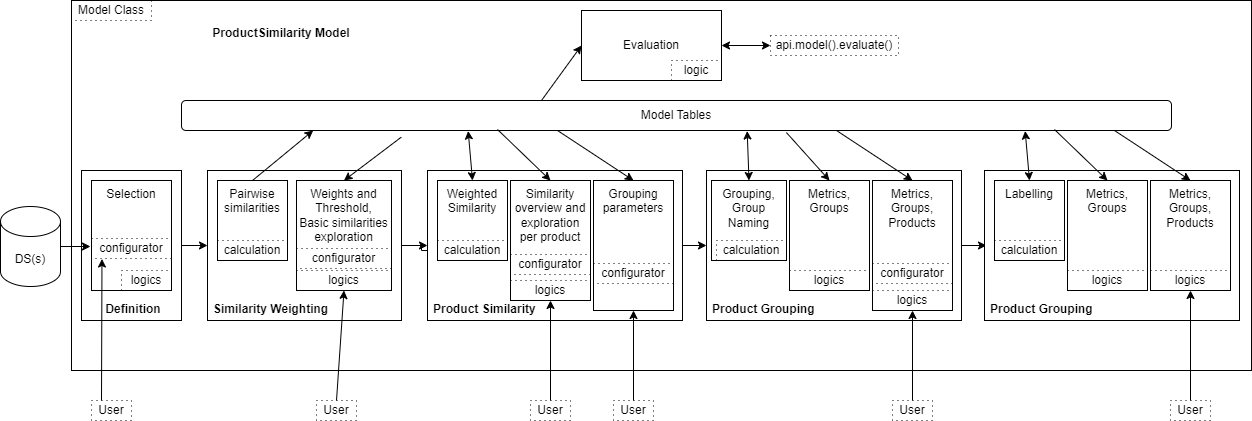
The general architecture of the Product Similarity Model Class is:
It defines five steps:
Definition – Sets the scope of the products tables and of transactions, and sets parameters for similarity exploration model.
Similarity Weighting – Runs similarity measures and screens for more similar products, then lets the user set the weights and threshold for finest comparison of products.
Product Similarity – Looks at the outputs of the similarity analysis, the similar products of any product and finally lets the user configure the grouping.
Product Grouping – Looks at the groups and products in the groups.
Additional Products – Looks at the groups and how new products are dispatched in these groups.
Library
The logic is PSim_Lib.
Aim of the logic
ProdSimMC_Lib is used in nearly all the other logics deployed by the accelerator and defines a set of functions needed specifically for this accelerator, but also some constants used to easily change the user interface wording. There are the following elements:
Parameters – Contains a function to check the type of the columns when exporting some tables.
Utils – Constants definition.
Labels– Groups static fields used for naming variables, tables...
Definitions – Sets of tools dedicated to the Definition step.
DataDefinitions – Sets of tools dedicated to interaction with data and user settings.
Configurators – Groups the methods to deal with formatting user inputs.
ConfigurationUtils – Groups the methods to deal with initialization of user inputs.
TableUtils – Groups the methods to interact with model tables by centralizing their name, label and the step that creates them.
MixpanelUtils – Tools for tracking of model usage inside Mixpanel.
It is accessed via the calls on libs.PSimMC_Lib.XXX in the code.
Common reasons to modify the logic
Change text visible to users in LabelUtils or in case of table / table fields names in TableUtils.
If there is another kind of input to deal with.
Definition Step
There is no calculation logic in this step, and there are three tabs with related dashboard and evaluation logics: PSim_1_definitions_eval_productData and PSim_1_definitions_eval_transactionData and PSim_1_definitions_eval_modelConfiguration.
Aim of the logics
These logics provide the user inputs to define at least a source of product data to map it, and optionally to define a source of transactional data (plus mapping) and to define what kind of text transformer to use, as well as the maximum number of similar products to keep in the following analysis.
Outputs of the evaluation
A table of the filtered product data and optionally, a table of the filtered transactional data that will be used for the similarity analysis.
Common reasons to modify the logics
Some other mappings are needed or would be retrieved.
Some customized metrics that will require specific developments.
To define pre-set filters.
To add a chart to better understand the data. (Caution: it can take long, as the data are not yet stored in the model.)
Similarity Weighting Step
Contains one calculation sequence that chains 4 logics PSim_2_simWeights_calc_loadData, PSim_2_simWeights_calc_textTransformers, PSim_2_simWeights_calc_approxNearestNeighbors, and PSim_2_simWeights_calc_coProductMetaData that are executed when accessing this step. The dashboard is split in two panels, one for user inputs, the other for evaluation.
Calculation: Data Aggregation
The logic is PSim_2_simWeights_calc_loadData.
Aim of the logic
Aggregates the selected products and transactions data at the levels of ProductID defined by the user in the Definition step.
Outputs of the calculation
Model tables of the aggregated data: productTable
Common reasons to modify the logic
To add a chart to better understand the data.
Calculation: Text Transformation
The logic is PSim_2_simWeights_calc_textTransformers.
Aim of the logic
Transform the set of textual descriptors of each product in a vector of numerical values. Transformed data of products are stored in the model table called textEmbeddings. As this computation may require a lot of time and resources, the model tables are not rewritten each time but extended whenever a new product is encountered. A unique link between a product and its corresponding embedding uses ProductId. The table is erased when the user asks for a recomputation or changes to the language model.
Outputs of the calculation
Model tables of the transformed data: textEmbeddings
Common reasons to modify the logic
To add a chart to better understand the data.
To combine different transformers.
Calculation: Raw Similarity
The logic is PSim_2_simWeights_calc_approxNearestNeighbors.
Aim of the logic
Selects among all possible pairs of products a subset of pairs to compare. The comparison is based on the three kind of products’ attributes Textual, Numerical, Categorical.
Outputs of the calculation
Model table of unweighted distances between products: approximateNeighbors
summaryStats used for displaying high level information.
Common reasons to modify the logic
To subset the distances in more atomic ones based on a better/specific business knowledge.
Calculation: CoProductMetaData
The logic is PSim_2_simWeights_calc_coProductMetaData .
Aim of the logic
Provides for each product a subset of the best similar candidates.
Outputs of the calculation
Model tables of the product pairs: coProductMetaData
Setup Panel
The logic is PSim_2_simWeights_eval_simWeights and uses PSim_2_simWeights_eval_inputSimWeights_Configurator.
Aim of the logic
It collects user inputs for:
Weighting Textual Similarity
Weighting Categorical Similarity
Weighting Numerical Similarity
Setting the similarity threshold to keep (or not) a pair of products
Selecting one product at a time to visually evaluate its similarities
Outputs of the evaluation
User inputs.
Common reasons to modify the logic
To differentiate threshold per similarity
EvaluationPanel
The logic is PSim_2_simWeights_eval_simWeights .
Aim of the logic
Exposes to the user some information about the final scope of the product similarity analysis:
Products relationships data that can help in defining settings in the left panel
Statistics about distribution of similarity measures
Composition of the similarity based relationship of the select product
Data about the selected product
Data about products that have been considered similar to the selected product
Outputs of the evaluation
Overview before/after the threshold setting.
Displaying Box plot diagrams.
Displaing similarities for most similar products.
Common reasons to modify the logic
There could be different parameters to customize the scope of the product similarity analysis and their impact should be exposed here.
Product Similarity Step
Starts with one calculation logic PSim_3_similarity_calc_productSimilarity that is executed when accessing this step which splits in three tabs: Similarity Overview, Similarity Dashboard, and Similarity Grouping. First, this calculation subsets the products' pairs that fulfill the minimum similarity criterion and saves them in a model table. Then, some other model tables are prepared to have the data ready for display in the dashboard’s histograms and tables, particularly similarityTable.
Similarity Overview
The logics is PSim_3_prodSimilarity_eval_simOverview.
Aim of the logics
This dashboard provides insights about the computed similarities, based on the thresholds in some meaningful portlets. An overview gives macroscopic values: the number of products, average number of similar products, average score. Then some histograms give the user an idea of the distribution of the similarity score and of the number of neighbors a product may have.
Outputs of the evaluation
As for any other evaluation logic, there is no real output, it displays a dashboard.
Common reasons to modify the logics
To display other charts or to provide meaningful information in a different way.
Similarity Dashboard
The logic is PSim_3_prodSimilarity_eval_simDashboard which proposes an interactive dashboard for exploration of one product’s similarities.
Aim of the logic
In the configuration panel on the left, the user selects a product by its ProductID. All available information about this product and how it is connected with its neighbors are displayed on the right.
Outputs of the evaluation
As with any other evaluation logic, there is no real output, it displays a dashboard.
Common reasons to modify the logic
To display other charts or to provide meaningful information in a different way.
Similarity Grouping
The logic is PSim_3_prodSimilarity_eval_simGrouping.
Aim of the logic
This configurator lets the user set grouping parameters for the next step, including some constraints on the size of groups, the way groups are named and finally triggers (or not) some graph display that can cause trouble in case of oversized datasets.
Outputs of the evaluation
Internal parameters saved for next step.
Common reasons to modify the logic
If there is a new parameter for the grouping that the user needs to set.
Product Grouping Step
Starts with two calculation logics named PSim_4_community_calc_wavgCommunity and PSim_4_community_calc_namingCommunity called in sequence.
Aim of the logics
The first one turns the similarity model table into a network of products upon which it is possible to make some clustering based on network topology.
After this grouping process a naming process tries to give each group a meaningful name using contained product’s name and selected descriptors. The inflect external library has been chosen as a trade-off between quality and time consumption to select only one figure of a word, either singular or plural, but not all words are recognized.
Outputs of the evaluation
A set of model tables used by the dashboards.
Common reasons to modify the logics
To export other tables and thus provide more information in the dashboards.
To find a better library for naming the groups.
Similarity Grouping Dashboard
The logic is PSim_4_prodGrouping_eval_simGrouping.
Aim of the logic
This dashboard provides the macroscopic view of Similarity Groups, their name and a summary of their content.
Outputs of the evaluation
As in any other evaluation logic, there is no real output, it displays a dashboard.
Common reasons to modify the logic
To display other charts or to provide meaningful information in a different way.
Product Overview
The logic is PSim_4_prodGrouping_eval_prodOverview.
Aim of the logic
This interactive dashboard provides a view on the content of the similarity groups displaying direct links between products. The user selects the name of the similarity groups they want to display.
Outputs of the evaluation
As in any other evaluation logic, there is no real output, it displays a dashboard.
Common reasons to modify the logic
To display other charts or to provide meaningful information in a different way.
Setting for Additional Products
The logic is PSim_4_prodGrouping_eval_additionalProduct.
Aim of the logic
This configurator lets the user set parameters for the next step, including mainly the perimeter of data to consider as new products, the minimal threshold of similarity to consider products as neighbours, the criteria to set a new product into an existing group.
Based on majority – Computation based on the cardinality of similar products above the similarity threshold.
Based on most similar products – Computation based on the average similarity by group computed for similar products above the similarity threshold.
It is possible to use the option “Also assign products below similarity threshold”, so if no similar product is above the similarity threshold, it takes the most similar product to define the group. If the opion is not checked, then such products are not assigned and are labelled with a tag “Not assigned”.
Outputs of the evaluation
User can visualize the tables showing the scope that has been selected.
Internal parameters saved for the next step.
Common reasons to modify the logic
If there is a new parameter for grouping that the user needs to set.
More Products Step
Contains two calculation logics named PSim_5_newProducts_calc_loadNewData and PSim_5_newProducts_calc_labelingNewProducts that are automatically triggered when accessing this step. The first one loads the data about new products using the filters defined in the previous step. The second one is more complex:
Prepares the data for comparison purposes.
Computes embeddings only for new products that are unknown (to reduce resources usage and computation time).
Labels New Products using the parameters selected by the user (metric type, most similar or majority) and a nearest neighbor approach that allows each new product to find its best neighbors in the graph of similarity made using original products. This process is multi-threaded, so each new product will explore the graph of already labelled products to find its right place in an independent thread. The number of simultaneous threads equals to the number of available CPUs. For graph search, the function process_new_product present in Python Engine starting with version v9 is used.
Saves the results in model tables, particularly newProductTable.
This step can be re-run several times on different subsets of products by changing the setting from the last tab of the previous step. Each new run will result in an extension of the table which stores results with the new products affectation, including the time stamp of the run.
New Products
The logic is PSim_5_moreProducts_eval_newProducts.
Aim of the logic
This dashboard provides some macroscopic data on the scope (total number of products, number of products used for “original” group formation, total number of new products that have been labelled, and number of new products labelled from the last run).
It shows the table of products with their group and if they are considered not extended (originals) or extended (new products) and when the computation has been done. This table is in fact the model table SimilarityTableExtended.
It shows also a table with the best original neighbors of each new product.
Outputs of the evaluation
As in any other evaluation logic, there is no real output, it displays a dashboard.
Common reasons to modify the logics
To display other charts or to provide meaningful information in a different way.
Updated Groups
The logic is PSim_5_moreProducts_eval_updatedGroups.
Aim of the logic
This dashboard provides some simple data about the groups.
First, a table of groups and how many new products have been added to each one.
Second, an illustrative Sankey diagram of the 60 first groups and how they have been dispatched the new products inside.
Outputs of the evaluation
As in any other evaluation logic, there is no real output, it displays a dashboard.
Common reasons to modify the logics
To display other charts or to provide meaningful information in a different way.
Evaluations
The model has one evaluation: PSim_ModelEvaluation_Eval. That allows you to retrieve for one product or a list of products all the raw similarities that have been computed for it/them. For more details about model evaluations see Query Optimization Engine Results | Using the Evaluator.