Revenue, Margin and Volume Trend Last 12 Months
First, the respective metric (revenue, margin or volume) is calculated for every single time unit.
Customer level: time unit = month
Product level: time unit = month
The least-square approach is used to compute the trend. See the Fitting a trend: Least-squares section in the Linear trend estimation Wikipedia article.
Formula
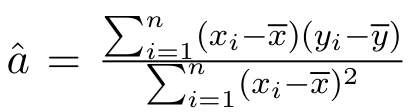
-
x is the month number (like month 1 would be the first month in scope)
-
x̄ is the average month number
-
y is the metric to consider, like margin
-
ȳ is the average metric to consider, like average margin
To convert the trend value â back to a percentage, the following formula is used: â / average(metric)
Periods with no transactions are considered to have zero revenue, margin, and volume, and are included in the trend computation.
Example
Find the example in the the following attachment:
Trend Value with least square .xlsx
This calculation is utilized in the following portlets affected by the trend calculation change:
-
-
Customer Summary (Trends, Health Score)
-
Customer Health Summary (Health Score)
-
Trends (Trends)
-
-
-
Customer Summary (Trends, Health Score)
-
-
-
Customer Summary (Trends, Health Score)
-
Trends (Trends)
-
Product Health Summary (Health Score)
-
Average Invoice Price per Customer Revenue Class Last 12M (Product Classification)
-
Revenue, Margin and Volume Trend YTD
The least-square approach is used (see the Last 12 Months computation above). This calculation is utilized in the portlets (mentioned above) affected by the trend calculation change.